The subarcsecond mid-infrared view of local active galactic nuclei:
III. Polar dust emission
††thanks: Based on European Southern Observatory (ESO) observing programmes
60.A-9242,
074.A-9016,
075.B-0182,
075.B-0621,
075.B-0631,
075.B-0727,
075.B-0791,
075.B-0844,
076.B-0194,
076.B-0468,
076.B-0599,
076.B-0621,
076.B-0656,
076.B-0696,
076.B-0743,
077.B-0060,
077.B-0135,
077.B-0137,
077.B-0728,
078.B-0020,
078.B-0173,
078.B-0255,
078.B-0303,
080.B-0240,
080.B-0860,
081.B-0182,
082.B-0299,
083.B-0239,
083.B-0452,
083.B-0536,
083.B-0592,
084.B-0366,
084.B-0606,
084.B-0974,
085.B-0251,
085.B-0639,
086.B-0242,
086.B-0257,
086.B-0349,
086.B-0479,
086.B-0919,
087.B-0746,
382.A-0604,
382.B-0732,
384.B-0143,
384.B-0887,
384.B-0943,
385.B-0051,
385.B-0896,
385.B-0981 and
386.B-0026.
Abstract
Recent mid-infrared (MIR) interferometric observations showed in few active galactic nuclei (AGN) that the bulk of the infrared emission originates from the polar region above the putative torus, where only little dust should be present. Here, we investigate whether such strong polar dust emission is common in AGN. Out of 149 Seyferts in the MIR atlas of local AGN (Asmus et al.), 21 show extended MIR emission on single dish images. In 18 objects, the extended MIR emission aligns with the system axis position angle, established by [O III] , radio, polarisation and maser based position angle measurements. The relative amount of resolved MIR emission is at least 40 per cent and scales with the [O IV] fluxes implying a strong connection between the extended continuum and [O IV] emitters. These results together with the radio-quiet nature of the Seyferts support the scenario that the bulk of MIR emission is emitted by dust in the polar region and not by the torus, which would demand a new paradigm for the infrared emission structure in AGN. The current low detection rate of polar dust in the AGN of the MIR atlas is explained by the lack of sufficient high quality MIR data and the requirement for the orientation, NLR strength and distance of the AGN. The James-Webb Space Telescope will enable much deeper nuclear MIR studies with comparable angular resolution, allowing us to resolve the polar emission and surroundings in most of the nearby AGN.
Subject headings:
galaxies: active – galaxies: Seyfert – infrared: galaxieserg
I. Introduction
The nuclear infrared emission from radio-quiet active galactic nuclei (AGN) is generally associated with dust in the parsec scale environment of the supermassive black holes (Antonucci, 1993; Netzer, 2015). While single-telescope observations have been inefficient in directly imaging this region, infrared interferometry provided the proof of this picture over the last decade (e.g. Jaffe et al., 2004; Tristram et al., 2007; Beckert et al., 2008; Kishimoto et al., 2009, 2011; Burtscher et al., 2013). In the standard unification scheme, it is assumed that the dust forms an optically- and geometrically thick ring (“dusty torus”) around the black hole, which causes many of the observed differences in the various classes of AGN.
A detailed look at the infrared emission revealed the the spectral energy distribution (SED) of the AGN contains several components with a hot-dust peak in the near-infrared and a stronger peak in the mid-infrared (MIR) being the most prominent features (e.g. Edelson & Malkan, 1986; Kishimoto et al., 2011; Mor, Netzer & Elitzur, 2009). Spectral decomposition suggested that the MIR component, which usually is the global maximum of the nuclear infrared SED, corresponds to the emission from the torus, approximately aligned with the plane of the inner accretion disk, while the weaker near-infrared peak might be hot dust in the inner narrow-line region (NLR; e.g. Groves, Dopita & Sutherland, 2006; Mor, Netzer & Elitzur, 2009; Mor & Netzer, 2012).
Infrared interferometry currently provides the only means to directly resolve the parsec-scale dusty environment. Surprisingly, it was shown that the MIR, not the near-infrared, emission shows a strong polar-extended component on these small scales, accounting for more than half of the total MIR emission (Raban et al., 2009; Hönig et al., 2012, 2013; Tristram et al., 2014). On the other hand, the near-infrared emission may originate from the disk plane (Hönig et al., 2013). If confirmed as generic features, these findings pose a major challenge to standard torus models, which assume a single emitting dusty structure confined towards the mid-plane of the AGN (e.g. Nenkova et al., 2008; Hönig & Kishimoto, 2010; Stalevski et al., 2012).
The extent of these polar wind structures can sometimes be detected on scales beyond few parsecs. Some nearby Seyfert galaxies display extended emission in single telescope MIR images on scales of several tens of parsecs (e.g. Braatz et al., 1993; Cameron et al., 1993; Bock et al., 2000; Radomski et al., 2002, 2003; Whysong & Antonucci, 2004; Packham et al., 2005; Reunanen, Prieto & Siebenmorgen, 2010; Hönig et al., 2010; Asmus et al., 2014). While these objects preferentially show extensions towards the NLR (=polar region of the AGN), most of the detections have been serendipitous, and it is difficult to draw a more general picture of the presence of extended emission and its relation to either the torus or outflow region. In this work, we analyse the Seyfert galaxies from our MIR atlas of AGN observed with large telescopes from the ground (Asmus et al., 2014). We search for extensions beyond the point spread function attributable to resolved emission of the nuclear source. The orientation is compared to the AGN system axis as defined by polarimetry, linear radio emission, or the NLR direction. A statistical analysis will allow us to conclude if the MIR emission on single-telescope scales is related to the torus or the outflow region.
II. Data Acquisition & Sample selection
The parent sample for this work is the AGN MIR atlas of 253 objects (Asmus et al., 2014). The optical classifications and distances (using the same cosmology) are adopted from that work.
We remove all uncertain AGN, AGN-starburst composites and low-ionisation narrow emission line region (LINER) objects from this sample to avoid non-AGN confusion and concentrate on “classical” Seyfert objects with significant accretion rates/luminosities. Furthermore, Mrk 266SW and NGC 34 are excluded because their nuclear extended MIR emission turned out to be dominated by a nuclear starburst (Esquej et al., 2012; Asmus et al., 2014). This cut leaves 149 MIR-detected objects, which we call the “total Seyfert sample” in the following.
We furthermore use the nuclear MIR flux measurements from Asmus et al. (2014). These are extracted from ground-based multi-filter photometry obtained with the instruments VLT/VISIR (Lagage et al., 2004), Gemini/T-ReCS (Telesco et al., 1998), Gemini/Michelle (Glasse, Atad-Ettedgui & Harris, 1997), and Subaru/COMICS; (Kataza et al., 2000) with an angular resolution of the order of or 120 pc for the median sample distance of 72 Mpc at 12. In particular, we use the flux from Gaussian fitting, , as a measure of the total nuclear flux, while the point spread function flux, , measures the unresolved flux and use measurements in various filters to compute the 12 continuum fluxes as done in Asmus et al. (2014). The ratio of the two, , will serve as a lower limit to the extended emission relative to the nuclear emission at .
Finally, we use the measured position angles (PAs) and extension classifications, “point-like,” “unknown,” “possibly extended,” and “extended,” from the Gaussian fitting of the nuclear emission. In case of multiple measurements, the weighted mean of the individual PAs is used and called “MIR PA” in the following. For details of their computation and definition we refer to Asmus et al. (2014). In summary, sources are classified as point-like if the nuclear emission remained unresolved with a point spread function close to the diffraction limit while it is classified as extended if resolved emission ( per cent compared to point like) with consistent morphology is detected in at least two different epochs. Otherwise the classification is possibly extended. All remaining cases are classified as unknown.
In order to establish system axis PAs for as many sources as possible, we consider several tracers. First, the [O III] morphology shows the ionisation cones directly, unless absorption is too high. Thus, we search the literature for [O III] images and measured PAs (63 objects). These are mostly based on high angular resolution data from the Hubble Space Telescope ( arcsec; 43 objects). Second, a jet can be present even in radio-quiet AGN and its PA on nuclear scales is a good system axis tracer. Therefore, we collect jet PAs from the literature using the highest angular resolution data available from very long base line interferometry, the Multi-Element Radio Linked Interferometer Network, or the Very Large Array. Out of 59 objects with such data, 46 have resolutions better than one arcsec and are thus comparable in scale to our MIR data (resolutions up to five arcsec for the other 7), while the frequencies are either 5 or 8.4 GHz (or higher), except for 8 objects, where only 1.4 GHz data are available. Third, if broad emission lines are detected in polarized light, their PAs are perpendicular to the system axis in case of polar scattering, as occurring in type II objects. Such PAs could be retrieved from the literature for 20 type II AGN. Note that polarisation PAs are available also for four type I AGN, which we do not use for our system axis estimates however, because the PAs might be dominated by equatorial scattering (Smith et al., 2004). Fourth and finally, five objects have resolved maser emission tracing the accretion disk. Thus, their PAs are as well perpendicular to the system axis. The PA values and corresponding references of all the above tracers are given in Table The subarcsecond mid-infrared view of local active galactic nuclei: III. Polar dust emission ††thanks: Based on European Southern Observatory (ESO) observing programmes 60.A-9242, 074.A-9016, 075.B-0182, 075.B-0621, 075.B-0631, 075.B-0727, 075.B-0791, 075.B-0844, 076.B-0194, 076.B-0468, 076.B-0599, 076.B-0621, 076.B-0656, 076.B-0696, 076.B-0743, 077.B-0060, 077.B-0135, 077.B-0137, 077.B-0728, 078.B-0020, 078.B-0173, 078.B-0255, 078.B-0303, 080.B-0240, 080.B-0860, 081.B-0182, 082.B-0299, 083.B-0239, 083.B-0452, 083.B-0536, 083.B-0592, 084.B-0366, 084.B-0606, 084.B-0974, 085.B-0251, 085.B-0639, 086.B-0242, 086.B-0257, 086.B-0349, 086.B-0479, 086.B-0919, 087.B-0746, 382.A-0604, 382.B-0732, 384.B-0143, 384.B-0887, 384.B-0943, 385.B-0051, 385.B-0896, 385.B-0981 and 386.B-0026. for the total Seyfert sample.
III. Results & Discussion
III.1. System axis position angle
None of the different system axis measurement methods is available for all of the objects. Therefore, we combine the different methods to estimate a system axis PA whenever possible. The median of the absolute angular difference between the [O III] and radio PAs is 8 degrees for the 31 sources which have both measurements available. The largest difference between both occurs in NGC 4278 (70 degrees). For 12 of the objects with measured polarisation angles in the broad emission lines and [O III] PAs, the median angular difference is 16 degrees, with the maximum difference of 63 degrees in NGC 424. The median difference between polarisation-based and radio system axis PAs is 20 degrees from 15 objects, with the maximum differences of 63 and 65 degrees for NGC 6300 and NGC 4507 respectively. Four of the objects with maser-based system axis PAs have also [O III] PAs and the average difference between both methods is 12 degrees.
All these angular differences are well below 45 degrees, i.e. the randomness limit. Therefore, it is justified to combine the different methods to derive one common system axis PA. For those objects where multiple methods are available, the average of the PAs is used. For 61 objects, none of the methods is available or delivers unambiguous results. Their system axis PAs remain unknown.
III.2. Alignment of system axis and mid-infrared position angles
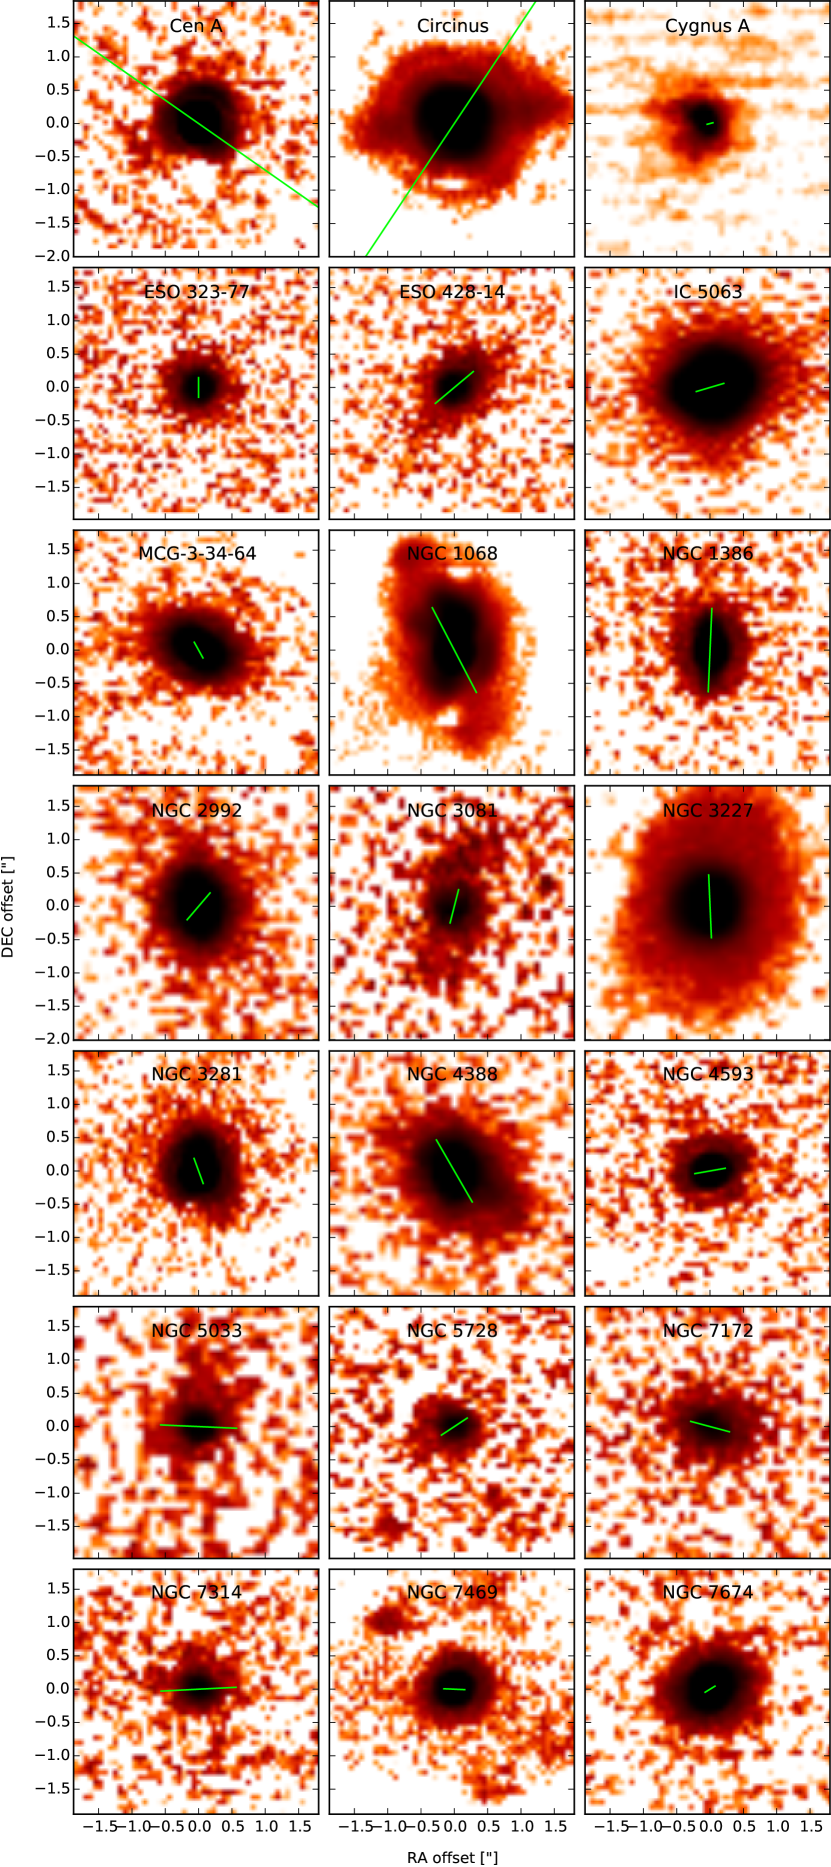
In order to investigate how well the system axis and MIR PAs align, we compare the two for those objects from the total Seyfert sample that have been classified as extended in Asmus et al. (2014). This is the case for 22 objects. However, for NGC 5506, the MIR PAs measured independently from several images are inconsistent, i.e. have a standard deviation greater than 45 degrees. This leaves 21 objects which are referred to as the “MIR-extended Seyferts” in the following. Fig. 1 shows the nuclear MIR emission of these sources in comparison to the system axis PAs established in the previous section.
The distribution of the angular difference between system axis and MIR is shown in Fig. 2.
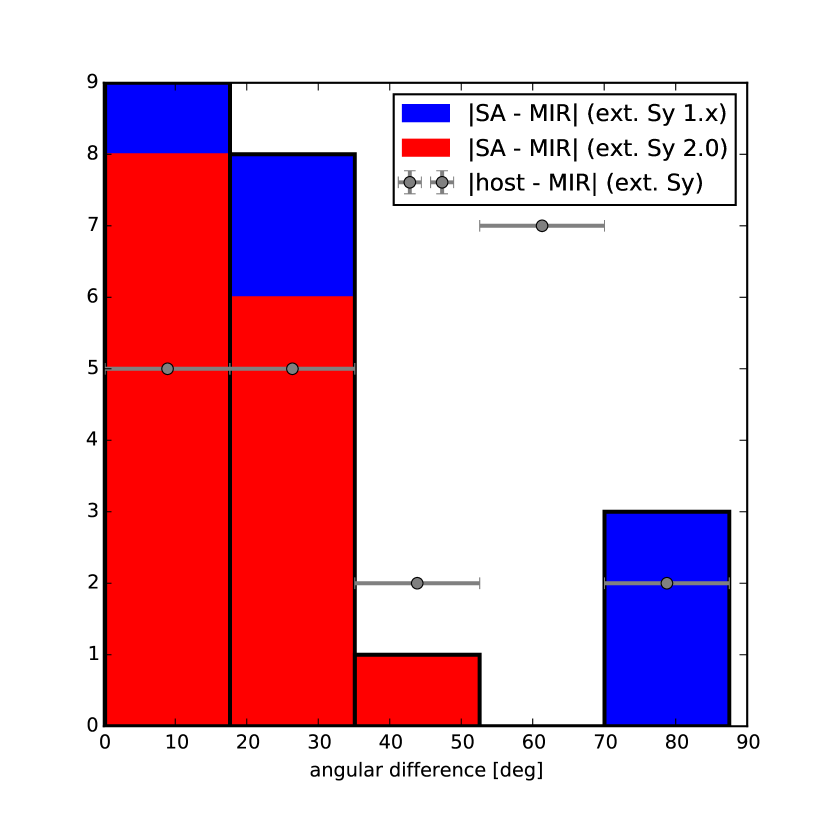
The median angular difference is 19 degrees with a standard deviation of 27 degrees. There are four objects with a difference larger than 45 degrees (Circinus, ESO 323-77, NGC 2992 and NGC 5033), which will be discussed in Sect. III.4. Despite these, the distribution is clearly not random (corresponding to a flat line in Fig. 2) but shows that the position angles of the nuclear MIR emission and system axis are in general connected (as already found in Asmus et al. 2014). We verify this result with a two-sided one-dimensional Kolmogorov-Smirnov test comparing the actual distribution to random uniform samples, which results in an approximate normal distribution of logarithmic null-hypothesis probabilities, , with a median of -2.0 (standard deviation 0.9).
III.3. Alignment of nuclear MIR emission and host structure
The orientation and inclination of the host galaxy has been shown as independent from the system axis of the AGN (e.g., Kinney et al. 2000; Schmitt et al. 2003b). We use this fact to control the significance of the above result and compare the alignment of the nuclear MIR emission with the host structures. For this purpose we collect the major axis position angles of the host galaxies, mainly from the Hyperleda111http://leda.univ-lyon1.fr/ data base (Makarov et al., 2014). For low-inclination systems, instead of the total major axis, the PA of the inner bar or spiral structure was used. The corresponding value will be called “host PA” and is listed in Table The subarcsecond mid-infrared view of local active galactic nuclei: III. Polar dust emission ††thanks: Based on European Southern Observatory (ESO) observing programmes 60.A-9242, 074.A-9016, 075.B-0182, 075.B-0621, 075.B-0631, 075.B-0727, 075.B-0791, 075.B-0844, 076.B-0194, 076.B-0468, 076.B-0599, 076.B-0621, 076.B-0656, 076.B-0696, 076.B-0743, 077.B-0060, 077.B-0135, 077.B-0137, 077.B-0728, 078.B-0020, 078.B-0173, 078.B-0255, 078.B-0303, 080.B-0240, 080.B-0860, 081.B-0182, 082.B-0299, 083.B-0239, 083.B-0452, 083.B-0536, 083.B-0592, 084.B-0366, 084.B-0606, 084.B-0974, 085.B-0251, 085.B-0639, 086.B-0242, 086.B-0257, 086.B-0349, 086.B-0479, 086.B-0919, 087.B-0746, 382.A-0604, 382.B-0732, 384.B-0143, 384.B-0887, 384.B-0943, 385.B-0051, 385.B-0896, 385.B-0981 and 386.B-0026. for the total sample.
The distribution of the angular difference between the MIR PA and the host PA is also shown in Fig. 2 for the MIR-extended Seyferts. Its median is 35 degrees with a standard deviation of 26 degrees. The shape and the median of the distribution are much closer to random than the difference between system axis and MIR PA. This is as well verified by a Kolmogorov-Smirnov test over random uniform samples with a median of just -0.27 (standard deviation 0.34). From this, we conclude that the extended nuclear MIR emission is indeed coming from the polar region of the AGN system rather than from the circum nuclear dust structures of the host.
III.4. The outliers
There are four objects with angular differences larger 45 degrees between the system axis and MIR PAs, which we discuss first individually here.
III.4.1 Circinus
Circinus has a mismatch of 46 degrees between system axis and MIR PAs. The system axis PA estimate is based on [O III] images (Wilson et al., 2000), polarisation measurements (Oliva et al., 1998) and resolved maser emission (Greenhill et al., 2003). The [O III] images show a one-sided ionisation cone almost perpendicular to the maser disk while the polarisation axis is off by 23 degrees compared to the [O III] and maser PAs. The MIR images show bar-like emission on both sides of the nucleus (Asmus et al., 2014), which aligns with the southern edge of the ionisation cone with an opening angle of roughly 90 degrees (see also Packham et al. 2005). Therefore, the MIR emission is actually aligned with the system axis and indicates that the dust cone is hollow. It remains unknown why we do not see any emission from the northern edge of the cone. In any case, the case of Circinus demonstrates that the mismatch between MIR and system axis PA can be up to 45 degrees and still be consistent with significant dust emission from the ionisation cone. Circinus is also one of the best studied object with MIR interferometry (Tristram et al., 2014), which shows that the MIR emission on sub-parsec scales is dominated by three components. The most extended one, which contributes per cent to the total emission, has a low surface brightness and also extends along the polar axis with a similar PA as the MIR emission on larger scales. Therefore, we conclude that Circinus is consistent with the idea that the MIR emission originates primarily from the polar region.
III.4.2 ESO 323-77
The nuclear MIR emission of ESO 323-77 is extended almost perpendicular to the system axis (85 degrees). The latter is based on the [O III] morphology, which is dominated by an unresolved nucleus (typical for type I objects) with a narrow, cone-like, possibly bended structure extending to the South for at least 5 kpc (Mulchaey, Wilson & Tsvetanov, 1996). Also MIR interferometric measurements indicate a North-South elongation on milliarcsec scales (Kishimoto et al., in prep.). However, the subarcsecond MIR data from Asmus et al. (2014) from two epochs shows an apparent elongation close to the East-West axis although with varying position angles (standard deviation 27 degrees). The marginal extent in the single dish images and the contradiction to the MIR interferometric data indicate that the measured MIR PA might be an observational artefact.
III.4.3 NGC 2992
For NGC 2992, a mismatch of 84 degrees between MIR and system axis PAs is found. The host is a highly inclined spiral galaxy with a prominent dust lane crossing the nucleus along the host major axis with a PA of 17 degrees (Ward et al., 1980). The large biconical NLR is oriented roughly perpendicular to this (PA 125 degrees; Allen et al. 1999). The cones are very prominent and have wide opening angles. In the radio, the outflow is slightly more inclined to the South (PA 154 degrees; Wehrle & Morris 1988). In the highest signal-to-noise MIR image (N’ with Gemini/Michelle), bar like extended emission along a PA degrees is visible and consistent with morphology on the larger scale seen on the Spitzer images (Asmus et al., 2014). The extended emission in the nuclear MIR images is extremely faint such that and coincides with the dust lane. Therefore, the dust lane dominates the extended MIR emission also on subarcsecond scales. We speculate that the fact that no extended MIR emission from the ionization cones was detected is connected to the wide opening angle of the [O III] cones, which indicates that the system axis almost aligns with our line of sight towards the AGN.
III.4.4 NGC 5033
NGC 5033 shows the largest mismatch between MIR and system axis PAs (88 degrees). This type I AGN features a one sided ionisation cone with a wide opening angle (Mediavilla et al., 2005). The jet like structure visible in the radio is aligned with the cone (Ho & Ulvestad, 2001). NGC 5033 features the weakest AGN in the MIR-extended Seyfert sample (intrinsic X-ray luminosity: ; Asmus et al. 2015), which is one order of magnitude less powerful than Cen A, the second weakest. Intense star formation dominates the MIR emission of the central few hundred parsec region as seen in the Spitzer data (Asmus et al., 2014). The extended emission in the subarcsecond MIR images follows the host emission visible already in the Spitzer/IRAC images instead of the system axis PA. However, Asmus et al. (2014) already noted that in addition to this weak, very extended emission, the nucleus is possibly extended in East-West direction in the sharpest image (PA degrees), which would coincide with the system axis. The signal-to-noise of the MIR images are in the lower quartile of the MIR-extended Seyfert sample and might be too low to properly detect dust emission from the polar region of this intrinsically weak AGN, in particular since the system axis is again close to our line of sight.
III.5. Reasons for a mismatch of system axis and MIR PA
The discussion of the individual objects above shows that an apparent mismatch of the MIR and system axis PA can have various reasons. On the one hand, most of the extended MIR emission can originate from the edges of the ionisation cones (as in Circinus and NGC 1068), which is expected if the emitting material is mostly located in the walls of a hollow cone. On the other hand, the nuclear MIR emission can be dominated by prominent host features around/in front of the nucleus like dust lanes (NGC 2992) and intense star forming regions, in particular if the AGN is intrinsically weak (; NGC 5033). Finally, if the inclination of the system axis is low ( degrees) as expected for type I sources (ESO 323-77 and NGC 5033) and/or the ionisation cones have wide opening angles ( degrees; NGC 2992, NGC 5033), then detection of the polar dust might be difficult.
If the above explanations are indeed correct, could at least some of the other objects in the MIR-extended Seyfert sample be affected as well?
NGC 7172 is the only other object in this sample with a prominent dust lane crossing the nucleus. In fact, the PAs of the dust lane, apparent system axis, and MIR are almost perfectly aligned in this object. However, broad emission lines are seen in the near infrared (Smajić et al., 2012), which implies that NGC 7172 is in fact a type I AGN but appears as type II only because of the dust lane. If this is true, then it is most likely that the observed MIR extension is also caused by the dust lane. Intense star formation in/around the nucleus is also (possibly) present in NGC 34 and NGC 5728. However, both have at least one order of magnitude more powerful AGN (Asmus et al., 2015), which outshine the star formation. The other type I AGN among the MIR-extended Seyferts are NGC 3227, NGC 4593 and NGC 7469. Indeed, the nuclear MIR emission of NGC 3227 shows very little elongation with significant scatter of the PA between individual images (Asmus et al., 2014). The deepest image (in the N prime filter) shows a faint halo slightly elongated in North-South direction, which matches the expectation from an almost face-on ionisation cone. The same is true for NGC 4593 and NGC 7469. Finally, none of the other objects show wide opening angles in their [O III] images.
Therefore, we conclude that the above explanations, dust lane, low-inclination or wide opening angle ionisation cone and intrinsic AGN weakness, are valid possible, but not necessarily, reasons for an observed mismatch between the system axis and MIR PAs. The latter of these complications predominantly occur in type I objects. Indeed, if we look only at the 16 MIR-extended Seyfert 2 sources (red histogram in Fig. 2), the median angular difference between system axis and MIR PA decreases to 11 degrees (standard deviation 13 degrees).
III.6. Amount of extended emission and connection to [O IV] emission
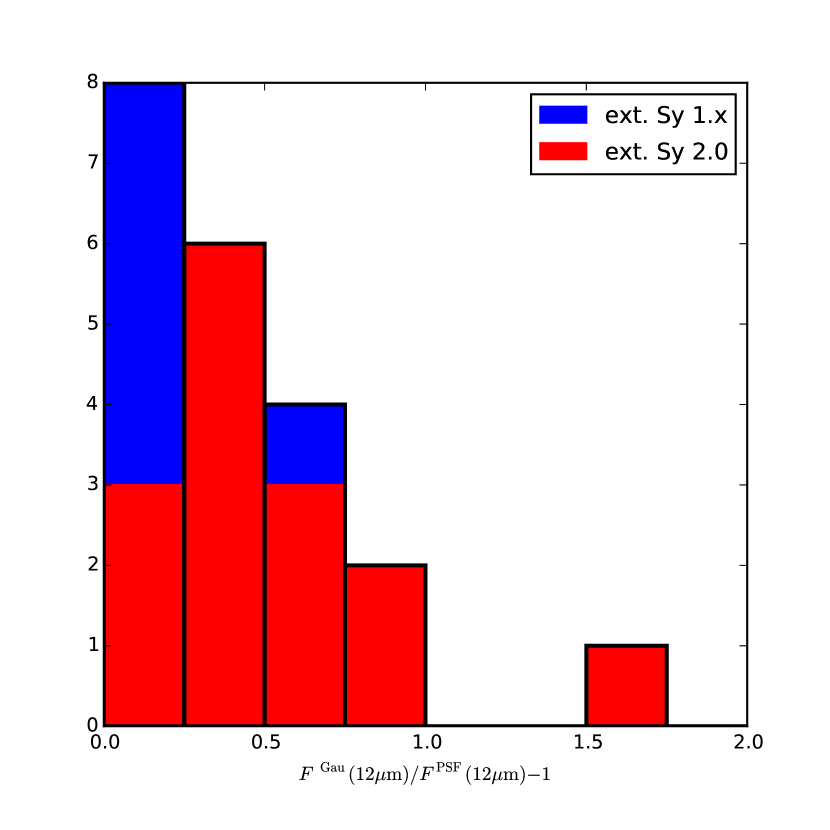
The extent of the resolved MIR emission is difficult to determine accurately because of its low surface brightness in most of the MIR images and the unknown inclination of the system axis. Furthermore, an image deconvolution with the point spread function would be necessary and is beyond the scope of this work. However, a qualitative comparison with the green lines in Fig. 1, which were scaled to be 100 pc long at the corresponding object distances, shows that the extent of the MIR emission varies between a few tens up to a few hundreds of parsecs. In addition to the possibility of missing low surface brightness emission, the intrinsic resolution of the nuclear MIR images is at least ten times larger than the expected size of the torus. For these reasons, we can only derive a lower limit for the actual amount of polar MIR emission. Such a lower limit is given by as described in Sect. II. Its distribution for the MIR-extended Seyferts is shown in Fig. 3. The median is 0.4 with the Seyfert 2s showing higher relative amounts of extended emission than the Seyfert 1.x objects (median 0.41 versus 0.14).
In the following, we compare to the strength of the line emission from the NLR. The [O III] line is traditionally used as a probe for the latter. More recently, the MIR [O IV] emission line has been proposed as an alternative, since it is much less affected by extinction. In addition, the line is much less affected by contamination from stellar emission due to the higher ionization potential (Genzel et al., 1998). Therefore, we use the [O IV] as measure of the NLR strength and collect it from the literature coming exclusively from Spitzer/IRS observations (listed in Table The subarcsecond mid-infrared view of local active galactic nuclei: III. Polar dust emission ††thanks: Based on European Southern Observatory (ESO) observing programmes 60.A-9242, 074.A-9016, 075.B-0182, 075.B-0621, 075.B-0631, 075.B-0727, 075.B-0791, 075.B-0844, 076.B-0194, 076.B-0468, 076.B-0599, 076.B-0621, 076.B-0656, 076.B-0696, 076.B-0743, 077.B-0060, 077.B-0135, 077.B-0137, 077.B-0728, 078.B-0020, 078.B-0173, 078.B-0255, 078.B-0303, 080.B-0240, 080.B-0860, 081.B-0182, 082.B-0299, 083.B-0239, 083.B-0452, 083.B-0536, 083.B-0592, 084.B-0366, 084.B-0606, 084.B-0974, 085.B-0251, 085.B-0639, 086.B-0242, 086.B-0257, 086.B-0349, 086.B-0479, 086.B-0919, 087.B-0746, 382.A-0604, 382.B-0732, 384.B-0143, 384.B-0887, 384.B-0943, 385.B-0051, 385.B-0896, 385.B-0981 and 386.B-0026. ).
The median [O IV] luminosity for the whole Seyfert sample is erg s-1, while the corresponding one of the extended sources is slightly higher ( erg s-1 cm-2). Furthermore, the median flux is seven times higher ( versus erg s-1 cm-2). This separation in [O IV] flux becomes even clearer if one compares the extended objects to the 34 point-like Seyferts from the total sample only, as shown in Fig. 4.
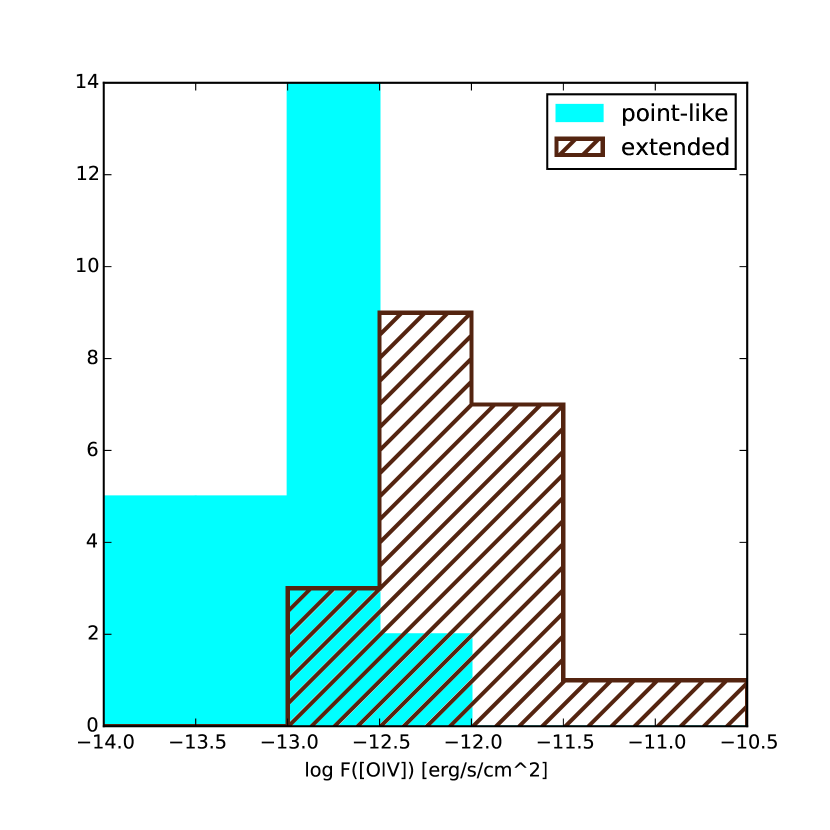
The flux distributions of both groups barely overlap (ratio of medians is 7.9, Kolmogorov-Smirnov test distance is 0.82 with ). The separation in [O IV] flux is by far the strongest among several other parameters like nuclear MIR flux (ratio of medians: 1.4; fluxes from Asmus et al. 2014), intrinsic 2-10 keV flux (ratio of medians: 1.7; fluxes from Asmus et al. 2015) and distance (ratio of medians: 3.0). In particular, there is no significant separation between extended and point-like sources when using [O III] fluxes instead of [O IV] (ratio of medians: 1.5, ; ; mainly taken from Ho et al. 1997; Gu et al. 2006; Diamond-Stanic, Rieke & Rigby 2009), which demonstrates why we prefer [O IV] over [O III] emission. This might be related to recent results questioning the [O III] emission as accurate bolometric indicator (Berney et al., 2015; Ueda et al., 2015).
If we compare the amount of extended emission, , to the [O IV] flux, in Fig. 5, indeed, they correlate well.
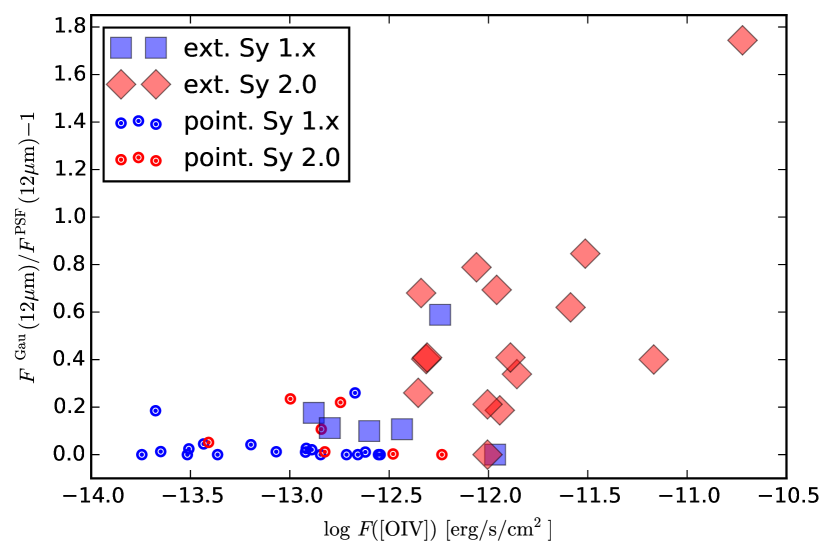
In logarithmic space, the Spearman rank is 0.54 with a null-hypothesis probability of 0.012. For comparison, we again show the point-like Seyferts from the total sample, which all have low values as expected. Interestingly, the few objects in the overlapping region are mostly Seyfert 2s in the point-like sample and Seyfert 1.x in the extended sample. Extended emission appears to be easier detectable in Seyfert 2s, as we expect from the side-ways view onto the ionization cones (see also next section).
These results imply that the extended MIR continuum emission is strongly connected to the [O IV] emission, e.g., coming from the same region. Furthermore, the object distance also plays an important role in the detection rate of extended MIR emission. This will be further discussed in the next section.
The presence of dust in the narrow emission line clouds was already inferred by Netzer & Laor (1993) and recently was further investigated by Stern, Laor & Baskin (2014). This work examines the structure of ionised gas clouds, e.g. as seen in the NLR, and find that they are capable of hosting dust (high density, intrinsic shielding), when considering that the cloud structure is set by the radiation pressure (“radiation pressure confinement”). As such, line and dust emission originate from the same clouds. Indeed, the authors predict a relation between cloud density and luminosity of the ionising part of the AGN emission. Our finding lends support to this idea by linking the dust emission strength and its place of origin to the strength of a highly ionised emission line.
III.7. Reasons for low detection rate of polar emission
The results of the previous section indicate that the object distance is an important parameter for the detection of extended MIR emission. In fact, the MIR-extended Seyferts are less distant from us than most Seyferts in the total sample (median distance 40 Mpc compared to 94 Mpc of the total sample), allowing to reach intrinsic resolutions of less than 100 pc. Still, in most of the MIR-extended Seyferts, the polar emission is resolved with full-width-half-maxima less than two times the point spread function, which makes it difficult to separate the MIR emission into different components.
Another reason for the low detection rate is the relatively low signal-to-noise of most of the MIR images in Asmus et al. (2014). The median peak signal-to-noise of the detected nuclei is 25, while it is 93 for the MIR-extended Seyferts. And, the extended emission has a low surface brightness in most of the cases (exceptions are NGC 1068 and NGC 1386).
The median ratio of unresolved to total emission for the extended Seyfert 2s is 0.7 (standard deviation 0.2), which provides a typical lower limit of 30 per cent for the polar emission on scales resolvable with single 8 meter class telescopes. Furthermore, the example of NGC 5033 indicates that the AGN also has to be sufficiently powerful to create sufficient polar dust emission (). Finally, we showed that for type I sources, the polar dust is difficult to detect because of the low inclination and projected wide opening angle of the ionisation cones.
From the above reasoning one can form a set of selection criteria to find the best candidates among the 128 Seyferts without any detections of polar MIR emission so far to look for the latter. We base the criteria on the MIR-extended sample and start with a peak signal-to-noise of the nuclear MIR source greater than 36 (first quartile), which leaves 45 objects. The effects of distance, AGN power and NLR strength can be combined into one criterion based on the [O IV] flux, which should be greater than erg s-1 cm-2 (first quartile). These two criteria leave eight sources that should have detectable extended MIR emission. Although four among them are not Seyfert 2s, two of these, IC 4329A and NGC 4151, show extensions in the archival nuclear MIR images consistent with the system axis orientation (see also Radomski et al. 2003), while the other two type I AGN, 3C 120 and NGC 1365, exhibit as well extended emission although with inconsistent MIR PAs between different epochs. Such inconsistencies can arise from instabilities in the integrated point spread function in case of technical imperfections or poor seeing conditions. The Seyfert 2s among the eight candidates are IC 4518W, Mrk 573, NGC 5135 and NGC 5506. IC 4518W is classified as possibly extended but with no system axis PA information available, while Mrk 573 is also possibly extended with a MIR PA consistent with the system axis PA, but lacks a suitable standard star observation for a robust morphological classification. NGC 5506 was excluded earlier from the extended Seyfert sample because of inconsistent MIR PA measurements, leaving NGC 5135 as the only source which shows no extension among these best candidates.
In summary, a careful revaluation of the MIR data indicates that polar MIR emission might indeed be present in at least seven to eight further objects, beside the 18 objects, where we found such features outright. Additional deep high-quality MIR imaging with subarcsecond resolution might reveal the polar emission in these promising candidates.
IV. Conclusions & Implications
Of the 149 MIR detected Seyferts from the AGN MIR atlas, 18 have clear detections of extended nuclear MIR emission, which comes from the polar region of the AGN on scales of tens to hundreds of parsecs, i.e., much larger scales than expected torus sizes. Owing to the fact that only three of these sources are radio-loud (Cen A, Cygnus A and IC 5063), synchrotron emission from the jet can in general not be the main contributor for this emission. In addition, the strong connection to the [O IV] emission implies that the extended MIR emission originates in the NLR. The best candidate for the emitter is thus dust in the walls of the ionization cone and/or NLR clouds.
The extended emission that we could detect with single-dish observations represents only a lower limit of the total polar emission. In fact, all objects with detailed MIR interferometric observations have shown that the large majority of MIR emission is coming from an extended polar component, which presumably is the same we see on much larger scales in this work. This argues for a modification of the current paradigm in which the bulk of the mid-infrared emission is emitted by the canonical parsec-scale torus. The latter conclusively might be much more compact or even just a thick part of the accretion disk. In both cases, its dust would then be responsible for the hot component in the infrared SED.
The alignment of the polar MIR emission with the edges of the ionization cones (as in Circinus) indicates that the polar MIR emitter is located rather in the walls of the cone, which thus would remain rather hollow. This scenario will presumably have consequences on, e.g., the absorption geometry, kinematics and resulting SED, whose study we leave for future work. However, unless the walls are optically thick, which is unlikely as we see the [O III] from the inside, we expect the MIR emission to be even more isotropic than in the case of the canonical clumpy torus model, which can naturally account for the lack of differences between type I and II AGN in the MIR–X-ray correlation (Krabbe, Böker & Maiolino, 2001; Gandhi et al., 2009; Asmus et al., 2015).
The relatively low detection rate of polar emission in AGN so far can be explained by the combination of the lack of sufficient high quality data and the requirement for the orientation, NLR strength and distance of the AGN.
Looking forward to the future, the upgraded VISIR instrument (Käufl et al., 2015) allows us to refine the extension analysis for the brighter of the currently ambiguous cases in particular with the burst mode, optimizing image quality and sensitivity In the near future, MATISSE (Lopez et al., 2014) will provide improved interferometric capabilities to characterise the milliarcsecond scale MIR emission of the two dozen brightest AGN. Larger samples will only be accessible with the James-Webb Space Telescope (JWST; Gardner et al. 2006), which is expected to provide a 103 times higher sensitivity at 12 than current ground-based MIR instruments, while offering a comparable angular resolution. Thus, deep JWST imaging will allow for the detection and resolution of the polar emission in most nearby Seyferts, in particular in type II objects with at least moderate [O IV] luminosities. The size of the polar dust emission is expected to scale with the bolometric luminosity of the AGN such that even more distant systems can be resolved, provided they are powerful enough. The most distant AGN in our resolved Seyfert sample is Cygnus A at 257 Mpc with a bolometric luminosity of erg s-1. The distance versus luminosity threshold for the detection of polar emission can be expressed by the intrinsic resolution in units of the sublimation radius, pc (Kishimoto et al., 2007). Here, the extended Seyferts exhibit elongations up to (maximum is NGC 5033). Thus, JWST should be able to resolve polar emission in AGN up to similar values. Of course, the detection will depend on the actual NLR size and emission power in the individual cases, which shows some scatter with respect to the bolometric luminosity. The [O IV] flux may be the main selection criterion here.
Finally, the deep MIR images from JWST will also show the transition zone of the AGN to the host structure and thus help to separate foreground from AGN-intrinsic obscuration.
In the more distant future, the Planet Finding Imager (Kraus et al., 2014) will provide 0.1 mas resolution images at , almost 3000 better than current single telescope observations, and thus allow detailed investigations of inner parts of nearby, bright AGN.
References
- Allen et al. (1999) Allen M. G., Dopita M. A., Tsvetanov Z. I., Sutherland R. S., 1999, ApJ, 511, 686
- Antonucci (1993) Antonucci R., 1993, ARA&A, 31, 473
- Antonucci (1985) Antonucci R. R. J., 1985, ApJSS, 59, 499
- Asmus et al. (2015) Asmus D., Gandhi P., Hönig S. F., Smette A., Duschl W. J., 2015, MNRAS, 454, 766
- Asmus et al. (2014) Asmus D., Hönig S. F., Gandhi P., Smette A., Duschl W. J., 2014, MNRAS, 439, 1648
- Bailey et al. (1988) Bailey J., Axon D. J., Hough J. H., Ward M. J., McLean I., Heathcote S. R., 1988, MNRAS, 234, 899
- Baum et al. (1988) Baum S. A., Heckman T. M., Bridle A., van Breugel W. J. M., Miley G. K., 1988, ApJSS, 68, 643
- Beckert et al. (2008) Beckert T., Driebe T., Hönig S. F., Weigelt G., 2008, A&A, 486, L17
- Bennert et al. (2002) Bennert N., Falcke H., Schulz H., Wilson A. S., Wills B. J., 2002, The ApJL, 574, L105
- Bennert et al. (2006) Bennert N., Jungwiert B., Komossa S., Haas M., Chini R., 2006, A&A, 446, 919
- Berney et al. (2015) Berney S. et al., 2015, MNRAS, 454, 3622
- Black et al. (1992) Black A. R. S., Baum S. A., Leahy J. P., Perley R. A., Riley J. M., Scheuer P. A. G., 1992, MNRAS, 256, 186
- Bock et al. (2000) Bock J. J. et al., 2000, AJ, 120, 2904
- Boyce et al. (1996) Boyce P. J., Disney M. J., Macchetto F., Boksenberg A., Blades J. C., Mackay C. D., 1996, A&A, 305, 715
- Braatz et al. (1993) Braatz J. A., Wilson A. S., Gezari D. Y., Varosi F., Beichman C. A., 1993, The ApJL, 409, L5
- Burtscher et al. (2013) Burtscher L. et al., 2013, A&A, 558, 149
- Cameron et al. (1993) Cameron M., Storey J. W. V., Rotaciuc V., Genzel R., Verstraete L., Drapatz S., Siebenmorgen R., Lee T. J., 1993, ApJ, 419, 136
- Canalizo et al. (2003) Canalizo G., Max C., Whysong D., Antonucci R., Dahm S. E., 2003, ApJ, 597, 823
- Capetti et al. (1995) Capetti A., Macchetto F., Axon D. J., Sparks W. B., Boksenberg A., 1995, ApJ, 448, 600
- Claussen, Heiligman & Lo (1984) Claussen M. J., Heiligman G. M., Lo K. Y., 1984, Nature, 310, 298
- Cohen et al. (1999) Cohen M. H., Ogle P. M., Tran H. D., Goodrich R. W., Miller J. S., 1999, AJ, 118, 1963
- Colbert et al. (1996) Colbert E. J. M., Baum S. A., Gallimore J. F., O’Dea C. P., Lehnert M. D., Tsvetanov Z. I., Mulchaey J. S., Caganoff S., 1996, ApJSS, 105, 75
- Cooke et al. (2000) Cooke A. J., Baldwin J. A., Ferland G. J., Netzer H., Wilson A. S., 2000, ApJSS, 129, 517
- Cracco et al. (2011) Cracco V. et al., 2011, MNRAS, 418, 2630
- Dasyra et al. (2008) Dasyra K. M. et al., 2008, ApJ, 674, L9
- Dasyra et al. (2011) Dasyra K. M., Ho L. C., Netzer H., Combes F., Trakhtenbrot B., Sturm E., Armus L., Elbaz D., 2011, ApJ, 740, 94
- Diamond-Stanic, Rieke & Rigby (2009) Diamond-Stanic A. M., Rieke G. H., Rigby J. R., 2009, ApJ, 698, 623
- Dicken et al. (2014) Dicken D. et al., 2014, ApJ, 788, 98
- Durret & Bergeron (1987) Durret F., Bergeron J., 1987, A&A, 173, 219
- Durret & Bergeron (1988) Durret F., Bergeron J., 1988, A&A Supplement Series, 75, 273
- Edelson & Malkan (1986) Edelson R. A., Malkan M. A., 1986, ApJ, 308, 59
- Erwin (2004) Erwin P., 2004, A&A, 415, 941
- Esquej et al. (2012) Esquej P. et al., 2012, MNRAS, 423, 185
- Evans et al. (1991) Evans I. N., Ford H. C., Kinney A. L., Antonucci R. R. J., Armus L., Caganoff S., 1991, The ApJL, 369, L27
- Evans et al. (1993) Evans I. N., Tsvetanov Z., Kriss G. A., Ford H. C., Caganoff S., Koratkar A. P., 1993, ApJ, 417, 82
- Falcke, Wilson & Simpson (1998) Falcke H., Wilson A. S., Simpson C., 1998, ApJ, 502, 199
- Falcke et al. (1996) Falcke H., Wilson A. S., Simpson C., Bower G. A., 1996, The ApJL, 470, L31
- Farrah et al. (2007) Farrah D. et al., 2007, ApJ, 667, 149
- Ferruit, Wilson & Mulchaey (2000) Ferruit P., Wilson A. S., Mulchaey J., 2000, ApJSS, 128, 139
- Filippenko & Ho (2003) Filippenko A. V., Ho L. C., 2003, The ApJL, 588, L13
- Ford et al. (1985) Ford H. C., Crane P. C., Jacoby G. H., Lawrie D. G., van der Hulst J. M., 1985, ApJ, 293, 132
- Fraquelli, Storchi-Bergmann & Binette (2000) Fraquelli H. A., Storchi-Bergmann T., Binette L., 2000, ApJ, 532, 867
- Gallimore et al. (1996a) Gallimore J. F., Baum S. A., O’Dea C. P., Brinks E., Pedlar A., 1996a, ApJ, 462, 740
- Gallimore et al. (1996b) Gallimore J. F., Baum S. A., O’Dea C. P., Pedlar A., 1996b, ApJ, 458, 136
- Gandhi et al. (2009) Gandhi P., Horst H., Smette A., Hönig S., Comastri A., Gilli R., Vignali C., Duschl W., 2009, A&A, 502, 457
- Gardner et al. (2006) Gardner J. P. et al., 2006, Space Science Reviews, 123, 485
- Genzel et al. (1998) Genzel R. et al., 1998, ApJ, 498, 579
- Giovannini et al. (2005) Giovannini G., Taylor G. B., Feretti L., Cotton W. D., Lara L., Venturi T., 2005, ApJ, 618, 635
- Glasse, Atad-Ettedgui & Harris (1997) Glasse A. C., Atad-Ettedgui E. I., Harris J. W., 1997, in SPIE, Vol. 2871, Optical Telescopes of Today and Tomorrow, pp. 1197–1203
- González Delgado et al. (1998) González Delgado R. M., Heckman T., Leitherer C., Meurer G., Krolik J., Wilson A. S., Kinney A., Koratkar A., 1998, ApJ, 505, 174
- Greenhill et al. (2003) Greenhill L. J. et al., 2003, ApJ, 590, 162
- Greenhill et al. (1996) Greenhill L. J., Gwinn C. R., Antonucci R., Barvainis R., 1996, The ApJL, 472, L21
- Greenhill et al. (1995) Greenhill L. J., Jiang D. R., Moran J. M., Reid M. J., Lo K. Y., Claussen M. J., 1995, ApJ, 440, 619
- Groves, Dopita & Sutherland (2006) Groves B., Dopita M., Sutherland R., 2006, A&A, 458, 405
- Gu et al. (2006) Gu Q., Melnick J., Cid Fernandes R., Kunth D., Terlevich E., Terlevich R., 2006, MNRAS, 366, 480
- Hagiwara (2007) Hagiwara Y., 2007, AJ, 133, 1176
- Hagiwara et al. (2001) Hagiwara Y., Henkel C., Menten K. M., Nakai N., 2001, The ApJL, 560, L37
- Ho et al. (1997) Ho L. C., Filippenko A. V., Sargent W. L. W., Peng C. Y., 1997, ApJSS, 112, 391
- Ho & Ulvestad (2001) Ho L. C., Ulvestad J. S., 2001, ApJSS, 133, 77
- Hönig & Kishimoto (2010) Hönig S. F., Kishimoto M., 2010, A&A, 523, 27
- Hönig et al. (2012) Hönig S. F., Kishimoto M., Antonucci R., Marconi A., Prieto M. A., Tristram K., Weigelt G., 2012, ApJ, 755, 149
- Hönig et al. (2010) Hönig S. F., Kishimoto M., Gandhi P., Smette A., Asmus D., Duschl W., Polletta M., Weigelt G., 2010, A&A, 515, 23
- Hönig et al. (2013) Hönig S. F. et al., 2013, ApJ, 771, 87
- Jackson, Tadhunter & Sparks (1998) Jackson N., Tadhunter C., Sparks W. B., 1998, MNRAS, 301, 131
- Jaffe et al. (2004) Jaffe W. et al., 2004, Nature, 429, 47
- Jones et al. (1986) Jones D. L. et al., 1986, ApJ, 305, 684
- Jorsater, Lindblad & Boksenberg (1984) Jorsater S., Lindblad P. O., Boksenberg A., 1984, A&A, 140, 288
- Kataza et al. (2000) Kataza H., Okamoto Y., Takubo S., Onaka T., Sako S., Nakamura K., Miyata T., Yamashita T., 2000, in SPIE, Vol. 4008, Optical and IR Telescope Instrumentation and Detectors, pp. 1144–1152
- Käufl et al. (2015) Käufl H. U. et al., 2015, The Messenger, 159, 15
- Kay (1994) Kay L. E., 1994, ApJ, 430, 196
- Kay & Moran (1998) Kay L. E., Moran E. C., 1998, PASP, 110, 1003
- Kinney et al. (2000) Kinney A. L., Schmitt H. R., Clarke C. J., Pringle J. E., Ulvestad J. S., Antonucci R. R. J., 2000, ApJ, 537, 152
- Kishimoto et al. (2009) Kishimoto M., Hönig S. F., Antonucci R., Kotani T., Barvainis R., Tristram K. R. W., Weigelt G., 2009, A&A, 507, L57
- Kishimoto et al. (2011) Kishimoto M., Hönig S. F., Antonucci R., Millour F., Tristram K. R. W., Weigelt G., 2011, A&A, 536, 78
- Kishimoto et al. (2007) Kishimoto M., Hönig S. F., Beckert T., Weigelt G., 2007, A&A, 476, 713
- Kondratko, Greenhill & Moran (2008) Kondratko P. T., Greenhill L. J., Moran J. M., 2008, ApJ, 678, 87
- Kondratko et al. (2006) Kondratko P. T. et al., 2006, ApJ, 638, 100
- Krabbe, Böker & Maiolino (2001) Krabbe A., Böker T., Maiolino R., 2001, ApJ, 557, 626
- Kraus et al. (2014) Kraus S. et al., 2014, in , eprint: arXiv:1407.7033, p. 914611
- Kristen et al. (1997) Kristen H., Jorsater S., Lindblad P. O., Boksenberg A., 1997, A&A, 328, 483
- Kukula et al. (1993) Kukula M. J., Ghosh T., Pedlar A., Schilizzi R. T., Miley G. K., de Bruyn A. G., Saikia D. J., 1993, MNRAS, 264, 893
- Lagage et al. (2004) Lagage P. O. et al., 2004, The Messenger, 117, 12
- Leahy et al. (1997) Leahy J. P., Black A. R. S., Dennett-Thorpe J., Hardcastle M. J., Komissarov S., Perley R. A., Riley J. M., Scheuer P. A. G., 1997, MNRAS, 291, 20
- Leahy & Perley (1991) Leahy J. P., Perley R. A., 1991, AJ, 102, 537
- Leahy & Perley (1995) Leahy J. P., Perley R. A., 1995, MNRAS, 277, 1097
- Leipski et al. (2006) Leipski C., Falcke H., Bennert N., Hüttemeister S., 2006, A&A, 455, 161
- Lipari, Tsvetanov & Macchetto (1993) Lipari S., Tsvetanov Z., Macchetto F., 1993, ApJ, 405, 186
- Lonsdale et al. (2003) Lonsdale C. J., Lonsdale C. J., Smith H. E., Diamond P. J., 2003, ApJ, 592, 804
- Lopez et al. (2014) Lopez B. et al., 2014, The Messenger, 157, 5
- Lumsden, Alexander & Hough (2004) Lumsden S. L., Alexander D. M., Hough J. H., 2004, MNRAS, 348, 1451
- Makarov et al. (2014) Makarov D., Prugniel P., Terekhova N., Courtois H., Vauglin I., 2014, A&A, 570, A13
- Marconi et al. (1994) Marconi A., Moorwood A. F. M., Origlia L., Oliva E., 1994, The Messenger, 78, 20
- Matthews et al. (1999) Matthews L. D. et al., 1999, AJ, 118, 208
- Mayer (1979) Mayer C. J., 1979, MNRAS, 186, 99
- Mediavilla et al. (2005) Mediavilla E., Guijarro A., Castillo-Morales A., Jiménez-Vicente J., Florido E., Arribas S., García-Lorenzo B., Battaner E., 2005, A&A, 433, 79
- Meléndez et al. (2008) Meléndez M. et al., 2008, ApJ, 682, 94
- Miller & Goodrich (1990) Miller J. S., Goodrich R. W., 1990, ApJ, 355, 456
- Momjian et al. (2003) Momjian E., Romney J. D., Carilli C. L., Troland T. H., 2003, ApJ, 597, 809
- Mor & Netzer (2012) Mor R., Netzer H., 2012, MNRAS, 420, 526
- Mor, Netzer & Elitzur (2009) Mor R., Netzer H., Elitzur M., 2009, ApJ, 705, 298
- Moran et al. (2007) Moran E. C., Barth A. J., Eracleous M., Kay L. E., 2007, The ApJL, 668, L31
- Moran et al. (2000) Moran E. C., Barth A. J., Kay L. E., Filippenko A. V., 2000, The ApJL, 540, L73
- Morganti, Oosterloo & Tsvetanov (1998) Morganti R., Oosterloo T., Tsvetanov Z., 1998, AJ, 115, 915
- Morganti et al. (1991) Morganti R., Robinson A., Fosbury R. A. E., di Serego Alighieri S., Tadhunter C. N., Malin D. F., 1991, MNRAS, 249, 91
- Morganti et al. (1999) Morganti R., Tsvetanov Z. I., Gallimore J., Allen M. G., 1999, A&A Supplement Series, 137, 457
- Morris et al. (1985) Morris S., Ward M., Whittle M., Wilson A. S., Taylor K., 1985, MNRAS, 216, 193
- Mulchaey et al. (1994) Mulchaey J. S., Wilson A. S., Bower G. A., Heckman T. M., Krolik J. H., Miley G. K., 1994, ApJ, 433, 625
- Mulchaey, Wilson & Tsvetanov (1996) Mulchaey J. S., Wilson A. S., Tsvetanov Z., 1996, ApJSS, 102, 309
- Müller-Sánchez et al. (2011) Müller-Sánchez F., Prieto M. A., Hicks E. K. S., Vives-Arias H., Davies R. I., Malkan M., Tacconi L. J., Genzel R., 2011, ApJ, 739, 69
- Mundell et al. (1995) Mundell C. G., Holloway A. J., Pedlar A., Meaburn J., Kukula M. J., Axon D. J., 1995, MNRAS, 275, 67
- Mundell et al. (2000) Mundell C. G., Wilson A. S., Ulvestad J. S., Roy A. L., 2000, ApJ, 529, 816
- Nagao et al. (2004) Nagao T., Kawabata K. S., Murayama T., Ohyama Y., Taniguchi Y., Sumiya R., Sasaki S. S., 2004, AJ, 128, 109
- Nagar et al. (1999) Nagar N. M., Wilson A. S., Mulchaey J. S., Gallimore J. F., 1999, ApJSS, 120, 209
- Nenkova et al. (2008) Nenkova M., Sirocky M. M., Ivezić v., Elitzur M., 2008, ApJ, 685, 147
- Netzer (2015) Netzer H., 2015, arXiv:1505.00811 [astro-ph], arXiv: 1505.00811
- Netzer & Laor (1993) Netzer H., Laor A., 1993, The ApJL, 404, L51
- Ogle, Whysong & Antonucci (2006) Ogle P., Whysong D., Antonucci R., 2006, ApJ, 647, 161
- Oliva et al. (1998) Oliva E., Marconi A., Cimatti A., Alighieri S. D. S., 1998, A&A, 329, L21
- Packham et al. (2005) Packham C., Radomski J. T., Roche P. F., Aitken D. K., Perlman E., Alonso-Herrero A., Colina L., Telesco C. M., 2005, The ApJL, 618, L17
- Pedlar et al. (1990) Pedlar A., Ghataure H. S., Davies R. D., Harrison B. A., Perley R., Crane P. C., Unger S. W., 1990, MNRAS, 246, 477
- Pereira-Santaella et al. (2010) Pereira-Santaella M., Diamond-Stanic A. M., Alonso-Herrero A., Rieke G. H., 2010, ApJ, 725, 2270
- Perez et al. (1989) Perez E., Gonzalez-Delgado R., Tadhunter C., Tsvetanov Z., 1989, MNRAS, 241, 31P
- Perley, Bridle & Willis (1984) Perley R. A., Bridle A. H., Willis A. G., 1984, ApJSS, 54, 291
- Perley, Dreher & Cowan (1984) Perley R. A., Dreher J. W., Cowan J. J., 1984, The ApJL, 285, L35
- Perley, Roser & Meisenheimer (1997) Perley R. A., Roser H.-J., Meisenheimer K., 1997, A&A, 328, 12
- Phillips et al. (1983) Phillips M. M., Edmunds M. G., Pagel B. E. J., Turtle A. J., 1983, MNRAS, 203, 759
- Pogge (1988) Pogge R. W., 1988, ApJ, 328, 519
- Pogge (1989) Pogge R. W., 1989, ApJ, 345, 730
- Pogge & De Robertis (1995) Pogge R. W., De Robertis M. M., 1995, ApJ, 451, 585
- Privon et al. (2012) Privon G. C., Baum S. A., O’Dea C. P., Gallimore J., Noel-Storr J., Axon D. J., Robinson A., 2012, ApJ, 747, 46
- Raban et al. (2009) Raban D., Jaffe W., Röttgering H., Meisenheimer K., Tristram K. R. W., 2009, MNRAS, 394, 1325
- Radomski et al. (2003) Radomski J. T., Piña R. K., Packham C., Telesco C. M., De Buizer J. M., Fisher R. S., Robinson A., 2003, ApJ, 587, 117
- Radomski et al. (2002) Radomski J. T., Piña R. K., Packham C., Telesco C. M., Tadhunter C. N., 2002, ApJ, 566, 675
- Reunanen, Prieto & Siebenmorgen (2010) Reunanen J., Prieto M. A., Siebenmorgen R., 2010, MNRAS, 402, 879
- Sandqvist, Joersaeter & Lindblad (1995) Sandqvist A., Joersaeter S., Lindblad P. O., 1995, A&A, 295, 585
- Schmid, Appenzeller & Burch (2003) Schmid H. M., Appenzeller I., Burch U., 2003, A&A, 404, 505
- Schmitt et al. (2003a) Schmitt H. R., Donley J. L., Antonucci R. R. J., Hutchings J. B., Kinney A. L., 2003a, ApJSS, 148, 327
- Schmitt et al. (2003b) Schmitt H. R., Donley J. L., Antonucci R. R. J., Hutchings J. B., Kinney A. L., Pringle J. E., 2003b, ApJ, 597, 768
- Schmitt & Kinney (1996) Schmitt H. R., Kinney A. L., 1996, ApJ, 463, 498
- Schmitt & Storchi-Bergmann (1995) Schmitt H. R., Storchi-Bergmann T., 1995, MNRAS, 276, 592
- Schmitt et al. (2001) Schmitt H. R., Ulvestad J. S., Antonucci R. R. J., Kinney A. L., 2001, ApJSS, 132, 199
- Schommer et al. (1988) Schommer R. A., Caldwell N., Wilson A. S., Baldwin J. A., Phillips M. M., Williams T. B., Turtle A. J., 1988, ApJ, 324, 154
- Schreier, Burns & Feigelson (1981) Schreier E. J., Burns J. O., Feigelson E. D., 1981, ApJ, 251, 523
- Schweitzer et al. (2006) Schweitzer M. et al., 2006, ApJ, 649, 79
- Simkin et al. (1999) Simkin S. M., Sadler E. M., Sault R., Tingay S. J., Callcut J., 1999, ApJSS, 123, 447
- Simpson et al. (1997) Simpson C., Wilson A. S., Bower G., Heckman T. M., Krolik J. H., Miley G. K., 1997, ApJ, 474, 121
- Smajić et al. (2012) Smajić S., Fischer S., Zuther J., Eckart A., 2012, A&A, 544, 105
- Smith et al. (2004) Smith J. E., Robinson A., Alexander D. M., Young S., Axon D. J., Corbett E. A., 2004, MNRAS, 350, 140
- Stalevski et al. (2012) Stalevski M., Fritz J., Baes M., Nakos T., Popović L. ., 2012, MNRAS, 420, 2756
- Stern, Laor & Baskin (2014) Stern J., Laor A., Baskin A., 2014, MNRAS, 438, 901
- Storchi-Bergmann & Bonatto (1991) Storchi-Bergmann T., Bonatto C. J., 1991, MNRAS, 250, 138
- Tadhunter & Tsvetanov (1989) Tadhunter C., Tsvetanov Z., 1989, Nature, 341, 422
- Telesco et al. (1998) Telesco C. M., Pina R. K., Hanna K. T., Julian J. A., Hon D. B., Kisko T. M., 1998, in SPIE, Vol. 3354, Infrared Astronomical Instrumentation, pp. 534–544
- Tommasin et al. (2010) Tommasin S., Spinoglio L., Malkan M. A., Fazio G., 2010, ApJ, 709, 1257
- Tran (1995) Tran H. D., 1995, ApJ, 440, 578
- Tristram et al. (2014) Tristram K. R. W., Burtscher L., Jaffe W., Meisenheimer K., Hönig S. F., Kishimoto M., Schartmann M., Weigelt G., 2014, A&A, 563, 82
- Tristram et al. (2007) Tristram K. R. W. et al., 2007, A&A, 474, 837
- Ueda et al. (2015) Ueda Y. et al., 2015, ApJ, 815, 1
- Ulvestad & Wilson (1983) Ulvestad J. S., Wilson A. S., 1983, The ApJL, 264, L7
- Ulvestad & Wilson (1984a) Ulvestad J. S., Wilson A. S., 1984a, ApJ, 278, 544
- Ulvestad & Wilson (1984b) Ulvestad J. S., Wilson A. S., 1984b, ApJ, 285, 439
- Ulvestad & Wilson (1989) Ulvestad J. S., Wilson A. S., 1989, ApJ, 343, 659
- Vermeulen, Readhead & Backer (1994) Vermeulen R. C., Readhead A. C. S., Backer D. C., 1994, The ApJL, 430, L41
- Walker, Benson & Unwin (1987) Walker R. C., Benson J. M., Unwin S. C., 1987, ApJ, 316, 546
- Walker, Romney & Benson (1994) Walker R. C., Romney J. D., Benson J. M., 1994, The ApJL, 430, L45
- Ward et al. (1980) Ward M., Penston M. V., Blades J. C., Turtle A. J., 1980, MNRAS, 193, 563
- Weaver et al. (2010) Weaver K. A. et al., 2010, ApJ, 716, 1151
- Weedman et al. (2012) Weedman D., Sargsyan L., Lebouteiller V., Houck J., Barry D., 2012, ApJ, 761, 184
- Wehrle & Morris (1988) Wehrle A. E., Morris M., 1988, AJ, 95, 1689
- Whysong & Antonucci (2004) Whysong D., Antonucci R., 2004, ApJ, 602, 116
- Willett et al. (2011) Willett K. W., Darling J., Spoon H. W. W., Charmandaris V., Armus L., 2011, ApJSS, 193, 18
- Wilson et al. (1993) Wilson A. S., Braatz J. A., Heckman T. M., Krolik J. H., Miley G. K., 1993, The ApJL, 419, L61
- Wilson et al. (2000) Wilson A. S., Shopbell P. L., Simpson C., Storchi-Bergmann T., Barbosa F. K. B., Ward M. J., 2000, AJ, 120, 1325
- Wilson & Tsvetanov (1994) Wilson A. S., Tsvetanov Z. I., 1994, AJ, 107, 1227
- Wilson & Ulvestad (1982a) Wilson A. S., Ulvestad J. S., 1982a, ApJ, 260, 56
- Wilson & Ulvestad (1982b) Wilson A. S., Ulvestad J. S., 1982b, ApJ, 263, 576
- Wilson et al. (1989) Wilson A. S., Wu X., Heckman T. M., Baldwin J. A., Balick B., 1989, ApJ, 339, 729
- Wu, Zhao & Meng (2011) Wu Y.-Z., Zhao Y.-H., Meng X.-M., 2011, 1104.5707
- Yankulova, Golev & Jockers (2007) Yankulova I. M., Golev V. K., Jockers K., 2007, A&A, 469, 891
- Young et al. (1996a) Young S., Hough J. H., Efstathiou A., Wills B. J., Axon D. J., Bailey J. A., Ward M. J., 1996a, MNRAS, 279, L72
- Young et al. (1996b) Young S., Hough J. H., Efstathiou A., Wills B. J., Bailey J. A., Ward M. J., Axon D. J., 1996b, MNRAS, 281, 1206
- Zirbel & Baum (1998) Zirbel E. L., Baum S. A., 1998, ApJSS, 114, 177
| Opt. | nuc. | ext. | MIR | NLR | NLR | radio | radio | pol. | pol. | mas. | mas. | SA | host | host | [O IV] | |||
|---|---|---|---|---|---|---|---|---|---|---|---|---|---|---|---|---|---|---|
| Object | class | MIR | nuc. | PA | PA | ref. | PA | ref. | PA | ref. | PA | ref. | PA | PA | ref. | ([O IV] ) | ref. | |
| [Mpc] | ext. | ratio | [deg] | [deg] | [deg] | [deg] | [deg] | [deg] | [deg] | [erg s-1 cm-2] | ||||||||
| (1) | (2) | (3) | (4) | (5) | (6) | (7) | (8) | (9) | (10) | (11) | (12) | (13) | (14) | (15) | (16) | (17) | (18) | (19) |
| 1H 0419-577 | 499.0 | 1.5 | n | 0.16 | 44 48 | 1 | 1 | 1 | 1 | 1 | 1 | |||||||
| 1RXS J112716.6+ | 512.0 | 1.8 | u | 0.99 | 167 13 | 1 | 1 | 1 | 1 | 1 | 1 | |||||||
| 2MASX J03565655 | 351.0 | 1.9 | u | 1.60 | 113 19 | 1 | 1 | 1 | 1 | 72 | 2 | 1 | ||||||
| 2MASX J09180027 | 781.0 | 2 | u | 0.24 | 97 | 1 | 1 | 1 | 1 | 1 | 1 | |||||||
| 3C 33 | 273.0 | 2 | p | 1.28 | 121 | 1 | 200 | 3, 4 | 150 | 5 | 1 | 40 | 1 | -13.09 | 6 | |||
| 3C 98 | 137.0 | 2 | u | 74 | 1 | 20 | 7, 8 | 1 | 1 | 20 | 54 | 2 | -13.35 | 9 | ||||
| 3C 105 | 421.0 | 2 | u | 146 63 | 1 | 200 | 7, 8 | 1 | 1 | 200 | 1 | -13.73 | 9 | |||||
| 3C 120 | 150.0 | 1.5 | u | 0.18 | 143 35 | 1 | 85 | 10 | 1 | 1 | 85 | 119 | 2 | -11.95 | 11 | |||
| 3C 227 | 414.0 | 1.5 | n | 0.01 | 149 | 1 | 90 | 12 | 1 | 1 | 90 | 188 | 2 | -13.65 | 9 | |||
| 3C 273 | 792.0 | 1 | n | 0.01 | 114 34 | 1 | 1 | 1 | 1 | 1 | -13.07 | 11 | ||||||
| 3C 321 | 460.0 | 2 | p | 2.59 | 89 | 1 | 135 | 7 | 50 | 13 | 1 | 138 4 | 6 | 2 | -12.13 | 9 | ||
| 3C 327 | 505.0 | 1 | p | 0.45 | 97 | 1 | 100 | 7, 8 | 1 | 1 | 100 | 137 | 2 | -12.42 | 9 | |||
| 3C 382 | 267.0 | 1 | n | 150 | 1 | 230 | 12 | 1 | 1 | 230 | 90 | 2 | -13.52 | 9 | ||||
| 3C 390.3 | 259.0 | 1.5 | p | 0.75 | 92 | 1 | 145 | 14 | 1 | 1 | 145 | 90 | 2 | -13.59 | 9 | |||
| 3C 403 | 271.0 | 2 | u | 60 | 1 | 70 | 12 | 1 | 1 | 70 | -9 | 2 | -12.80 | 9 | ||||
| 3C 445 | 254.0 | 1.5 | u | 0.23 | 85 39 | 1 | 80 | 8 | 1 | 1 | 80 | 73 | 2 | -12.65 | 15 | |||
| 3C 452 | 378.0 | 2 | u | 0.51 | 141 | 1 | 75 | 12 | 1 | 1 | 75 | 99 | 2 | -13.89 | 6 | |||
| 4C +73.08 | 271.0 | 2 | u | 0.53 | 169 | 1 | 245 | 16 | 1 | 1 | 245 | 199 | 2 | 1 | ||||
| Ark 120 | 149.0 | 1 | n | 0.05 | 66 46 | 1 | 1 | 1 | 1 | -16 | 2 | -13.43 | 11 | |||||
| Cen A | 3.8 | 2 | y | 74 42 | 55 | 17 | 55 | 18 | 1 | 1 | 55 | 33 | 2 | -12.00 | 19 | |||
| Circinus | 4.2 | 2 | y | 0.40 | 100 10 | 135 | 20, 21 | 1 | 68 | 22 | 56 | 23 | 146 12 | 36 | 2 | -11.17 | 19 | |
| Cygnus A | 257.0 | 2 | y | 0.68 | 94 10 | 105 | 24, 25 | 105 | 26 | 1 | 1 | 105 | 151 | 2 | -12.34 | 27 | ||
| ESO 5-4 | 22.4 | 2 | u | 0.29 | 82 25 | 1 | 1 | 1 | 1 | 93 | 2 | -13.35 | 28 | |||||
| ESO 33-2 | 82.3 | 2 | p | 0.61 | 133 | 185 | 29 | 1 | 1 | 1 | 185 | 175 | 2 | -12.86 | 28 | |||
| ESO 103-35 | 59.5 | 2 | p | 1.24 | 109 12 | 1 | 1 | 1 | 1 | 42 | 2 | -12.51 | 11 | |||||
| ESO 121-28 | 187.0 | 2 | n | 25 9 | 1 | 1 | 1 | 1 | 89 | 30 | 1 | |||||||
| ESO 138-1 | 41.8 | 2 | u | 0.25 | 121 21 | 140 | 31 | 215 | 32 | 1 | 1 | 178 53 | 141 | 2 | 1 | |||
| ESO 141-55 | 169.0 | 1.2 | p | 0.24 | 120 47 | 1 | 1 | 1 | 1 | 71 | 2 | -13.14 | 33 | |||||
| ESO 198-24 | 208.0 | 1 | n | 98 89 | 1 | 1 | 1 | 1 | 1 | 1 | ||||||||
| ESO 209-12 | 189.0 | 1.5 | u | 0.13 | 132 57 | 1 | 1 | 1 | 1 | 65 | 2 | 1 | ||||||
| ESO 253-3 | 196.0 | 2 | u | 0.06 | 125 | 1 | 1 | 1 | 1 | 162 | 2 | -12.61 | 15 | |||||
| ESO 263-13 | 158.0 | 2 | n | 0.13 | 96 24 | 1 | 1 | 1 | 1 | 22 | 2 | 1 | ||||||
| ESO 297-18 | 111.0 | 2 | u | 149 50 | 1 | 1 | 1 | 1 | 144 | 2 | -13.48 | 34 | ||||||
| ESO 323-32 | 76.4 | 1.9 | u | 76 33 | 1 | 1 | 1 | 1 | 126 | 2 | 1 | |||||||
| ESO 323-77 | 71.8 | 1.2 | y | 0.10 | 95 27 | 180 | 35 | 1 | 84 | 36 | 1 | 180 | 156 | 37 | -12.60 | 28 | ||
| ESO 362-18 | 56.5 | 1.5 | n | 0.01 | 123 45 | 135 | 38 | 1 | 1 | 1 | 135 | 145 | 2 | -12.92 | 33 | |||
| ESO 416-2 | 272.0 | 1.9 | u | 44 21 | 1 | 1 | 1 | 1 | -13 | 2 | 1 | |||||||
| ESO 428-14 | 28.2 | 2 | y | 0.85 | 135 20 | 130 | 39 | 1 | 1 | 1 | 130 | 137 | 2 | -11.51 | 30 | |||
| ESO 506-27 | 119.0 | 2 | n | 0.05 | 93 8 | 1 | 1 | 1 | 1 | 69 | 2 | -13.41 | 34 | |||||
| ESO 511-30 | 105.0 | 1 | p | 82 3 | 1 | 1 | 1 | 1 | 1 | -14.10 | 34 | |||||||
| ESO 548-81 | 63.5 | 1 | p | 0.67 | 72 46 | 1 | 1 | 1 | 1 | 141 | 2 | -13.59 | 34 | |||||
| Fairall 9 | 215.0 | 1.2 | n | 0.04 | 94 62 | 1 | 1 | 1 | 1 | 115 | 2 | -13.20 | 11 | |||||
| Fairall 49 | 90.1 | 2 | p | 1.47 | 42 19 | 1 | 1 | 15 | 40 | 1 | 120 | 2 | -12.41 | 11 | ||||
| Fairall 51 | 64.1 | 1.5 | u | 180 | 160 | 29 | 1 | 1 | 1 | 160 | 169 | 2 | -12.61 | 11 | ||||
| H 0557-385 | 156.0 | 1.2 | u | 115 38 | 1 | 1 | 1 | 1 | 132 | 2 | -13.27 | 15 | ||||||
| H1143-182 | 156.0 | 1.5 | n | 0.01 | 78 9 | 1 | 1 | 1 | 1 | 40 | 2 | -12.62 | 34 | |||||
| IC 3639 | 53.6 | 2 | n | 0.09 | 105 32 | 1 | 1 | 1 | 1 | 33 | 30 | -12.45 | 19 | |||||
| IC 4329A | 76.5 | 1.2 | p | 65 9 | 36 | 35 | 1 | 1 | 1 | 36 | 46 | 2 | -11.93 | 15 | ||||
| IC 4518W | 76.1 | 2 | p | 0.10 | 158 | 1 | 1 | 1 | 1 | 135 | 2 | -12.07 | 41 | |||||
| IC 5063 | 49.1 | 2 | y | 0.19 | 108 5 | 115 | 29 | 115 | 42 | 8 | 40 | 1 | 107 12 | 120 | 2 | -11.94 | 15 | |
| IRAS 01003-2238 | 565.0 | 2 | u | 81 | 1 | 1 | 1 | 1 | 118 | 2 | -14.52 | 43 | ||||||
| IRAS 04103-2838 | 567.0 | 2 | p | 0.13 | 77 | 1 | 1 | 1 | 1 | 50 | 2 | -13.37 | 33 | |||||
| IRAS 05189-2524 | 196.0 | 2 | p | 0.74 | 94 4 | 1 | 1 | 50 | 44 | 1 | 140 | 107 | 2 | -12.58 | 45 | |||
| IRAS 09149-6206 | 269.0 | 1 | n | 80 12 | 1 | 1 | 1 | 1 | 1 | 1 | ||||||||
| IRAS 13349+2438 | 522.0 | 1n | u | 16 19 | 1 | 1 | 1 | 1 | 1 | -13.14 | 46 | |||||||
| I Zw 1 | 269.0 | 1n | u | 0.31 | 76 66 | 1 | 1 | 1 | 1 | 156 | 2 | -13.57 | 33 | |||||
| LEDA 170194 | 173.0 | 2 | n | 0.04 | 44 18 | 1 | 1 | 1 | 1 | 8 | 2 | 1 | ||||||
| LEDA 178130 | 160.0 | 2 | p | 0.63 | 118 39 | 1 | 1 | 1 | 1 | 72 | 2 | -13.74 | 34 | |||||
| LEDA 549777 | 284.1 | 2 | u | 123 | 1 | 1 | 1 | 1 | 206 | 2 | 1 | |||||||
| M51a | 8.1 | 2 | p | 1.33 | 52 10 | -17 | 47 | -20 | 48 | 1 | 155 | 49, 50 | -19 2 | -17 | 2 | -12.61 | 19 | |
| MCG-1-5-47 | 73.4 | 2 | u | 35 59 | 1 | 1 | 1 | 1 | -20 | 2 | 1 | |||||||
| MCG-1-13-25 | 71.2 | 1.2 | p | 0.55 | 56 45 | 1 | 1 | 1 | 1 | 35 | 2 | -14.12 | 28 | |||||
| MCG-1-24-12 | 93.8 | 2 | n | 0.23 | 122 46 | 75 | 29 | 1 | 1 | 1 | 75 | 40 | 2 | -13.00 | 28 | |||
| MCG-2-8-14 | 72.5 | 2 | u | 0.20 | 103 30 | 1 | 1 | 1 | 1 | 95 | 2 | 1 | ||||||
| MCG-2-8-39 | 133.0 | 2 | n | 0.11 | 58 16 | 1 | 1 | 1 | 1 | 3 | 2 | -12.84 | 33 | |||||
| MCG-3-34-64 | 79.3 | 1.8/2 | y | 0.69 | 51 8 | 1 | 39 | 51 | 109 | 52 | 1 | 29 14 | 75 | 2 | -11.96 | 28 | ||
| MCG-5-23-16 | 42.8 | 1.9 | n | 76 27 | 40 | 53 | 1 | 20 | 40 | 1 | 40 | 52 | 2 | -12.55 | 28 | |||
| MCG-6-30-15 | 38.8 | 1.5 | p | 0.16 | 106 13 | 115 | 53, 29 | 1 | 1 | 1 | 115 | 116 | 2 | -12.63 | 28 | |||
| MR 2251-178 | 293.0 | 1.5 | u | 0.51 | 57 23 | 1 | 1 | 1 | 1 | 75 | 2 | 1 | ||||||
| Mrk 3 | 60.6 | 2 | p | 0.38 | 69 | 70 | 54, 55 | 84 | 56 | 150 | 57 | 1 | 71 12 | 15 | 2 | -11.71 | 11 | |
| Mrk 304 | 301.0 | 1 | p | 1.06 | 3 | 1 | 1 | 1 | 1 | 1 | -13.90 | 58 | ||||||
| Mrk 509 | 153.0 | 1.5 | n | 107 24 | 1 | 1 | 1 | 1 | 80 | 2 | -12.55 | 19 | ||||||
| Mrk 573 | 73.1 | 2 | u | 132 21 | 124 | 59, 55 | 125 | 60 | 51 | 61 | 1 | 130 9 | 180 | 30 | -12.10 | 33 | ||
| Mrk 590 | 116.0 | 1 | n | 0.02 | 133 24 | 175 | 29 | 1 | 1 | 1 | 175 | 1 | -13.51 | 11 | ||||
| Mrk 841 | 170.0 | 1.5 | p | 0.42 | 155 31 | 1 | 1 | 1 | 1 | 70 | 2 | -12.62 | 33 | |||||
| Mrk 915 | 104.0 | 1.9 | u | 0.19 | 14 | 5 | 29 | 1 | 1 | 1 | 5 | -9 | 2 | -12.41 | 34 | |||
| Mrk 926 | 210.0 | 1.5 | p | 0.56 | 66 15 | 90 | 62 | 90 | 63 | 1 | 1 | 90 | 104 | 2 | -12.90 | 11 | ||
| Mrk 1014 | 807.0 | 1.5 | p | 0.81 | 63 | 90 | 64 | 90 | 65 | 1 | 1 | 90 | 74 | 2 | -12.92 | 11 | ||
| Mrk 1018 | 191.0 | 1 | n | 95 15 | 1 | 1 | 1 | 1 | 176 | 2 | -13.74 | 34 | ||||||
| Mrk 1239 | 95.4 | 1n | p | 0.12 | 122 40 | 191 | 35 | 1 | 1 | 1 | 191 | 1 | -12.81 | 15 | ||||
| NGC 235A | 96.2 | 2 | p | 0.67 | 97 40 | 80 | 35 | 43 | 66 | 1 | 1 | 62 26 | 120 | 2 | -12.64 | 34 | ||
| NGC 424 | 49.5 | 2 | p | 0.45 | 80 | 70 | 67 | 90 | 68, 32 | 43 | 69 | 1 | 68 24 | 61 | 2 | -12.59 | 33 | |
| NGC 454E | 52.3 | 2 | p | 0.25 | 121 5 | 1 | 1 | 1 | 1 | 90 | 2 | -12.80 | 28 | |||||
| NGC 526A | 82.8 | 1.9 | n | 132 13 | 130 | 35, 70 | 1 | 1 | 1 | 130 | 110 | 2 | -12.71 | 15 | ||||
| NGC 788 | 57.2 | 2 | n | 0.22 | 38 34 | 1 | 62 | 66 | 124 | 71 | 1 | 48 20 | 108 | 2 | -12.74 | 19 | ||
| NGC 985 | 195.0 | 1.5 | n | 87 21 | 1 | 1 | 1 | 1 | 80 | 2 | -12.66 | 34 | ||||||
| NGC 1068 | 14.4 | 1.8/2 | y | 1.74 | 175 3 | 215 | 72, 73 | 201 | 74 | 140 | 75 | 94 | 76, 77, 78 | 208 20 | 245 | 30 | -10.72 | 19 |
| NGC 1144 | 128.0 | 2 | u | 105 25 | 1 | 1 | 1 | 1 | 118 | 2 | -13.27 | 15 | ||||||
| NGC 1194 | 58.2 | 1.9 | n | 102 40 | 56 | 29 | 56 | 51 | 1 | 1 | 56 | 139 | 2 | -12.84 | 28 | |||
| NGC 1275 | 76.8 | 1.5/L | u | 0.02 | 210 16 | 1 | 160 | 79, 80, 81 | 1 | 1 | 160 | 290 | 2 | -12.73 | 19 | |||
| NGC 1365 | 17.9 | 1.8 | u | 0.12 | 82 25 | 125 | 82, 83, 84, 85 | 125 | 86 | 1 | 1 | 125 | 20 | 2 | -11.80 | 19 | ||
| NGC 1386 | 16.5 | 2 | y | 0.79 | 177 20 | 185 | 29 | 170 | 66 | 1 | 1 | 178 11 | 205 | 2 | -12.06 | 19 | ||
| NGC 1566 | 14.3 | 1.5 | u | 0.06 | 157 37 | 135 | 55 | 1 | 1 | 1 | 135 | 225 | 2 | -13.05 | 19 | |||
| NGC 1667 | 67.8 | 2 | p | 0.32 | 54 | 1 | 1 | 1 | 1 | 3 | 2 | -13.03 | 19 | |||||
| NGC 2110 | 35.9 | 2 | p | 0.12 | 115 38 | 160 | 87 | 180 | 88, 66 | 83 | 89 | 1 | 171 10 | 175 | 2 | -12.34 | 28 | |
| NGC 2992 | 39.7 | 1.5/2 | y | 38 43 | 125 | 90 | 154 | 91, 92 | 35 | 40 | 1 | -41 21 | 17 | 2 | -11.97 | 19 | ||
| NGC 3081 | 40.9 | 2 | p | 0.21 | 170 10 | 164 | 53 | 164 | 66 | 79 | 69 | 1 | 166 3 | 251 | 2 | -12.00 | 19 | |
| NGC 3147 | 30.1 | 2 | p | 0.33 | 152 5 | 1 | 1 | 1 | 1 | 150 | 2 | -13.19 | 19 | |||||
| NGC 3227 | 22.1 | 1.5 | y | 0.59 | 158 40 | 195 | 55 | 170 | 93 | 1 | 1 | 183 18 | 157 | 2 | -12.24 | 19 | ||
| NGC 3281 | 52.8 | 2 | y | 0.34 | 176 16 | 200 | 29 | 1 | 1 | 1 | 200 | 140 | 2 | -11.86 | 19 | |||
| NGC 3393 | 61.6 | 2 | u | 0.29 | 81 57 | 55 | 55, 94 | 50 | 32, 51 | 1 | -34 | 95, 96 | 65 22 | 13 | 2 | 1 | ||
| NGC 3783 | 48.4 | 1.5 | u | 0.12 | 122 35 | 1 | 1 | -45 | 97 | 1 | 163 | 2 | -12.55 | 19 | ||||
| NGC 3982 | 21.4 | 2 | u | 0.20 | 37 39 | 1 | 1 | 1 | 1 | 25 | 2 | -12.93 | 19 | |||||
| NGC 4051 | 12.2 | 1n | u | 0.06 | 134 | 100 | 55 | 1 | 1 | 1 | 100 | 130 | 30 | -12.58 | 19 | |||
| NGC 4074 | 107.0 | 2 | p | 0.43 | 189 | 131 | 35 | 133 | 66 | 1 | 1 | 132 1 | 278 | 2 | -12.55 | 34 | ||
| NGC 4138 | 13.8 | 1.9 | u | 0.25 | 147 | 1 | 1 | 1 | 1 | 150 | 2 | -13.37 | 19 | |||||
| NGC 4151 | 13.3 | 1.5 | p | 0.28 | 37 36 | 67 | 98, 99, 100 | 77 | 101 | 1 | 1 | 72 7 | -50 | 30 | -11.68 | 19 | ||
| NGC 4235 | 41.2 | 1.2 | n | 66 61 | 48 | 98 | 1 | 1 | 1 | 48 | 49 | 2 | -13.36 | 19 | ||||
| NGC 4258 | 7.6 | 2 | u | 0.04 | 1 51 | 1 | 1 | 1 | 83 | 102 | 173 | 150 | 2 | -13.13 | 19 | |||
| NGC 4388 | 19.2 | 2 | y | 0.62 | 28 34 | 30 | 103 | 30 | 103 | 1 | 1 | 30 | 91 | 2 | -11.59 | 19 | ||
| NGC 4395 | 4.3 | 1.8 | u | 0.64 | 101 | 90 | 104, 105 | 1 | 1 | 1 | 90 | 127 | 2 | -13.37 | 19 | |||
| NGC 4501 | 17.9 | 2 | u | 153 | 1 | 1 | 1 | 1 | 138 | 2 | -13.40 | 19 | ||||||
| NGC 4507 | 57.5 | 2 | n | 111 22 | 145 | 29 | 190 | 32 | 37 | 69 | 1 | 154 32 | 50 | 2 | -12.48 | 19 | ||
| NGC 4593 | 45.6 | 1 | y | 0.18 | 103 19 | 100 | 29 | 1 | 1 | 1 | 100 | 50 | 30 | -12.88 | 19 | |||
| NGC 4941 | 21.2 | 2 | n | 0.01 | 116 11 | 1 | 155 | 51 | 1 | 1 | 155 | 195 | 30 | -12.82 | 19 | |||
| NGC 4992 | 119.0 | 1/2/L/N | u | 0.44 | 127 53 | 1 | 1 | 1 | 1 | 192 | 2 | -13.96 | 34 | |||||
| NGC 5033 | 18.1 | 1.2 | y | 0.11 | 175 5 | 80 | 106 | 95 | 48 | 1 | 1 | 88 11 | 172 | 2 | -12.80 | 19 | ||
| NGC 5135 | 66.0 | 2 | n | 66 48 | 0 | 107 | 30 | 68 | 1 | 1 | 15 21 | 120 | 30 | -12.23 | 19 | |||
| NGC 5252 | 109.0 | 1.9 | u | 0.08 | 144 24 | 167 | 108 | 175 | 109 | 1 | 1 | 171 6 | 192 | 2 | -13.06 | 34 | ||
| NGC 5273 | 15.3 | 1.5 | p | 0.05 | 115 44 | 180 | 53 | 185 | 91, 66 | 1 | 1 | 183 4 | 184 | 2 | -13.43 | 19 | ||
| NGC 5347 | 38.1 | 2 | u | 3 5 | 30 | 98, 29 | 1 | 1 | 1 | 30 | -60 | 2 | -13.12 | 33 | ||||
| NGC 5506 | 31.6 | 2 | y | 0.19 | 60 56 | -16 | 110 | 1 | 80 | 40 | 1 | -13 4 | 89 | 2 | -11.65 | 19 | ||
| NGC 5548 | 80.7 | 1.5 | p | 1.18 | 200 17 | 180 | 111, 29 | 160 | 112, 48 | 1 | 1 | 170 14 | 123 | 2 | -12.90 | 11 | ||
| NGC 5643 | 20.9 | 2 | p | 0.37 | 52 17 | 84 | 113 | 87 | 114, 115 | 1 | 1 | 86 2 | 90 | 30 | -12.09 | 19 | ||
| NGC 5728 | 45.4 | 1.9/2 | y | 0.41 | 98 25 | 120 | 116 | 127 | 117 | 1 | 1 | 124 5 | 35 | 30 | -11.89 | 19 | ||
| NGC 5995 | 117.0 | 1.9 | n | 0.02 | 111 39 | 1 | 1 | 1 | 1 | 147 | 2 | -12.89 | 15 | |||||
| NGC 6251 | 112.0 | 1/2/L | u | 0.89 | 145 | 1 | 116 | 118, 119 | 1 | 1 | 116 | 200 | 2 | -14.28 | 120 | |||
| NGC 6300 | 14.3 | 2 | p | 0.43 | 112 4 | 1 | 190 | 32 | 35 | 40 | 1 | 158 46 | 118 | 2 | -12.53 | 19 | ||
| NGC 6814 | 20.1 | 1.5 | n | 0.26 | 97 10 | 150 | 55 | 180 | 91 | 1 | 1 | 165 21 | 80 | 30 | -12.67 | 19 | ||
| NGC 6860 | 65.8 | 1.5 | n | 0.03 | 53 49 | 90 | 121, 29 | 1 | 1 | 1 | 90 | 32 | 2 | -12.92 | 15 | |||
| NGC 6890 | 33.8 | 1.9/2 | p | 0.24 | 102 | 1 | 1 | 1 | 1 | 75 | 30 | -13.00 | 33 | |||||
| NGC 7172 | 34.8 | 2 | y | 0.40 | 86 10 | 60 | 122 | 90 | 32 | 1 | 1 | 75 21 | 105 | 2 | -12.31 | 19 | ||
| NGC 7212 | 116.0 | 2 | p | 0.54 | 177 | 170 | 29, 123 | 170 | 103 | 100 | 124 | 1 | 177 12 | 212 | 2 | 1 | ||
| NGC 7213 | 23.0 | 1.5/L | n | 0.18 | 104 22 | 90 | 1 | 1 | 1 | 1 | 90 | 121 | 2 | -13.68 | 19 | |||
| NGC 7314 | 18.3 | 1.9/2 | y | 0.41 | 87 43 | 1 | 1 | 5 | 40 | 1 | 93 | 3 | 2 | -12.31 | 19 | |||
| NGC 7469 | 67.9 | 1/1.5 | y | 0.11 | 110 32 | 90 | 125 | 85 | 126 | 1 | 1 | 88 4 | 127 | 2 | -12.44 | 19 | ||
| NGC 7479 | 30.0 | 2 | n | 82 | 80 | 127 | 1 | 1 | 1 | 80 | 0 | 30 | -12.57 | 19 | ||||
| NGC 7674 | 126.0 | 2 | y | 0.26 | 140 24 | 120 | 29 | 115 | 128 | 40 | 57 | 1 | 122 8 | 165 | 2 | -12.35 | 45 | |
| PG 0026+129 | 691.0 | 1.2 | u | 0.16 | 107 | 1 | 1 | 1 | 1 | 1 | -13.70 | 11 | ||||||
| PG 0052+251 | 759.0 | 1.2 | u | 129 | 1 | 1 | 1 | 1 | 1 | 1 | ||||||||
| PG 0844+349 | 302.0 | 1 | p | 0.74 | 109 | 1 | 1 | 1 | 1 | 50 | 2 | -13.83 | 45 | |||||
| PG 2130+099 | 288.0 | 1.5 | u | 0.16 | 158 27 | 1 | 135 | 1 | 1 | 1 | 135 | 242 | 2 | -13.00 | 45 | |||
| PKS 1417-19 | 586.0 | 1.5 | p | 0.65 | 98 | 1 | 20 | 129 | 1 | 1 | 20 | 40 | 2 | 1 | ||||
| PKS 1814-63 | 302.0 | 2 | u | 0.27 | 25 | 1 | 1 | 1 | 1 | 114 | 2 | -13.49 | 9 | |||||
| PKS 2158-380 | 149.0 | 2 | u | 0.10 | 109 | 1 | 90 | 130, 131 | 1 | 1 | 90 | 103 | 2 | 1 | ||||
| Pictor A | 161.0 | 1.5/L | u | 99 21 | 135 | 132 | 101 | 133, 134 | 1 | 1 | 118 24 | 82 | 2 | -14.30 | 34 | |||
| Superantennae S | 291.0 | 2 | p | 0.39 | 151 26 | 1 | 1 | 1 | 1 | 175 | 2 | -13.20 | 33 | |||||
| UGC 12348 | 110.0 | 2 | p | 0.13 | 72 3 | 100 | 29 | 1 | 1 | 1 | 100 | 136 | 2 | 1 | ||||
| Z 41-20 | 170.0 | 2 | u | 172 36 | 1 | 1 | 1 | 1 | 215 | 2 | 1 |
Note. — Objects in bold belong to the extended Seyfert sample. (1), (2), (3), and (4) short object name, distance, optical class, nuclear MIR extension (“n” not resolved, “p” possibly extended, “u” unknown extension, “y” extended) from Asmus et al. (2014); (5) relative extended to nuclear emission ratio at , ; (6) mean nuclear MIR PA from the individual images from Asmus et al. (2014) with standard deviation in case of multiple measurements available; note that this value can be unreliable if the object was not classified as extended; (7) PA of the NLR major axis, mostly from [O III] images; (8) reference for the NLR PA; (9) PA of the nuclear radio morphology; (10) reference for the radio PA; (11) PA of polarised broad lines; (12) reference for the polarisation PA; (13) maser PA; (14) reference for the maser PA; (15) mean system axis PA and standard deviation (if multiple PAs are used); (16) host inner structure PA; (17) host PA reference; (18) [O IV] flux; (19) [O IV] reference; list of references: 1: Hyperleda (Makarov et al., 2014); 2: Leahy & Perley (1991); 3: Giovannini et al. (2005); 4: Cohen et al. (1999); 5: Ogle, Whysong & Antonucci (2006); 6: Baum et al. (1988); 7: Leahy et al. (1997); 8: Dicken et al. (2014); 9: Walker, Benson & Unwin (1987); 10: Dasyra et al. (2011); 11: Black et al. (1992); 12: Young et al. (1996a); 13: Leahy & Perley (1995); 14: Tommasin et al. (2010); 15: Mayer (1979); 16: Morganti et al. (1991); 17: Schreier, Burns & Feigelson (1981); 18: Diamond-Stanic, Rieke & Rigby (2009); 19: Marconi et al. (1994); 20: Wilson et al. (2000); 21: Oliva et al. (1998); 22: Greenhill et al. (2003); 23: Jackson, Tadhunter & Sparks (1998); 24: Canalizo et al. (2003); 25: Perley, Dreher & Cowan (1984); 26: Privon et al. (2012); 27: Weaver et al. (2010); 28: Schmitt et al. (2003a); 29: this work; 30: Schmitt & Storchi-Bergmann (1995); 31: Morganti et al. (1999); 32: Wu, Zhao & Meng (2011); 33: Weedman et al. (2012); 34: Mulchaey, Wilson & Tsvetanov (1996); 35: Schmid, Appenzeller & Burch (2003); 36: Erwin (2004); 37: Fraquelli, Storchi-Bergmann & Binette (2000); 38: Falcke et al. (1996); 39: Lumsden, Alexander & Hough (2004); 40: Pereira-Santaella et al. (2010); 41: Morganti, Oosterloo & Tsvetanov (1998); 42: Farrah et al. (2007); 43: Young et al. (1996b); 44: Dasyra et al. (2008); 45: Willett et al. (2011); 46: Ford et al. (1985); 47: Ho & Ulvestad (2001); 48: Hagiwara et al. (2001); 49: Hagiwara (2007); 50: Schmitt et al. (2001); 51: Kay (1994); 52: Ferruit, Wilson & Mulchaey (2000); 53: Capetti et al. (1995); 54: Schmitt & Kinney (1996); 55: Kukula et al. (1993); 56: Miller & Goodrich (1990); 57: Schweitzer et al. (2006); 58: Pogge & De Robertis (1995); 59: Ulvestad & Wilson (1984a); 60: Nagao et al. (2004); 61: Durret & Bergeron (1988); 62: Mundell et al. (2000); 63: Bennert et al. (2002); 64: Leipski et al. (2006); 65: Nagar et al. (1999); 66: Durret & Bergeron (1987); 67: Ulvestad & Wilson (1989); 68: Moran et al. (2000); 69: Bennert et al. (2006); 70: Kay & Moran (1998); 71: Pogge (1988); 72: Evans et al. (1991); 73: Gallimore et al. (1996b); 74: Bailey et al. (1988); 75: Claussen, Heiligman & Lo (1984); 76: Greenhill et al. (1996); 77: Gallimore et al. (1996a); 78: Pedlar et al. (1990); 79: Walker, Romney & Benson (1994); 80: Vermeulen, Readhead & Backer (1994); 81: Phillips et al. (1983); 82: Jorsater, Lindblad & Boksenberg (1984); 83: Storchi-Bergmann & Bonatto (1991); 84: Kristen et al. (1997); 85: Sandqvist, Joersaeter & Lindblad (1995); 86: Mulchaey et al. (1994); 87: Ulvestad & Wilson (1983); 88: Moran et al. (2007); 89: Allen et al. (1999); 90: Ulvestad & Wilson (1984b); 91: Wehrle & Morris (1988); 92: Mundell et al. (1995); 93: Cooke et al. (2000); 94: Kondratko et al. (2006); 95: Kondratko, Greenhill & Moran (2008); 96: Smith et al. (2004); 97: Pogge (1989); 98: Perez et al. (1989); 99: Evans et al. (1993); 100: Wilson & Ulvestad (1982a); 101: Greenhill et al. (1995); 102: Falcke, Wilson & Simpson (1998); 103: Matthews et al. (1999); 104: Filippenko & Ho (2003); 105: Mediavilla et al. (2005); 106: González Delgado et al. (1998); 107: Tadhunter & Tsvetanov (1989); 108: Wilson & Tsvetanov (1994); 109: Colbert et al. (1996); 110: Wilson et al. (1989); 111: Wilson & Ulvestad (1982b); 112: Simpson et al. (1997); 113: Morris et al. (1985); 114: Leipski et al. (2006); 115: Wilson et al. (1993); 116: Schommer et al. (1988); 117: Perley, Bridle & Willis (1984); 118: Jones et al. (1986); 119: Meléndez et al. (2008); 120: Lipari, Tsvetanov & Macchetto (1993); 121: Smajić et al. (2012); 122: Cracco et al. (2011); 123: Tran (1995); 124: Müller-Sánchez et al. (2011); 125: Lonsdale et al. (2003); 126: Yankulova, Golev & Jockers (2007); 127: Momjian et al. (2003); 128: Antonucci (1985); 129: Boyce et al. (1996); 130: Zirbel & Baum (1998); 131: Simkin et al. (1999); 132: Perley, Roser & Meisenheimer (1997).