Alignments of Radio Galaxies in Deep Radio Imaging of ELAIS N1
Abstract
We present a study of the distribution of radio jet position angles of radio galaxies over an area of 1 square degree in the ELAIS N1 field. ELAIS N1 was observed with the Giant Metrewave Radio Telescope at 612 MHz to an rms noise level of 10 Jy and angular resolution of . The image contains 65 resolved radio galaxy jets. The spatial distribution reveals a prominent alignment of jet position angles along a “filament” of about 1∘. We examine the possibility that the apparent alignment arises from an underlying random distribution and find that the probability of chance alignment is less than 0.1%. An angular covariance analysis of the data indicates the presence of spatially coherence in position angles on scales . This angular scales translates to a co-moving scale of Mpc at a redshift of 1. The implied alignment of the spin axes of massive black holes that give rise the radio jets suggest the presence of large-scale spatial coherence in angular momentum. Our results reinforce prior evidence for large-scale spatial alignments of quasar optical polarisation position angles.
keywords:
radio continuum: galaxies – galaxies: jets – galaxies: statistics – cosmology: large-scale structure of the universe1 Introduction
There have been several observational studies to detect deviations from isotropy in the orientation of galaxies following approaches first devised by Hawley & Peebles (1975). If detected, the presence of alignments and certain preferred orientations can shed light on the origin and evolution of the galaxies and the relation to large scale structure. Alignment might arise from the large scale environmental influences during galaxy formation or evolution. Cosmic magnetic fields have been shown to be present on scales of galaxy clusters and larger Ratra (1992). Effects of seed magnetic fields from inflation Ratra (1992), axionic fields post inflation, and cosmic strings are possible candidates that could effect an alignment in galaxies even on scales larger than galaxy clusters.
Evidence for very large scale coherent orientations of quasar polarisation vectors was provided by Hutsemékers (1998), who found large-scale coherence in polarisation position angles of galaxies around the Northern and Southern galactic poles from a sample of 170 quasars. Initial Kuiper tests to show deviations from uniformity proved inconclusive on the complete sample. However a statistical analysis based on nearest neighbours showed evidence for alignments in quasar sub-samples particularly around the north and south galactic poles with 99.99% significance level. Follow up observations by Hutsemékers & Lamy (2001) indicated that the alignments in quasars polarisation vectors extends to comoving scales of Mpc and that alignment of quasar polarisation angles may be correlated with the large scale structure it is embedded within.
The tendency for the axes of double-lobed radio quasars to be aligned with the electric vectors of optical polarisation in the active galactic nuclei is well known (Stockman et al. (1979)). Rusk (1990) show that there is a correlation between the optical polarisation and the structural axis of a galaxy, and Battye & Browne (2009) show that radio jets are aligned with the optical minor axis. AGN jets position angles are thus a proxy for the direction of the major axis of the host galaxy. Measurements derived from the total intensity radio emission of AGN jets has the advantage of not being affected by propagation effects such as scattering, extinction or Faraday Rotation, which may be an issue for optical and polarimetric studies.
We have undertaken a deep radio imaging survey of the ELAIS-N1 region using the Giant Metrewave Radio Telescope (GMRT) as part of a larger, low-frequency study of the properties of faint radio sources at Jy flux densities. Such sensitive radio images, capable of detecting radio sources in the Jy regime and covering scales of a degree or more, offer a first opportunity to use radio jets to explore alignments or radio galaxies on physical scales below a few 100 Mpc. An angle of 1 degree spans a comoving distance of 40 Mpc at redshift or 64 Mpc at redshift . In this paper we report an analysis of the spatial correlation of radio galaxy jet position angles in the deep GMRT image of the ELAIS-N1 field, and the detection of an alignment of the jets of a sub-sample of radio galaxies over angular scales of 0.5 degrees.
2 Observations
We carried out deep imaging observations of the ELAIS N1 field with the Giant Metrewave Radio Telescope (GMRT) in several observing sessions from 2011 to 2013. An area of 1.2 sq degrees of ELAIS N1 was covered by a mosaic of 7 pointings arranged in a hexagon pattern centred on = 16h 10m 30s, = 54o 35 00′′.
To reduce the noise and mitigate the effect of side-lobes from off-axis gain errors in the central regions of the mosaic, the separation of the pointings on the sky was closely spaced at 16′, or 38% of the FWHM of the GMRT primary beams at 612 MHz. Each pointing was observed for approximately 30 hours in three 10-hour sessions. Data were taken in 256 spectral channels in four polarisation states covering a 32 MHz bandwidth centred at 612 MHz. The flux scale, bandpass and absolute polarisation position angle calibration was secured by observations of 3C286 twice in each observing session. Time dependent complex gains and on-axis polarisation leakage corrections were measured by frequent observations of J1549+506.
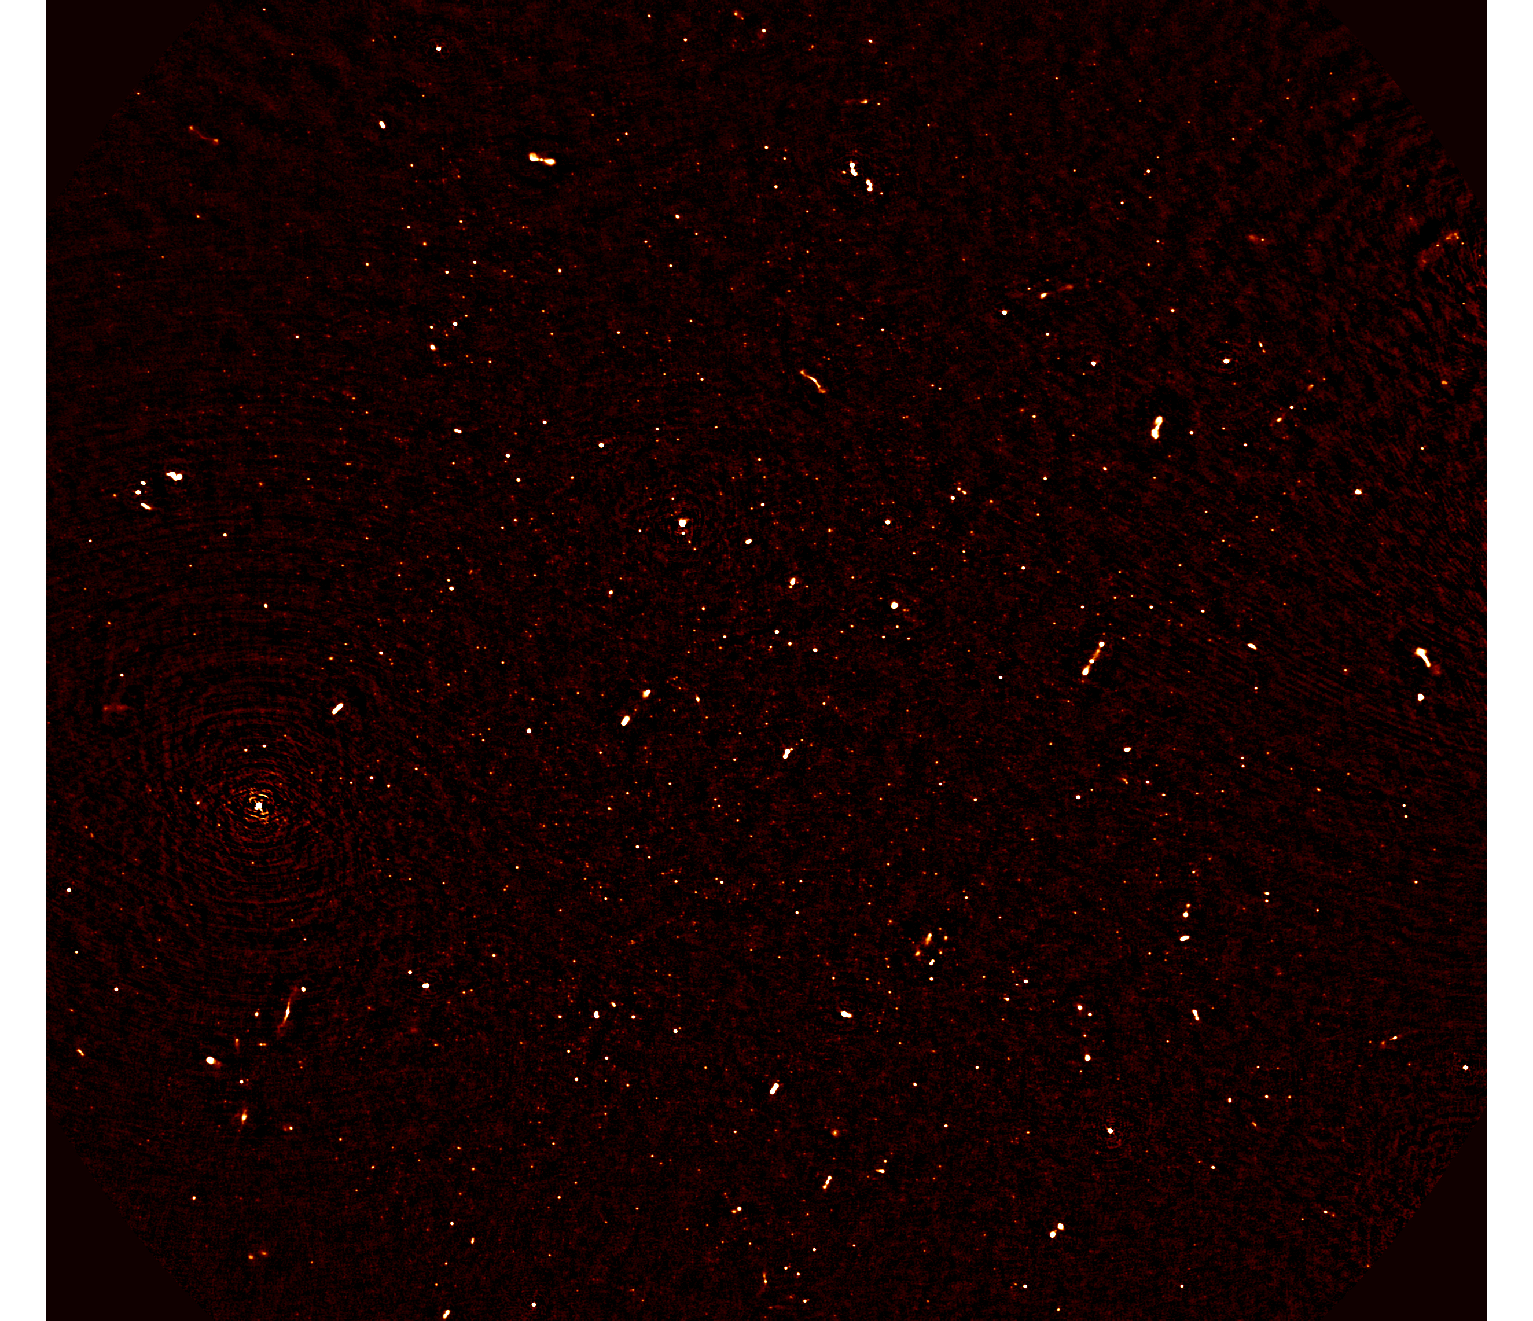
The visibility data were calibrated, deconvolved (CLEANed), self-calibrated, imaged, and the individual fields mosaicked together using the CASA processing software. The central 1.1 sq degrees of the GMRT mosaic image are shown in Figure 1. The rms noise in this mosaic is 10.3 Jy/beam before primary beam correction. The angular resolution (FWHM of the synthesised beam) is 6.1 5.1′′.
3 Alignments of Radio Sources
3.1 Source Finding
Within the region defined by the half-power point of the 6 outer pointings, there are 2800 sources above a flux density of 50 Jy. A vast majority of the sources are faint, compact sources that are unresolved by the 6′′ synthesised beam. However, the brighter sources in the image are dominated by objects that exhibit classical FRI or FRII elongated radio galaxy jet morphologies. These sources were identified on the image visually and the coordinates of the two end points of the jets for each source were measured from the images. This processed yield a set of 64 radio galaxies that constitutes a complete sample of jet sources down to the resolution limit of the observations. This sample forms the basis of our further analysis.
3.2 The Distribution of Position Angles
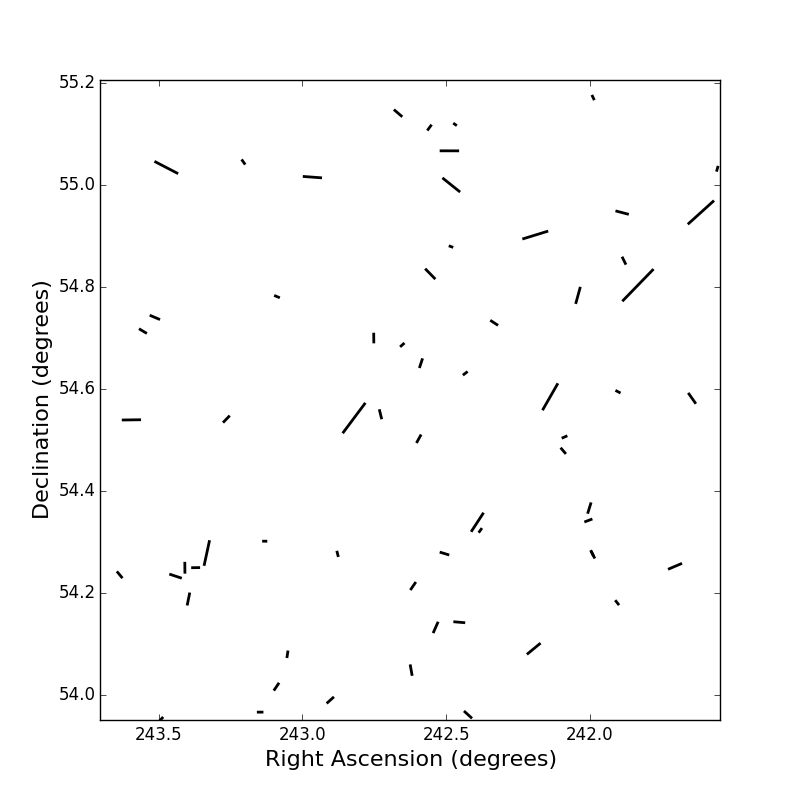
Figure 2 shows the positions, directions and lengths of the 64 radio galaxy jet in the field. To render the objects more easily viewable, the size of the vector for each of the jets is plotted at twice their true length. The plot shows a number of large jets with similar position angle of about -40∘ running along a locus starting at the lower middle of the image and extending to upper right. To assess whether such apparent alignments arises by chance, or whether they reflect real spatial correlation in the directions of radio jets we explore the statistical likelihood of the alignments given an underlying random distribution of jet directions.
For analysis involving position angles on a sphere, standard estimators such as the mean need to be redefined. We can clearly see that and are the same. Similarly the mean angle of two sources with position angles and is not . Fisher (1993) provides a comprehensive collection of methods of dealing with spherical statistics.
We can consider the position angles to be unit vectors on a circle in which case each angle, , can be thought of as a Cartesian point on the edge of the circle with coordinates . To compute the arithmetic mean we could simply take the arithmetic means of the Cartesian points and then convert them back into polar form to obtain the mean angular measure. Given angles the mean angle is given by
| (1) |
and the mean resultant length by
| (2) |
where and are the average values of and .
Like polarisation angle, the position angle of radio jet sources is symmetric to a change by . Values are thus defined in the range degrees. For a parent random distribution of position angles, the probability distribution of the positions angles on the circle should be a uniform within this range, with every angle equally likely, implying that the probability distribution function is
| (3) |
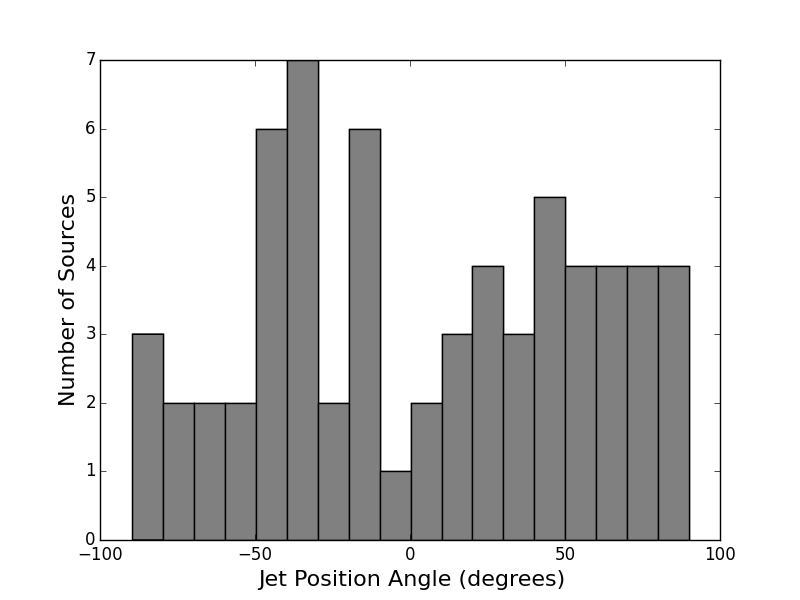
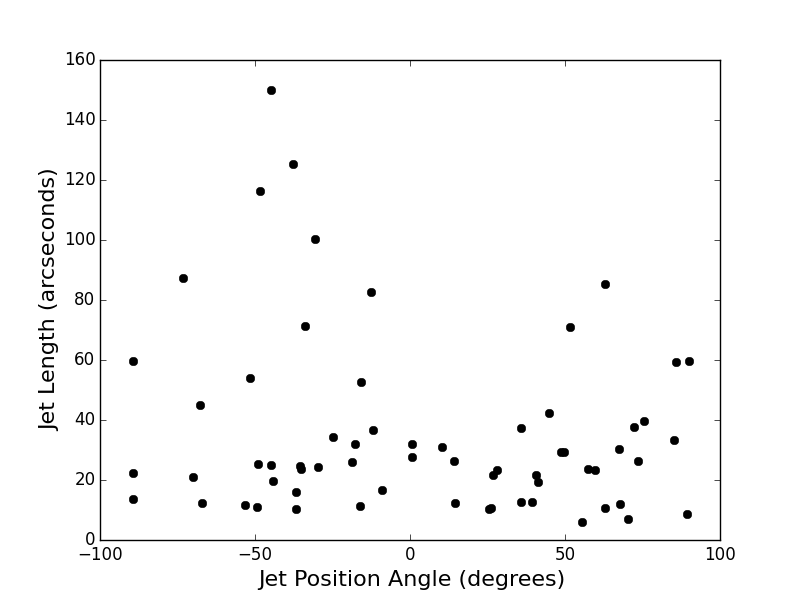
Figure 3 shows the distribution of positions angles of the jets. For 64 sources the expectation value per bin in the case of a uniform distribution is the same and equal to 3.55. For position angles greater than about 20∘, the distribution appears consistent with uniform value. However, on the other side of the distribution there is a strong peak from position angle, , -50∘ to -30∘, and a paucity of objects around 0∘ and with position angles less than -50∘.
Several of the objects in the excess between are apparent in Figure 2 as the larger jets. This effect is illustrated in Figure 4 which plots position angle versus jet length. The short jets (less than about 20′′) appear to have a more uniform position angle distribution. The longer jets appear clustered with a peak around .
A number of available non-parametric tests are applicable to determine the probability of deviation of an observed distribution given the null hypothesis that the position angles of the jets are uniformly (randomly) distributed. For the analysis of our data we used the CircStat (Jammalamadaka & Sengupta, 2001) & Circular (Agostinelli & Lund, 2013) statistical package in R.
The Rayleigh’s test of uniformity measures the significance of the mean resultant length, , compared to a uniform distribution with a statistically null mean resultant length. Since polarisation angle distributions are defined only on the half circle interval, to populate the full circle for the Rayleigh test we used the angle doubling technique to test against the null hypothesis of uniformity of the distribution of . The Rayleigh tests assumes the data are unimodal, i.e. there is at most one significant clustering of points around the circle. The mean resultant value of the observed angle distribution, , is 0.637, and the probability of this result from a parent random distribution is .
We also carried out two additional tests that examine the statistics of the differences between the observed and null hypothesis distributions. The Kuiper test gives a probability of random of . The Watson U2 test which is similar to the Kuiper test but uses the mean square deviations rather than the maximum deviations of the difference distributions gives a similar result. The results of all three tests are listed in Table 1.
3.3 Spatial Covariance of Position Angles
| Test | Statistic | P-value | Uniformity |
|---|---|---|---|
| Rayleigh’s Test | <0.001 | Non Uniform | |
| Kuiper’s Test | 4.1066 | < 0.01 | Non Uniform |
| Watson’s Test | 1.3819 | < 0.01 | Non Uniform |
Given that distribution of jet position angles is not random, it is of interest to explore the angular scale of the non-uniformity. One approach is to calculate the spatial semi-variance, or the variogram. In spatial statistics the variogram is a graphic describing the degree of spatial dependence of a vector field. The semi-variance function is defined as
| (4) |
Here the sum is over pairs of points separated by a distance from each other,and is the variable being measured at vector location . In the case of stationary and isotropic spatial process the semi-variance reduces to a spatial covariance function.
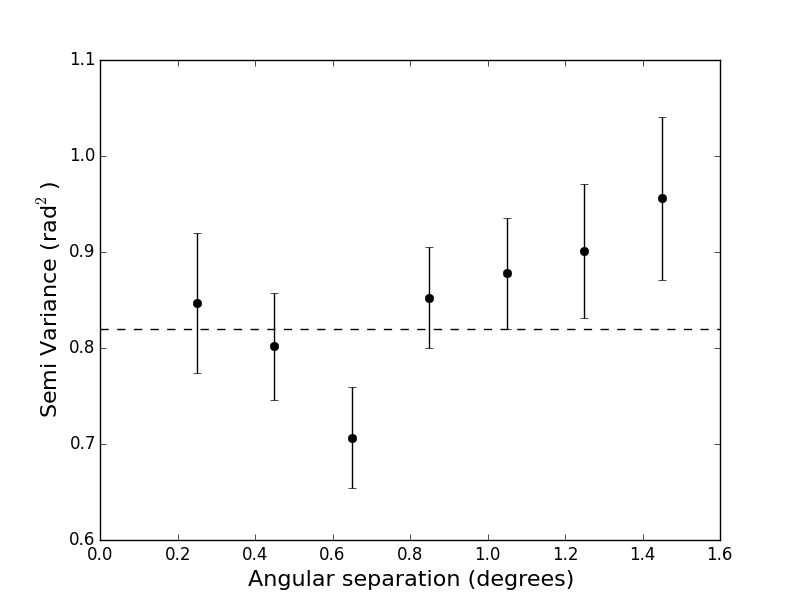
If the distribution of the position angles of the jets is random then the semi-variance should be constant over all angular scales. For a random distribution of angles the distribution of the differences of any two angles over a range symmetric about zero is a triangular distribution with a mean of zero. We carried out a simple Monte Carlo simulation by drawing a million pairs of random position angles over the range [-], and measuring the variance of the distribution of differences. The expectation value of for random angles is 0.82. This value is shown as the dotted line in the variogram for the observed jet position angles in Figure 5. The calculations of the semi-variance were carried out in R using the geoR tools (Jr & Diggle, 2001; Diggle & Jr, 2007). The error bars on the data points were determined from the number of pairs used to calculate the semi-variance in each angular separation bin. We carried out 10,000 simulations for each bin, in which we pulled pairs of random angles, where is to the number of observed pairs in the bin with separation . The error was taken as the standard deviation about the mean (0.82) of the 10,000 semi-variance values. There error bars are thus the error expected for a random distribution with the same number of pairs.
Angular scales that exhibit deviations from a value of 0.82 indicate a departure of the distribution of angle differences from random. Points that lie below the line indicate a smaller dispersion of angle differences compared to random, indicating an alignment of angles between sources. Points above the line have larger dispersion than expect from random, indicated a preference for large angular differences, or anti-alignment. One situation that gives rise to anti-alignment is the presence of two distinct populations of aligned objects separated by the angular scale in question. The low point in Figure 5 suggest an alignment of position angles on scales of about 0.5 to 0.8 degrees. This is consistent with the angular scale of the "filament" of aligned large jets. The indication of a rise of the semi-variance above 0.82 at larger angular scales tentatively suggests the presence of two areas of alignment separated by scales larger than . However at this scale we reach the limits of the dimension of the GMRT image. Imaging of a larger region to similar sensitivity will be required to explore potential spatial correlations on larger scales.
4 Discussion and Conclusion
The analysis of the probability and spatial distributions of radio galaxy jet position angles in ELAIS-N1 GMRT deep field indicates the presence of spatially correlated alignments on scales greater than about 0.5∘. ELAIS-N1 is one of the deep fields covered by the Spitzer Extragalactic Representative Volume Survey (SERVS) (Mauduit et al., 2012) photometric redshift catalogue. However only 6 SERVS objects with redshifts were matched to the radio galaxies, and none in the major alignment of objects around . We are thus unable to directly determine the redshift of the alignment feature. From photometric analysis of the UKIDSS data Swinbank et al. (2007) identified fifteen cluster candidates within a 0.8 square degrees region of ELAIS N1. Spectroscopic follow-up of five candidates showed significant over densities for all five candidates at . Swinbank et al. (2007) infer the presence of a supercluster at this redshift that extends over the entire field. The aligned radio galaxy jets may arise from AGN hosted by giant elliptical galaxies associated with components of the supercluster. At redshift of an angular scale of corresponds to co-moving physics scale of Mpc.
From analysis of optical polarisation position angles of 19 quasars belonging to a quasar group at , Hutsemékers et al. (2014) presented evidence of preferential alignment of the polarisation angles either parallel or perpendicular to the large scale structure in which they are embedded. The statistical probability that their result is due to random orientations is or order 1%. Our result provides independent confirmation of large-scale spatial alignment of AGN axes, with a tracer that is independent of propagation effects along the line of site.
The direction of radio galaxy jets is determined by the direction of the angular momentum axis of the super massive black hole that drives the AGN activity in the host galaxy. The observed jet alignment thus implies an alignment of the angular momentum axes of central black holes on scales of several 10’s of Mpc or greater. Such an alignment must arise at the time of formation and would imply spatially coherent angular momentum features of this scale embedded in the local large-scale structure at early times. It would be interesting to compare this implication with predictions of angular momentum structure from universe simulations.
Deep radio imaging, in combination with redshift surveys, offers a powerful means for studies of the alignment of radio galaxies jets to high redshift and the relation of the angular distribution of position angles to large scale structure. As shown in this study, at sensitivity of a few Jy about 100 radio galaxy jets per square degree are detected, and the sampling of the population of classical radio galaxies is virtually complete. The fainter population is dominated by star-forming galaxies and radio quiet AGN. Combining angular resolution of a few arc seconds with imaging areas of several square degrees will allow the spatial distribution of position angles on physical scales of 100’s of Mpc to high redshifts. Such imaging projects are in the planning stage for the Square Kilometre Array and its precursor telescopes, the South African MeerKAT array and the Australian SKA Pathfinder (ASKAP).
Acknowledgements
We thank the staff of the GMRT that made these observations possible. GMRT is run by the National Centre for Radio Astrophysics of the Tata Institute of Fundamental Research. PJ thanks the US National Radio Astronomy Observatory for providing support in the form of the Reber Doctoral Fellowship.
References
- Agostinelli & Lund (2013) Agostinelli C., Lund U., 2013, R package circular: Circular Statistics (version 0.4-7). CA: Department of Environmental Sciences, Informatics and Statistics, Ca’ Foscari University, Venice, Italy. UL: Department of Statistics, California Polytechnic State University, San Luis Obispo, California, USA, https://r-forge.r-project.org/projects/circular/
- Battye & Browne (2009) Battye R., Browne I., 2009, Monthly Notices of the Royal Astronomical Society, 399, 1888
- Diggle & Jr (2007) Diggle P. J., Jr P. J. R., 2007, Model Based Geostatistics. Springer, New York
- Fisher (1993) Fisher N. I., 1993, Statistical Analysis of Circular Data. Cambridge University Press, http://dx.doi.org/10.1017/CBO9780511564345
- Hawley & Peebles (1975) Hawley D. L., Peebles P. J. E., 1975, The Astronomical Journal, 80, 477
- Hutsemékers (1998) Hutsemékers D., 1998, Astronomy & Astrophysics, 332, 410
- Hutsemékers & Lamy (2001) Hutsemékers D., Lamy H., 2001, Astronomy & Astrophysics, 367, 381
- Hutsemékers et al. (2014) Hutsemékers D., Braibant L., Pelgrims V., Sluse D., 2014, A&A, 572, A18
- Jammalamadaka & Sengupta (2001) Jammalamadaka S., Sengupta A., 2001, Topics in Circular Statistics. Series on multivariate analysis, World Scientific
- Jr & Diggle (2001) Jr P. J. R., Diggle P. J., 2001, R-NEWS, 1, 14
- Mauduit et al. (2012) Mauduit J.-C., et al., 2012, PASP, 124, 1135
- Ratra (1992) Ratra B., 1992, The Astrophysical Journall, 391, L1
- Rusk (1990) Rusk R., 1990, Journal of the Royal Astronomical Society of Canada, 84, 199
- Stockman et al. (1979) Stockman H. S., Angel J. R. P., Miley G. K., 1979, The Astrophysical Journall, 227, L55
- Swinbank et al. (2007) Swinbank A. M., et al., 2007, MNRAS, 379, 1343