Ordering and order-disorder phase transition in the () monolayer chemisorbed on the (111) face of an fcc crystal††thanks: Dedicated to our friend Stefan Sokołowski on the occasion of his 65th birthday
Abstract
In this paper we have considered a simple lattice gas model of chemisorbed monolayer which allows for the harmonic fluctuations of the bond length between the adsorbate atom and the surface site. The model also involves a short-ranged attractive potential acting between the adsorbed atoms as well as the surface periodic corrugation potential. It has been assumed that the adsorbed atoms are bonded to the uppermost layer of the substrate atoms. In particular, using Monte Carlo simulation method we have focused on the orderings appearing in the dense monolayer formed on the (111) face of an fcc solid. Within the lattice gas limit, the chemisorbed layer forms a () structure. On the other hand, when the bonds are allowed to fluctuate, three other different ordered phases have been found to be stable in the ground state. One of them has been found to be stable at finite temperatures and to undergo a phase transition to the disordered state. The remaining two ordered states have been found to be stable in the ground state only. At finite temperatures, the ordering has been demonstrated to be destroyed due to large entropic effects.
Key words: chemisorption, phase transions, computer simulation, nanoscopic systems
PACS: 02.50.Ng, 05.70.Fh, 68.43.Hn, 65.80-g
Abstract
В цiй статтi ми розглянули просту модель граткового газу хемосорбованого моношару, яка дозволяє здiйснювати гармонiчнi флуктуацiї довжини зв’язку мiж атомами адсорбату та поверхнi. Дана модель мiстить короткосяжний потенцiал притягання, який дiє мiж адсорбованими атомами, а також поверхневий перiодичний гофрований потенцiал. Зроблено припущення, що адсорбованi атоми є зв’язанi з найвищим шаром атомiв пiдкладки. Зокрема, використовуючи метод моделювання Монте Карло, акцент зроблено на впорядкуванi у щiльному моношарi, сформованому на (111) гранi fcc кристалу. В границi граткового газу хемосорбований шар утворює () структуру. З iншого боку, коли наявнi флуктуацiї зв’язкiв, три iншi впорядкованi фази є стiйкими в основному станi. Встановлено, що одна з них є стiйкою при скiнчених температурах i переходить у невпорядкований стан. Двi iншi впорядкованi фази є стiйкими лише в основному станi. Показано, що при скiнчених температурах впорядкування руйнується завдяки сильним ентропiйним ефектам.
Ключовi слова: хемосорбцiя, фазовi переходи, комп’ютерне моделювання, наноскопiчнi системи
1 Introduction
The ever-growing technological importance of the on-demand tailored nanomaterials, makes it of great importance to understand and master their formation, structure and thermodynamics as well as electronic properties. Nanostructures of reduced geometry, like finite adsorbed islands, have become a field of intensive research in the last decades [1, 2, 3]. Owing to the development of powerful experimental methods, like the scanning tunneling microscopy (STM), it is now possible to study the inner structure of even small adsorbate clusters and to determine the arrangement of individual atoms within such nanoscopic islands [4, 5, 6, 7, 8].
Order-disorder phenomena in strongly adsorbed and chemisorbed monolayers have been a subject of active research for many years now [9, 10, 11, 12, 13, 14, 15, 16, 17, 18] and those studies have vastly relied on Monte Carlo simulations carried out in a general framework of lattice gas models [9, 10, 15].
At present, theoretical studies of chemisorption are usually based on ab initio quantum mechanical calculations, and employ various methods, like the density functional theory [19, 20, 21]. Although quantum mechanical calculations can be carried out only for rather small clusters, they nonetheless allow for a precise determination of interaction potentials and the structure of different ordered phases in chemisorbed layers. On the other hand, ab-initio approaches cannot be still efficiently used to study cooperative phenomena and phase transitions in particular. Such studies require rather large systems consisting of atoms and are beyond the reach of ab initio molecular dynamics [22, 23] and Car-Parrinello [24, 25] methods. Therefore, one has to use classical simulation methods with appropriately tuned interaction potentials [26, 27].
In the case of weakly adsorbed layers, made of simple gases (e.g., Ar, Kr, Xe, N2, CH4) on various solid substrates (e.g., graphite, boron nitride and metal crystals), the adsorbate-adsorbate and the adsorbate-substrate interactions can be quite well described by the Lennard-Jones potential [28, 29]. This potential does not properly describe the interactions operating in the systems involving metals and/or semiconductors. For metal-metal interactions, the embedded atom method (EAM) provides an approach allowing for the development of potentials with numerous applications in theoretical and computer simulation studies of single metals and metallic alloys [30, 31, 32, 33]. For covalently bonded systems, the potentials proposed by Stillinger and Weber [34, 35], by Tersoff [36, 37] and by Brenner [38] are often used.
In this work, we consider a simple lattice-like model of finite chemisorbed monolayer films that involves the pair adsorbate-adsorbate interaction, the harmonic potential that accounts for possible displacement of adsorbed atoms from the active centers to which the chemisorbed atoms are bonded, and the corrugation potential resulting from the lattice structure of the crystalline substrate [28, 39].
The idea of including translational degrees of freedom (elastic interaction) into lattice gas models is not new. Such models have been used to study the phase behavior and unmixing transition in Si-Ge alloys [40], Ising ferro- and antiferromagnets [41, 42, 43], adsorbed monolayers [44] and frustrated materials [45].
Although the results presented in this paper should be considered as preliminary and have been obtained for a very simple version of the model, nevertheless they show novel forms of ordering that may appear in chemisorbed layers.
The model can be readily extended to take into account three-body interactions, the possibility of the appearance of different types of active sites at the substrate surface, as well as different symmetry properties of both the adsorbing surface and the adsorbed layer. Thus, it holds promise of having predictive power for a broad range of questions.
2 The model
We assume that the potential representing the pair interaction between adsorbate atoms takes the following form:
| (1) |
i.e., it is a standard Lennard-Jones (12,6) potential supplemented by the cut-off function, with being the parameter determining the range of interaction. Equation (1) can be treated as a special case of the pair interaction term that appears in the Stillinger-Weber potential [34].
We also assume that all adsorbed atoms are bonded to adsorption centers, which form a two-dimensional lattice of the symmetry imposed by the substrate structure. Throughout this work, we have considered the surface lattice of triangular symmetry and have taken the surface lattice constant as a unit of length. A further assumption is that so that all lattice sites are accessible to adsorption. In this work, we are not interested in the adsorption process but only in the structure and properties of films in which all sites are occupied by the adsorbed atoms. Thus, each surface site, located at , is occupied by an adatom. Nonetheless, the bonds between adatoms and surface sites have been assumed not to be completely rigid, but permitted to undergo small harmonic deformations. Therefore, the adatom energy changes with the displacement from the lattice site, , as follows:
| (2) |
where is the force constant of the harmonic potential.
In what follows we use the reduced units. All the energy-like parameters are given in units of , e.g., the potential energy is given as and the force constant is given by . All the distances are given in units of the surface lattice constant . Thus, , and .
Due to the lattice nature of the crystalline surface, the surface potential experienced by adatoms exhibits periodic variations and can be expressed as follows:
| (3) |
In the above, determines the amplitude of the corrugation potential and the sum runs over the reciprocal lattice vectors of the surface lattice ().
When , the interaction energy of the pair of atoms adsorbed over the neighboring sites depends only upon their distance , and the displacements , () of both interacting atoms should be the same with the displacement vectors .
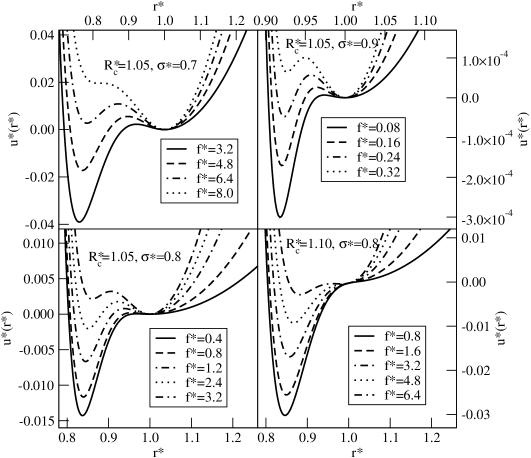
Figure 1 gives some examples of the pair interaction potential, being the sum of and , obtained for different sets of the parameters: , and . Due to the addition of a harmonic term, the pair interaction energy becomes positive for large and possibly exhibits two minima. It should be emphasized that the pair interaction potential is qualitatively very similar to that obtained from ab initio quantum mechanical calculations obtained for Pb adsorbed on Si within the generalized gradient approximation (GGA) [46].
Here, we assume that the adsorbed layer has been formed on the (111) face of a perfect fcc crystal and forms a simple () structure when the bonds are strictly rigid ().
3 The ground state behavior
The ground state behavior of the model depends on the assumed lattice symmetry, the pair potential cutoff distance (), the diameter of adatoms (), the value of the force constant , and the amplitude of the surface potential .
The first series of calculations aiming at the determination of stable ground state structures has been performed for the systems without the corrugation potential (), assuming that and , and using finite clusters of different size and shape. The calculations have been carried out over a wide range of between 0.4 and 3.0. Four different ordered structures, depicted in figure 2, have been found. The stability of each of them is determined by the magnitude of the force constant . Figure 3 shows the ground state phase diagram obtained for the systems with and and different values of .
In order to determine the structure of the system in the ground state, we have calculated the energy for all possible structures as a function of the displacement. Of course, the structure corresponds to zero displacement. The energy of the structures S and T is characterized by a single displacement, while the energy of the structure R is determined by two displacements in two orthogonal directions along the diagonals of the rhombus. The stable state of a system is the one in which the energy reaches its minimum. We have determined the displacements that minimize the energy for each structure, as well as determined which of the structures is stable for a given set of parameters.
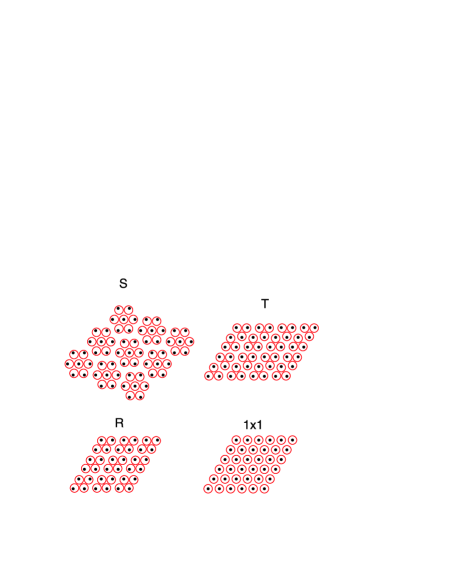

For sufficiently high values of (, a simple structure is a stable state. In this case, the adatoms are not displaced from the positions of adsorption centers, i.e., the average displacement is equal to zero. When decreases, the adatoms exhibit a gradually increasing tendency to be displaced from the positions given by the vectors and this leads to the formation of the structures T, R and S, depicted in figure 2. The structure T consists of equilateral triangles of adatoms arranged in such a way that each adatom has a displacement from the surface lattice site of the same length. Of course, the magnitude of this displacement gradually increases when becomes lower (see the inset to figure 3). The structure T is stable as long as stays between and . The structure R develops for the lower values of , between and . In this structure, the groups of four adatoms form rhombic clusters, characterized by two different displacements of adatoms from the surface lattice (along the diagonals). In perfectly ordered T and R states, the unit cell vectors are aligned with the symmetry axes of the triangular lattice. When falls below , the structure labeled as S (star-like) becomes stable. This structure consists of clusters made of seven atoms each and arranged in such a way that the central atom is not displaced from the adsorption site, while its six nearest neighbors are equally displaced towards the central atom. The central atoms form a lattice rotated by with respect to the original triangular lattice of adsorption sites. Of course, in the R and S structures, the atomic displacements also gradually increase when the force constant becomes lower, just the same as in the case of T structure. For the values of well below , the tendency of adatoms to be displaced from lattice sites becomes high enough to lead to the formation of structures consisting of clusters larger than in the S structure and this point will be addressed later on in section 5. Of course, when approaches zero, the entire adsorbed island forms a close packed triangular lattice, but in the case of chemisorption, this situation can be excluded from consideration.

It should be noted that although our ground state calculations have been carried out for finite systems, the results have not been affected by finite size effects. The assumed range of the interaction potential [equation (1)] is very short, and due to rather large displacements of adatoms from lattice sites, the system energy in the ground state is not influenced by the presence of free boundaries. For the potentials with a longer interaction range, given by , finite size effects become of importance. In such systems, the stability regions of different ordered states are also affected by finite size and boundary effects. The change of the interaction range affects the strength of the pair potential, cf. the lower panels of figure 1, and hence the values of that delimit the regions of stability of different ordered states. This is illustrated by the results given in figure 4. The results show that the T structure exists only for rather short-ranged potentials with lower than about 1.139, while the R and S structures are stable even for the potentials of a longer range. However, with the increase of , the results are subjected to gradually increasing finite size effects. The ground state calculations for the clusters of perfectly ordered S structure and of different size have shown that for , the S structure occurs only in finite clusters. Upon the increase of the cluster size, the displacement of adatoms corresponding to the minimum of potential energy () goes to zero. The ground state properties of the model also depend upon the value of . Of course, for , at which the minimum of the potential occurs at the distance approaching , only the ( structure is stable. Upon the decrease of , the location of the potential minimum shifts towards shorter distances between the interacting atoms (cf. figure 1) allowing for rather large atomic displacements. This gives rise to the appearance of S, R and T structures. We have performed ground state calculations for a fixed value of and for different between 0.65 and 0.87. The results of the calculations are summarized in the inset to figure 4. It appears that the R structure occurs only for larger than about 0.68. For still smaller atoms, only the S, T and () structures are stable in the ground state. Due to the lowering of , the energy of the pair interaction increases so that for a given the adatoms are more likely to exhibit larger displacements from the lattice sites. This explains why the values of , and increase when becomes lower.
In the case of an (111) fcc surface considered here, the effects of the corrugation potential on the ground state properties can be readily anticipated. The adsorption centers are located right above the surface atoms, i.e., over the maxima of the external field, and the atomic displacements in all S, R and T structures are directed towards the positions of a lower surface potential . Therefore, an increase of the corrugation potential amplitude () has the same effect as the lowering of the force constant (). In fact, the calculations performed have demonstrated that the values of , and linearly increase with as follows:
| (4) |
with being S–R, R–T or , and the magnitude of the constant depending only upon and . In other words, due to the turning on of the corrugation potential at zero temperature (), the limits of stability of all differently ordered structures uniformly shift towards higher values of .
4 Monte Carlo simulation method
The above presented model has been studied using a standard Metropolis Monte Carlo simulation method in the canonical ensemble [47]. We have monitored the system energy and the contributions to the energy due to the pair interaction represented by the potential [], the harmonic interaction [] and due to the corrugation potential []. Furthermore, we have calculated the heat capacity from the energy fluctuations.
In order to monitor the formation of the ordered structures, we have calculated the probability distribution of atomic displacements and the probability distribution of the number of nearest neighbors . Since all surface lattice sites are covered by adatoms, we have assumed that the nearest neighbors are only those atoms located on the nearest adsorption sites with the inter-atomic distance smaller than unity. Thus, only the atoms displaced from lattice sites have been counted.
In the case of the ordered T structure, the distribution should be unimodal and should be close to unity for , while approaching zero for other values of . The structure S should give bimodal distribution ; with one maximum at (for the central atoms) and the second maximum at larger value of (for the nearest neighbors of the central atom). The distribution should be equal to about 1/7 for , about 6/7 for and approach zero for other values of . Finally, the structure R should also be characterized by bimodal distribution with the maxima at the positions corresponding to the two displacements in the rhombus, while the distribution should approach the value of 0.5 for and 3 and should be approximately zero for other values of .
The calculations have been performed using two different shapes of the simulation box. One series of calculations has been carried out using simple rhombic cells oriented along the symmetry axes of the triangular lattice and of different side length, (labeled as R-cells). Note that the ordered structures T and R require even values of to accommodate them within the cell. In the case of the ordered structure S, we have also used rhombic simulation cells, but appropriately rotated and of the side length adjusted to accommodate the S structure (labeled as S-cells).
5 Results and discussion
The primary goal here has been to study the mechanism of disordering of the structures S, R and T. Under the assumption of strong bonding between adatoms and surface sites, the desorption has been prohibited so that the disordering can only involve the destruction of the order specific to S, R and T structures. We have performed Monte Carlo simulations for several systems using finite R- and S-cells of different size. Taking into account that one of our goals was to study truly nanoscopic systems, we have not applied periodic boundary conditions.
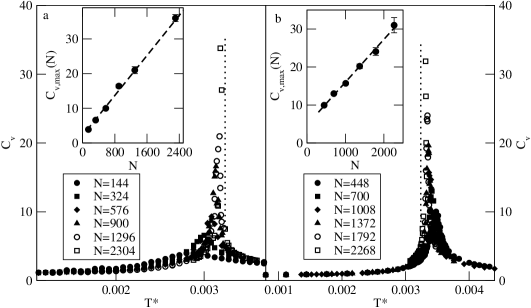
At first, we have considered the systems with and and the values of for which the ordered S structure is stable in the ground state, i.e., with . Parts (a) and (b) of figure 5 show the heat capacity curves obtained for the system with . Part (a) of figure 5 gives the results obtained using the R-cells of different size, while part (b) gives the results obtained for finite S-cells, also of different size. Both series of calculations have demonstrated that the heat capacity exhibits sharp maxima of the height and location depending upon the system size, indicating the presence of a phase transition. The insets to parts (a) and (b) clearly show that the maximum value of the heat capacity changes linearly with the number of atoms in the system , i.e., with the system volume, since all lattice sites are occupied by the adsorbate atoms. According to the finite-size scaling theory of phase transitions [47, 48], this sort of behavior is characteristic of the first order transition. The theory also predicts the transition temperature in finite systems to be shifted with respect to the transition temperature in the infinite system, , and the following relation should hold:
| (5) |
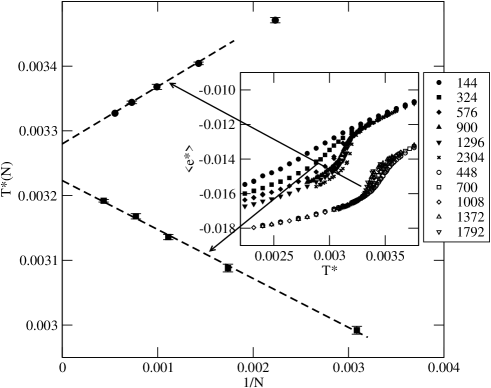
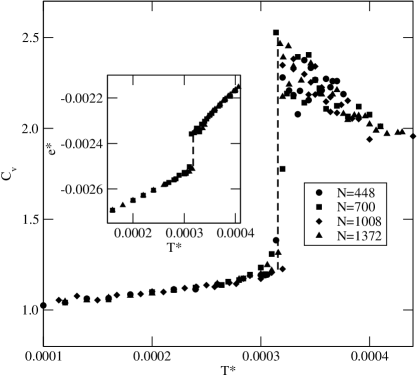
where the constant is proportional to with and being the internal energies of the coexisting phases at and , respectively [49]. The difference is positive and hence the temperature should increase with . This does occur when the S-cells accommodating the ordered S structure are used (see figure 6). On the other hand, the temperature decreases with when the R-cells are used. In this case, the ordering is not perfect. The regions close to the island boundaries do not show the ordering characteristic of the S structure, even at very low temperatures. At higher temperatures, the disorder easily propagates into the system interior and considerably affects the estimated transition temperature. Of course, these effects of propagated disorder gradually decrease when the simulation cell size becomes larger, so that the transition temperature gradually increases with the system size. This is very well illustrated by the curves showing the changes of the system energy with temperature and obtained for different system sizes (see the inset to figure 6). In the case of simulation with S-cells, the energy at low and high temperatures does not depend upon the system size at all. Only at the temperatures close to the phase transition, the size effects set in. In fact, the results obtained from the runs with and without periodic boundary conditions applied have given the same results. On the other hand, the energy curves obtained for R-cells demonstrate large finite size effects already at low temperatures. This is a consequence of the already mentioned disordering close to the island boundaries. Therefore, only the simulation with S-cells gives the correct results and the estimated transition temperature is equal to about 0.00328.
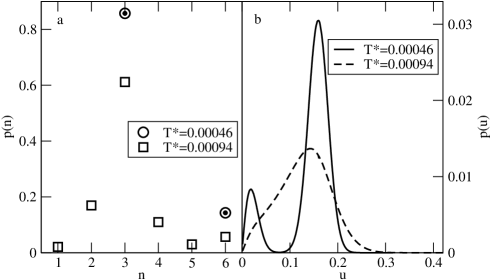
The nature of the transition becomes quite clear when one considers the behavior of the probability distributions and given in figure 7. The distributions recorded below the transition temperature show a perfect ordering into the S structure, while those obtained at the temperatures above the transition point indicate that the disordering leads to the destruction of the S structure. In particular, the distribution looses its bimodal shape and the distribution shows quite large contributions due to different numbers of nearest-neighbors, other than 3 or 6.
We have carried out simulations for a series of systems with different values of the force constant, , and estimated the transition temperatures. The results of our calculations have been summarized in figure 8, which illustrates the changes of with . As expected, the transition temperature () gradually decreases towards zero when grows towards ,

The log–log plot of versus (given in the inset to figure 8) demonstrates that there are three regions of over which the system exhibits different behavior. For small values of , i.e., for the values of close to , the first-order character of the transition becomes more pronounced, for example when , and 0.8 the behavior of the heat capacity and of the potential energy is different than in the previously discussed case of , as well as for other values of up to 0.64. Both quantities exhibit discontinuities at the transition temperature (see figure 9) without showing any systematic finite size effects.
For intermediate values of between about 0.64 and 1.6, the transition is only weakly first-order and exhibits the behavior already described while discussing the system with .
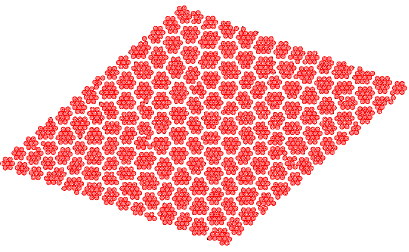
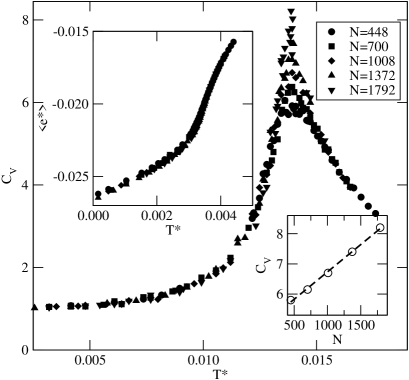
For sufficiently large , i.e., for sufficiently small , the structure of adsorbed layer changes, since adatoms enjoy much more freedom to displace from the surface lattice sites. Consequently, the attractive pair potential wins over the harmonic forces and enhances the tendency towards clustering. Hence, adatoms group into lager clusters than those in the S structure. This is well illustrated by the snapshot given in figure 10, recorded at for the system with and consisting of 1792 atoms. One can see that these clusters may contain a variable number of atoms and be of different shape. We have studied this system using R- and S-cells with periodic boundary conditions applied. The heat capacity and potential energy curves obtained for systems of different size have demonstrated (see figure 11) that the disordering occurs over a rather narrow temperature range, though the transition region is considerably smeared and the heat capacities obtained for systems of rather large size do not reach such high values as observed in the systems ordering into the S structure. Nonetheless, the heat capacity maxima increases linearly with , suggesting that the system undergoes a weakly first-order phase transition. The transition occurs between the structure consisting of a large number of small clusters and the disordered state with more-or-less uniform distribution of atoms.
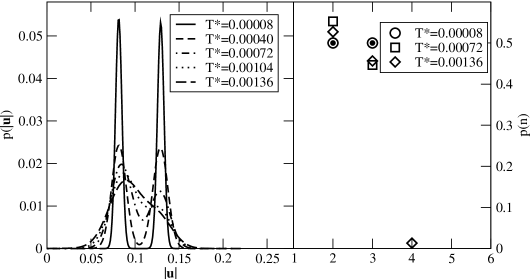
As soon as the value of the force constant becomes higher than , the systems are expected to order into the R structure at low temperatures. The simulation has demonstrated that this does occur. Figure 12 presents the examples of distribution functions and obtained at different temperatures for the system with . It is well seen that only at very low temperatures does the ordering into the R structure occur. Upon an increase of temperature, the bimodal distribution gets distorted and then disappears at all. This is accompanied by the changes in the distribution . In particular, the probability for an atom to have two nearest neighbors increases while the probability of having three nearest neighbors decreases. This indicates that triangular clusters made of three atoms appear at elevated temperatures. This has been confirmed by the inspection of snapshots, which demonstrated the formation of isolated triangles, as well as a loss of alignment of rhombic clusters. In particular, the triangles have been observed to appear close to the regions containing differently oriented rhombic clusters. Upon an increase of temperature, the degree of disordering also gradually increases. The heat capacity and potential energy curves (not shown here) have clearly demonstrated that the R structure disorders continuously and does not undergo any order-disorder phase transition. In particular, neither the potential energy nor the heat capacity show any finite size effects. In a perfectly ordered R phase, all rhombic clusters made of four atoms each are aligned as shown in figure 2. Our simulation has shown that this alignment is destroyed as soon as the temperature is raised above 0. The energy cost associated with changing the orientations of rhombic clusters and the formation of isolated triangles is very low, while the entropic effects are very large and destroy the alignment completely.
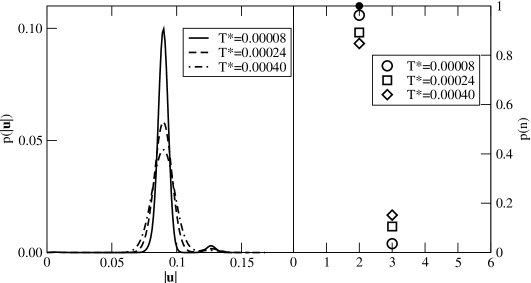
Qualitatively similar results have been obtained for the systems characterized by the values of higher than , i.e., when the ordering into the T structure occurs in the ground state. Similarly to the R structure, the disordering of the T structure gradually occurs and is accompanied by the loss of alignment of triangular clusters and by the appearance of rhombic clusters at nonzero temperatures. In fact, already the simulation performed at a very low temperature of and using the starting configuration being a perfect T structure has demonstrated a certain degree of disordering. Figure 13 shows the probability distributions and recorded at very low temperatures that demonstrate the above mentioned partial disordering. In particular, the distribution exhibits a small second maximum at large displacements and the distribution shows a non-zero probability of an atom to have three nearest neighbors already at .
We have also performed calculations for the systems with higher potential cutoff, with , as well as for the systems with different size of adsorbed atoms, with and 0.7, but apart from the obvious quantitative differences resulting from the changes in the pair potential properties, the results have been qualitatively the same as for the above discussed systems.

As already discussed in section 3, the corrugation potential is not expected to lead to important qualitative changes in the behavior of the systems considered here. Indeed, our calculations carried out for several systems have shown that the increase of is somehow equivalent to the decrease of . It has been already shown that for and the values of corresponding to the stability region of the S structure, a gradual decrease of leads to an increase of the order-disorder transition temperature (cf. figure 8) and the stability of the structure lowers only for sufficiently low values of . Thus, one expects that for a fixed value of , an increase of the corrugation potential amplitude () should also lead to a gradual increase of the transition temperature. The calculations carried out for finite clusters consisting of 700 atoms with , , different values of between and and for several values of have demonstrated a gradual increase of the transition temperature over a certain range of (see figure 14). However, when the amplitude becomes high enough, the transition temperature decreases rather sharply. This behavior is quite similar to the one observed for the systems without the corrugation potential and sufficiently low values of .
It is interesting to note that in the case of , for which a uniform system ( orders into the R structure in the ground state, the S structure appears to be stable when exceeds a certain threshold value (marked by a vertical dashed line in figure 14). This clearly shows that an increase of is equivalent to the decrease of .
Taking into account the properties of the corrugation potential generated over the (111) face of an fcc crystal, one expects the 7-atom clusters constituting the S structure to be slightly rotated around the central atom. This rotation should result from the fact that the displacement vectors in the uniform case are not directed towards the surface potential minima, but rather towards the saddle points. The rotation of the entire cluster does not cost any energy of the pair interaction, but affects the harmonic and surface interactions. The harmonic interaction hinders the cluster rotation, so that nonzero rotational angles may occur only when the energy gain due to the corrugation potential is high enough. The ground state calculations for the systems characterized by rather low have shown, however, that even for the amplitude of the surface potential well above the upper limit of the S structure stability and equal to about 0.0062, the cluster rotation does not occur. The rotation of a single 7-atom cluster has been found to be present only when exceeds the value of about 0.0364 (see figure 15). In the case of large systems consisting of many clusters, the clusters consisting of more than 7 atoms begin to develop already for larger than about 0.0062.

6 Final remarks
In this paper, we have discussed the ordering appearing in dense chemisorbed monolayer films formed on the (111) fcc lattice. It has been demonstrated that when the pair potential is short ranged and the bonds between the chemisorbed atoms and the surface atoms are not rigid, the film may form different ordered phases. The ordering strongly depends upon the elasticity of the bonds. When the bonds are very stiff, the film orders into a simple phase. Upon a decrease of the bond stiffness, the adatoms exhibit a gradually increasing tendency to be displaced from surface sites. Since the pair potential is attractive at small distances, the adatoms tend to form small clusters. In the ground state, we have found the ordered states in which such clusters consist of three (T), four (R) and seven (S) atoms (R) (cf. figure 2).
The structures T and R have been demonstrated to be stable only in the ground state. At finite temperatures, large entropic effects destroy the orderings. On the other hand, the structure S has been found to be stable at finite temperatures. Our Monte Carlo simulation results, supported by finite-size scaling analysis, have shown that the S phase is disordered via the first-order transition. The transition temperature depends on the bond elasticity.
For sufficiently low values of the harmonic potential force constant, the adatoms enjoy a rather large freedom to displace from adsorption sites and tend to form still larger clusters.
Although the model considered here is very simple, nevertheless it exhibits interesting physics, novel phase behavior and new types of ordering. In this work, we have considered only the case of a fully filled triangular lattice, but the model can be also used to study the orderings on the surfaces of different symmetry of adsorption sites. It can be also readily extended to take into account three body forces [34] and orientation-dependent interactions [50].
Monte Carlo methods can be also used to study the adsorption processes and possible different orderings appearing for lower coverages. This requires simulations in the grand canonical ensemble, commonly used in the studies of adsorption phenomena [14].
References
-
[1]
Springer Handbook of Nanotechnology, 3rd Edn., Bhushan B. (Ed.), Springer, Heidelberg, 2010;
doi:10.1007/978-3-642-02525-9. - [2] Einax M., Dieterich W., Maass P., Rev. Mod. Phys., 2013, 85, 921; doi:10.1103/RevModPhys.85.921.
- [3] Tegenkamp C., J. Phys.: Condens. Matter, 2009, 21, 013002; doi:10.1088/0953-8984/21/1/013002.
- [4] Equilibrium Structure and Properties of Surfaces and Interfaces, NATO ASI Series, Series B, Vol. 300, Gonis A., Stock G.M. (Eds.), Plenum Press, New York, 1992; doi:10.1007/978-1-4615-3394-8.
- [5] Custance O., Gómez-Rodríguez J.M., Baró A.M., Juré L., Mallet P., Veuillen J.-Y., Surf. Sci., 2001, 482–485, 1399; doi:10.1016/S0039-6028(01)00774-9.
-
[6]
Stepanovsky S., Yakes M., Yeh V., Hupalo M., Tringides M.C., Surf. Sci., 2006, 600, 1417;
doi:10.1016/j.susc.2005.12.041. -
[7]
Hwang I.-S., Chang S.-H., Fang C.-K., Chen L.-J., Tsong T.T., Phys. Rev. Lett., 2004, 93, 106101;
doi:10.1103/PhysRevLett.93.106101. - [8] Chen Q., Liu J., Zhou X., Shang J., Zhang Y., Shao X., Wang Y., Li J., Chen W., Xu G., Wu K., J. Phys. Chem. C, 2015, 119, 8626; doi:10.1021/jp5117432.
- [9] Ching W.Y., Huber D.L., Wang G.-C., Lagally M.G., Surf. Sci., 1978, 77, 550; doi:10.1016/0039-6028(78)90140-1.
- [10] Williams E.D., Cunningham S.L., Weinberg W.H., J. Chem. Phys., 1978, 68, 4688; doi:10.1063/1.435579.
- [11] Ordering in Two-Dimensions, Sinha S.K. (Ed.), North-Holland, Amsterdam, 1980.
- [12] Phase Transitions in Surface Films, NATO ASI Series, Series B, Vol. 51, Dash J.G., Ruvalds R. (Eds.), Plenum, New York, 1980; doi:10.1007/978-1-4613-3057-8.
- [13] Bak P., Rep. Prog. Phys., 1982, 45, 587; doi:10.1088/0034-4885/45/6/001.
- [14] Patrykiejew A., Sokołowski S., Binder K., Surf. Sci. Rep., 2000, 37, 207; doi:10.1016/S0167-5729(99)00011-4.
- [15] Chakarova R., Oner D.E., Zoric I., Kasemo B., Surf. Sci., 2001, 472, 63; doi:10.1016/S0039-6028(00)00923-7.
- [16] Roelofs L.D., Cortan A.R., Einstein T.L., Park R.L., J. Vac. Sci. Technol., 1981, 18, 492; doi:10.1116/1.570774.
- [17] Einstein T.L., Langmuir, 1991, 7, 2520; doi:10.1021/la00059a021.
- [18] Tarasenko A.A., Nieto F., Pereyra V., Uebing C., Surf. Sci., 1999, 441, 329; doi:10.1016/S0039-6028(99)00798-0.
- [19] Kohn W., Sham L., Phys. Rev., 1965, 140, A1133; doi:10.1103/PhysRev.140.A1133.
- [20] Ying S.C., Smith J.R., Kohn W., Phys. Rev. B, 1975, 11, 1483; doi:10.1103/PhysRevB.11.1483.
- [21] Su Z., Lu X., Zhang Q., Chem. Phys. Lett., 2003, 375, 106; doi:10.1016/S0009-2614(03)00841-8.
- [22] Kresse G., Hafner J., Phys. Rev. B, 1993, 47, 558; doi:10.1103/PhysRevB.47.558.
- [23] Kresse G., Hafner J., Phys. Rev. B, 1994, 49, 14251; doi:10.1103/PhysRevB.49.14251.
- [24] Car R., Parrinello M., Phys. Rev. Lett., 1985, 55, 2471; doi:10.1103/PhysRevLett.55.2471.
- [25] Izvekov S., Philpott M.R., Eglitis R.I., J. Electrochem. Soc., 2000, 147, 2273; doi:10.1149/1.1393520.
- [26] Gómez L., Diep H.T., Phys. Rev. Lett., 1995, 74, 1807; doi:10.1103/PhysRevLett.74.1807.
- [27] Pinto O.A., López de Mishima B., Dávila M., Ramirez-Pastor A.J., Leiva E.P.M., Oviedo O.A., Phys. Rev. E, 2013, 88, 062407; doi:10.1103/PhysRevE.88.062407.
- [28] Steele W.A., The Interaction of Gases with Solid Surfaces, Pergamon Press, Oxford, 1974.
- [29] Bruch L.W., Cole M.W., Zaremba E., Physical Adsorption: Forces and Phenomena, Clarendon Press, Oxford, 1997.
- [30] Daw M.S., Baskes M.I., Phys. Rev. B, 1984, 29, 6443; doi:10.1103/PhysRevB.29.6443.
- [31] Foiles S.M., Phys. Rev. B, 1985, 32, 3409; doi:10.1103/PhysRevB.32.3409.
- [32] Johnson R.A., Phys. Rev. B, 1988, 37, 3924; doi:10.1103/PhysRevB.37.3924.
- [33] Lee B.J., Baskes M.I., Phys. Rev. B, 2000, 62, 8564; doi:10.1103/PhysRevB.62.8564.
- [34] Stillinger F.H., Weber T.A., Phys. Rev. B, 1985, 31, 5262; doi:10.1103/PhysRevB.31.5262.
- [35] Ding K., Andersen H.C., Phys. Rev. B, 1986, 34, 6987; doi:10.1103/PhysRevB.34.6987.
- [36] Tersoff J., Phys. Rev. Lett., 1988, 61, 2879; doi:10.1103/PhysRevLett.61.2879.
- [37] Tersoff J., Phys. Rev. B, 1988, 37, 6991; doi:10.1103/PhysRevB.37.6991.
- [38] Brenner W.D., Phys. Rev. B, 1990, 42, 9458; doi:10.1103/PhysRevB.42.9458.
- [39] Steele W.A., Surf. Sci., 1973, 36, 317; doi:10.1016/0039-6028(73)90264-1.
- [40] Dünweg B., Landau D.P., Phys. Rev. B, 1993, 48, 14182; doi:10.1103/PhysRevB.48.14182.
- [41] Tavazza F., Landau D.P., Adler J., Phys. Rev. B, 2004, 70, 184103; doi:10.1103/PhysRevB.70.184103.
- [42] Cannavacciuolo L., Landau D.P., Phys. Rev. B, 2005, 71, 134104; doi:10.1103/PhysRevB.71.134104.
- [43] Zhu X., Tavazza F., Landau D.P., Phys. Rev. B, 2005, 72, 104102; doi:10.1103/PhysRevB.72.104102.
- [44] Presber M., Dünweg B., Landau D.P., Phys. Rev. E, 1998, 58, 2616; doi:10.1103/PhysRevE.58.2616.
- [45] Shokef Y., Souslov A., Lubensky T.C., Proc. Natl. Acad. Sci. USA, 2011, 108, 11804; doi:10.1073/pnas.1014915108.
- [46] Cudazzo P., Profeta G., Continenza A., Surf. Sci., 2008, 602, 747; doi:10.1016/j.susc.2007.12.001.
- [47] Landau D.P., Binder K., A Guide to Monte Carlo Simulation in Statistical Physics, Cambridge University Press, Cambridge, 2000.
- [48] Finite Size Scaling and Numerical Simulation of Statistical Systems, Privman V. (Ed.), World Scientific, Singapore, 1990.
- [49] Binder K., Rep. Prog. Phys., 1987, 50, 783; doi:10.1088/0034-4885/50/7/001.
- [50] Dongare A.M., Neurock M., Zhigilei V., Phys. Rev. B, 2009, 80, 184106; doi:10.1103/PhysRevB.80.184106.
Ukrainian \adddialect\l@ukrainian0 \l@ukrainian
Впорядкування i фазовий перехiд порядок-безлад у () моношарi, хемосорбованому на гранi (111) fcc кристалу А. Патрикєєв, Т. Сташевський
Вiддiл моделювання фiзико-хiмiчних процесiв, Унiверситет Марiї Кюрi-Склодовської, Люблiн, Польща