High-resolution spectroscopy of a young, low-metallicity optically-thin star-forming galaxy at $\dagger$$\dagger$affiliation: Based on observations collected at the European Southern Observatory for Astronomical research in the Southern Hemisphere under ESO programmes P095.A-0840, P095.A-0653, P186.A-0798.
Abstract
We present VLT/X-Shooter and MUSE spectroscopy of an faint F814W= (), low mass () and compact (pc) freshly star-forming galaxy at magnified () by the Hubble Frontier Fields galaxy cluster Abell S1063. Gravitational lensing allows for a significant jump toward low-luminosity regimes, in moderately high resolution spectroscopy (). We measured Civ, Heii, Oiii], Ciii], H, [O iii], emission lines with km s-1 and (de-lensed) fluxes spanning the interval at S/N=4-30. The double peaked Ly emission with () km s-1 and de-lensed fluxes (S/N=) indicate a low column density of neutral hydrogen gas consistent with a highly ionized interstellar medium as also inferred from the large [Oiii]/ [Oii] ratio. We detect Civ resonant doublet in emission, each component with km s-1, and redshifted by () km s-1 relative to the systemic redshift. We interpret this as nebular emission tracing an expanding optically-thin interstellar medium. Both Civ and Heii suggest the presence of hot and massive stars (with a possible faint AGN). The ultraviolet slope is remarkably blue, (), consistent with a dust-free and young 20 Myr galaxy. Line ratios suggest an oxygen abundance 12+log(O/H). We are witnessing an early episode of star-formation in which a relatively low and negligible dust attenuation might favor a leakage of ionizing radiation. This galaxy currently represents a unique low-luminosity reference object for future studies of the reionization epoch with JWST.
Subject headings:
cosmology: observations — galaxies: formation1. Introduction
The epoch of reionization marks a major phase transition of the Universe, during which the intergalactic space became transparent to UV photons. Determining when this occurred, the physical processes involved and the sources of ionizing radiation represents one of the major goals in observational cosmology. The production of ionizing radiation is most probably driven by star formation and/or nuclear activity, but their relative contribution to the ionizing background is still matter of debate (e.g., Fontanot et al., 2014). Irrespective of the nature of ionizing radiation, the general consensus is that the faint sources are the main producers of the ionizing background at high redshift (Wise et al. 2014; Kimm & Cen 2014; Madau & Haardt 2015, but see Sharma et al. 2016). This implicitly assumes that a not-negligible fraction of ionizing photons is not trapped in faint sources and escapes. It is therefore important to push observations toward low luminosity regimes (), to investigate the nature of ionizing radiation and the opacity at the Lyman continuum (LyC, Å). Furthermore, high-ionization and narrow atomic transitions (like Civ, Heii, Ciii]) recently identified at and raised intriguing questions about the presence of hot and massive stars and/or faint nuclear activity (e.g., Stark et al., 2014, 2015a) and/or possibly extreme stellar populations (Sobral et al., 2015). Also the large [Oiii] rest-frame equivalent width (Å) and [Oiii]/ [Oii] ratio () recently observed in relatively bright () LyC emitting galaxies is opening promising prospects for the characterization of reionizing sources at (de Barros et al., 2016; Vanzella et al., 2016; Nakajima & Ouchi, 2014; Jaskot & Oey, 2013; Izotov et al., 2016). A subsequent step is to extend this study to fainter luminosity regimes. Here we push observations to unprecedented luminosities limits (, or F814W) and ask the questions: what is the nature of the ionizing radiation at very faint luminosity/mass domain? Are faint sources optically thin at the LyC as expected if they dominate reionization? Here a detailed study of a faint galaxy is presented, taking advantage of multi-wavelength photometry available from CLASH (Postman et al., 2012) and Hubble Frontier Fields (HFF) projects (Lotz et al., 2014; Koekemoer et al., 2014)111http://www.stsci.edu/hst/campaigns/frontier-fields/ and from low and medium resolution spectroscopy we obtained at VLT (VIMOS, MUSE and X-Shooter).
2. Target selection, magnification and X-Shooter observations
The source ID11 has been selected among a sample of Ly emitters identified with four hours integration with MUSE behind the HFF galaxy cluster AS1063 (or RXJ2248, see Karman et al. (2015), K15 hereafter) and previously detected with VLT/VIMOS low resolution spectroscopy () by Balestra et al. (2013).
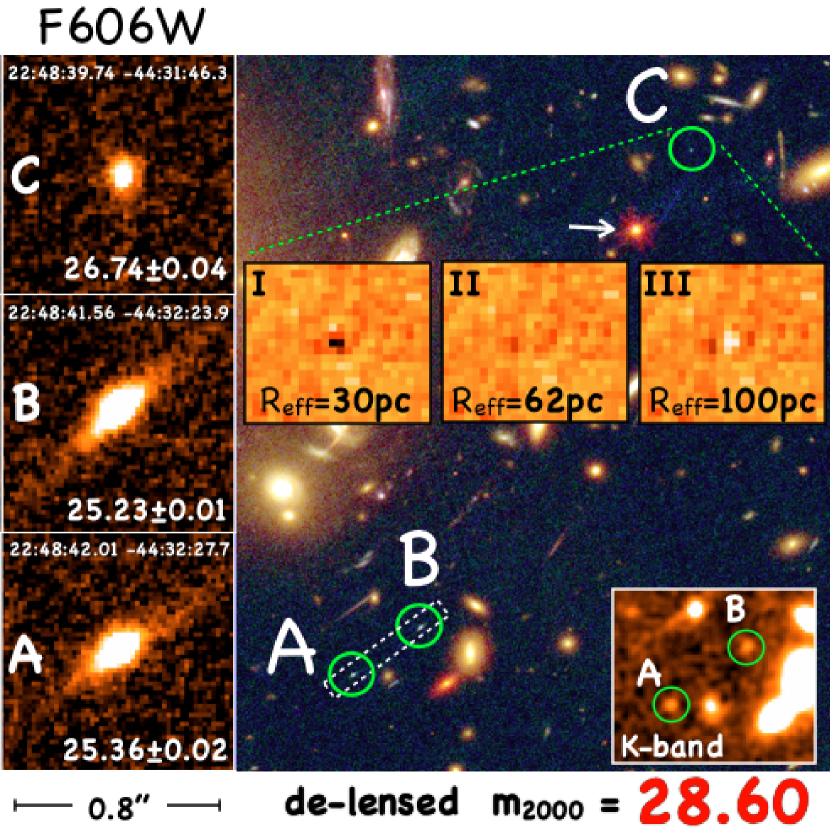
ID11 is a compact galaxy lensed into three images, A, B and C as shown in Figure 1. The A and B images have very similar F814W magnitudes, and , respectively, while the third one (C) is the faintest with F814W magnitude. Such a geometric configuration is well reproduced by the lensing modeling. The galaxy is close to a caustic on the source plane and the corresponding critical line lies approximately between the two images A and B on the lens plane. Among the three images, the faintest one (C) has the least uncertain magnification factor, that is estimated to be (Caminha et al., 2016a). The magnification of the counter-images A and B have been calculated from the observed flux ratios between C and images A,B, since the three images originate from the same source (Figure 1). The resulting magnifications are and with errors smaller than 10%, inferred from the photometry and the more accurate estimate of , and are consistent with those derived from lens modeling by Caminha et al. (2016a). The de-lensed magnitude of the source in the F814W band (probing the continuum at Å rest-frame) is .
The VLT/X-Shooter (Vernet et al., 2011) observations of source ID11 have been performed by inserting components A and B in the slit (Figure 1). Out of 4 hours requested only 2 have been executed. However, combining the two counter-images A and B, the equivalent of four hours of integration have been achieved with a spectral resolution of 5000, 7350 and 5100 in the three UVB (3000-5600Å), VIS (5500-10000Å) and NIR (10000-23700Å) arms, respectively.
Particular care has been devoted to the data reduction of such a faint object. The data were first reduced using the latest release of the ESO X-Shooter pipeline (Modigliani et al., 2010). The ESO pipeline produces rectified sky-subtracted spectra of the echelle orders that are useful to determine the position of the two A and B images along the slit. With this information a model of the sky emission on the science exposure has been calculated with the technique described in Kelson (2003).222It has been performed with a specific IDL pipeline developed by George Becker. Wavelength calibration was performed using arc lamp lines (for the UVB arm) or the sky emission lines (for the VIS and NIR arms); the resulting r.m.s. was typically 1/10 pixel. As a further check, the wavelength positions of the emission lines are fully consistent with what derived from MUSE. The combined 1D spectrum was optimally extracted from the wavelength- and flux-calibrated 2D spectra. A resolution-optimized velocity binning was adopted for the three arms (20, 11, and 19 km s-1 for the UVB, VIS, and NIR, respectively).
3. Results from spectroscopy and multi-band photometry
3.1. Spectral properties
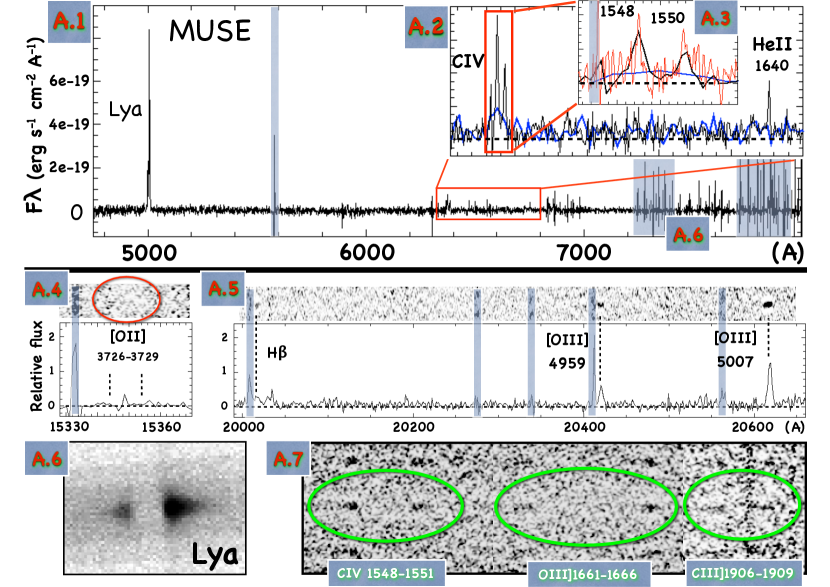
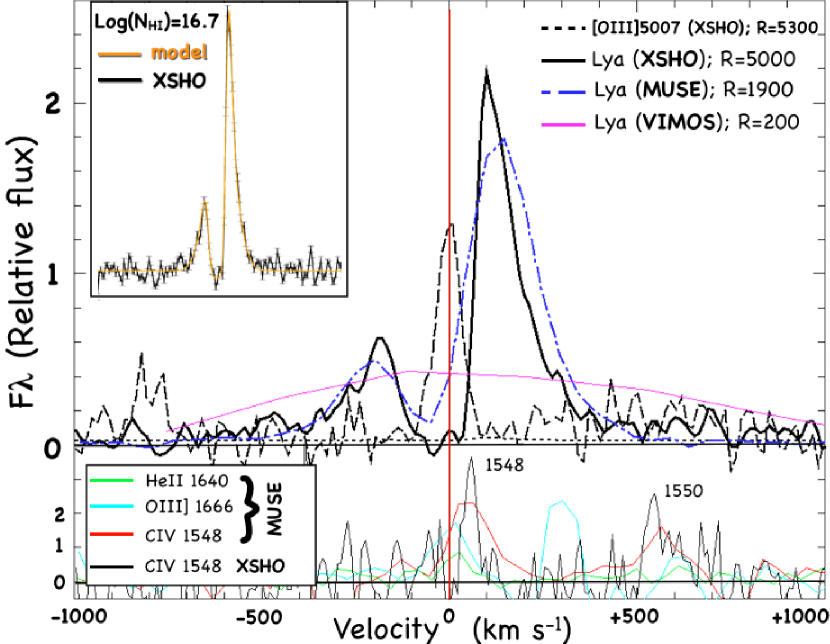
The double peaked Ly line was initially detected with MUSE (K15). The two components of the doublet are resolved in the X-Shooter spectrum, in which the asymmetric shape with a trough toward the systemic velocity is evident (see Figure 3).
As already discussed in K15, faint high ionization emission lines have been detected (Civ, Heii, Oiii]) but not resolved at the MUSE spectral resolution, placing a limit of km s-1 (instrumental corrected). As the Ly line is the brightest feature in the MUSE data, we used it to create a mask to extract the spectra. Although this leads to a higher S/N and better flux measurement of Ly, the high-ionization lines do not have enough S/N in the outer parts of this mask, and are therefore detected with lower S/N. We therefore used the mask to extract the Ly flux, but used a circular 1″ radius aperture to measure the high-ionization lines, and verified that these fluxes are in agreement with the fluxes in the full Ly-mask.
While MUSE reaches deeper flux limits with a resolution element km s-1, the X-Shooter spectral resolution allows us to investigate the width of the features down to few tens km s-1 and better resolve emission lines close to the sky emission. We anchor the flux measurements in the VIS arm to the MUSE ones (e.g. Civ doublet), therefore accounting for slit losses and derive X-Shooter fluxes for other lines missed in MUSE due to sky contamination. In particular, all the high-ionization lines identified in the X-Shooter spectrum show a FWHM of 50 km s-1 (see Table 1). It is worth noting that an accurate identification of such narrow lines in high redshift star-forming galaxies is often compromised in low resolution spectra (e.g., panel A.2, of Figure 2, blue line). The equivalent widths of the lines have been estimated from the line fluxes and the underlying continuum derived from SED fits (see below).
Furthermore, the near-infrared coverage of X-Shooter (up to ) allowed us to detect optical rest-frame emission lines like H and [O iii] from which an accurate estimate of the systemic redshift is performed. In particular, from H, [O iii] and ultraviolet Oiii] and Ciii] lines we derived . The high ionization emission lines redshifts are consistent with , except the Civ components that show a clear velocity shift of () km s-1 (Figure 3). Moreover, the observed [Oiii]5007/[Oii]3727 ratio (O32 index) is large (). We discuss below the possible interpretation of such features.
It is worth noting that at the given spectral resolution and S/N of line fluxes, the X-Shooter spectrum presented here resembles what a 40-meter class telescope can achieve in few hours integration time for an unlensed object of the same absolute magnitude and redshift (Evans et al., 2015; Karen et al., 2014).
| Line/vacuum(Å) | Flux(S/N)[FWHM][EW] | Redshift |
|---|---|---|
| Ly(blue) | 3.15(38)[104][25] | 3.1145 |
| Ly(red) | 14.53(110)[104][116] | 3.1184 |
| 0.52(18)[][7] | 3.1177 | |
| 0.29(10)[][4] | 3.1175 | |
| 0.21(6)[][3] | 3.1169 | |
| 0.20(3)[][3] | (3.1167) | |
| 0.31(5)[][5] | 3.1169 | |
| 0.28(4)[][6] | 3.1169 | |
| 0.22(2)[][5] | (3.1170) | |
| [Oii] | — | |
| [Oii] | — | |
| H | 0.31(4)[ –][] | (3.1166) |
| 0.90(12)[54][] | 3.1168 | |
| 2.35(33)[51][] | 3.1169 |
Note. — Observed fluxes are reported in units of (de-lensed fluxes can be obtained by multiplying the values by 0.06). The S/N, FWHM (instrumental corrected, km s-1) and rest-frame equivalent width (Å) are also indicated. The reported fluxes in the wavelength range 1215.68-1660.81Å are estimated from MUSE. The FWHM, except HeII1640, are estimated from the higher resolution X-Shooter spectrum. indicates redshifts measured form MUSE spectrum. Redshifts in parenthesis are uncertain due to low S/N.
3.2. Modeling the Ly profile
The separation of the double peaked Ly line () km s-1 is smaller than commonly found at this redshift. Kulas et al. (2012) reported typical separations from up to km s-1 for brighter galaxies. It is instead slightly lower than the case reported by Christensen et al. (2012) in a lensed galaxy at , in which narrow Civ emission was also detected.
The observed small separation suggests that is low. Specifically, we modeled the Ly structure with the expanding shell model presented in Gronke et al. (2015) and described in Karman et al. (in prep). We refer the reader to those works for details. Under the model assumptions, a relatively narrow range of is allowed, (an example is shown in the inset of Figure 3). This result is fully consistent with the analysis of Verhamme et al. (2015). In particular, it is worth noting that , given the estimated range for a leakage of ionizing radiation is also possible (i.e., if ). An outflow velocity of () km s-1 is also derived from the same modeling, fully consistent with the velocity offset inferred from the Civ line doublet (see below). It is worth mentioning that fast outflows ( km s-1) can mimic low when inferred from the Ly profile (Verhamme et al., 2015; Schaerer et al., 2011). However, the low velocity expansion derived from the Civ doublets supports a low for this galaxy ().
3.3. The Civ doublet and optical oxygen lines
Another evidence supporting a transparent medium is the presence of nebular Civ emission. The Civ doublet is a resonant transition and is very rarely observed with such narrow components in emission, possibly due to the low spectral resolution and limited depth of the current spectroscopic surveys. The Civ transition is a combination of stellar P-Cygni emission and broad absorption (e.g., Kudritzki, 2002), possible nebular emission, and interstellar absorption superposed (Shapley et al., 2003). In our case the very thin lines ( km s-1) suggest that the interstellar medium is transparent, allowing the Civ nebular emission to emerge. This is consistent with the low inferred from Ly modeling mentioned above. Furthermore, the doublet is also redshifted by km s-1 () compared to the systemic velocity (). The measured velocity shift is consistent with the velocity expansion inferred from the Ly modeling and can be ascribed to thin nebular emission from a moving medium.
Optical rest-frame oxygen emission lines also trace the status of the ISM. In particular, a large O32 ([Oiii]5007/[Oii]3727) index has been recently found in a LyC emitter at (de Barros et al., 2016), for which escaping ionizing radiation has been confirmed with HST observations (Vanzella et al., 2016). The source described in this work shows a large O32 index (), plausibly linked to a low , similarly to what is inferred from the Ly and Civ features discussed above. Such a large O32 index would suggest a density-bounded ISM, highly photo-ionized, in which the [Oii] emission is deficient (e.g., Jaskot & Oey, 2013; Nakajima & Ouchi, 2014).
3.4. A newborn low-metallicity compact galaxy
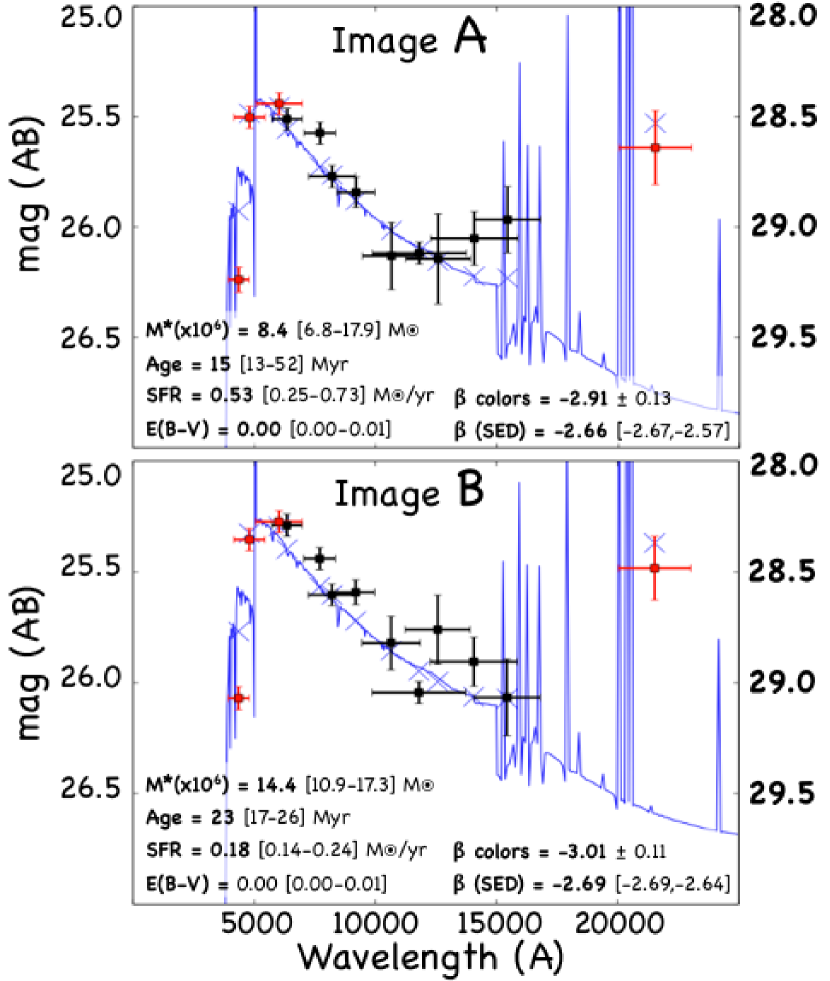
Multi-band imaging from the CLASH survey (Postman et al., 2012), recent deep HST/ACS observations part of the HFF program (F435W, F606W and F814W) and additional archival HST data have been collected and combined to produce the photometric SED shown in Figure 4 (photometry has been extracted following Coe et al., 2015). We also retrieved and reduced the VLT/HAWKI Ks-band images from the ESO archive (P095.A-0533, P.I. Brammer) and added it to the SED (see Karman et al. in prep.). The physical properties have been derived by performing SED fitting with Bruzual & Charlot (2003) models both on A and B images, and accounting for nebular emission by fixing the emission line ratios to the observed ones (Schaerer & de Barros, 2009, 2010). The fits have been carried out by including/excluding the bands affected by IGM and strong emission lines (Ly and [O iii]). The inferred physical quantities agree well in both cases and for the two counter-images (Figure 4). The K-band magnitudes dominated by the [O iii] lines and are well recovered even when the same band is excluded from the fit. Remarkably, an extremely blue ultraviolet slope is derived for the two images, from colors directly (e.g., Castellano et al., 2012) and from the best-fit SED, and , respectively (see Figure 4). Such a blue shape is compatible with a dust-free and newborn galaxy with an emergent stellar component of 20Myr. The stellar mass turns out to be . We derived the galaxy metallicity based on the direct method from the Oiii]/ [Oiii] ratio, which gives an electron temperature K (Villar-Martín et al., 2004). Following Izotov et al. (2006) and given the O32 we derive an oxygen abundance 12+log(O/H). This places the galaxy in the low-mass and low-metallicity region of the mass-metallicity plane at .
The ultraviolet emission arises from a spatially resolved region. From the F606W image of C (S/N), which has better constrained magnification (), the (de-lensed) half light radius is ()pc. The and the uncertainty have been derived with Galfit (Peng et al., 2010) following the method described in Vanzella et al. (2015, 2016). Figure 1 shows three examples of observed–model residuals for three in the F606W band: 30, 62 and 100 parsecs, corresponding to 0.30 (unresolved), 0.55 and 1.00 pixel (1pix=0.03″). A similar solution is obtained from the F814W (C), pc. Such a small size, coupled with the aforementioned properties is reminescent of that observed in a LyC emitter (Vanzella et al., 2016), though in the present case the source is more than three magnitudes fainter and 4 times smaller.
4. Discussion and Conclusions
4.1. The nature of the ionizing radiation
The comparison of line ratios like Civ/Heii, Civ/Ciii], Oiii]/Heii, Ciii]/Heii with models of Feltre et al. (2016) places the source among the star-forming galaxies, though still close to the AGN cloud, similarly to the blue galaxies of Stark et al. (2014). Such models are not conclusive for our object, however they do not consider a possible leakage of ionizing radiation, that could alter the expected ratios both for the UV and optical rest-frame lines, as for example happens for the O32 index (Nakajima & Ouchi, 2014). While the high ionization lines are compatible with an AGN, other properties suggest that the stellar emission is dominating: the source is spatially resolved in all the HST/ACS images, the very narrow widths of the involved emission lines ( km s-1) and the extremely blue slope are not typically observed in AGN-powered objects. Also the redshifted Civ doublet seems to contrast the ubiquitous blueshift observed in AGN, though at brighter luminosities (e.g., Richards et al., 2011). Therefore, while all of our data can be interpreted with hot and massive stars (, Raiter et al., 2010; Gräfener & Vink, 2015), only some of them appear to be consistent with the presence of a faint AGN.
4.2. A young and naked galaxy: a candidate low-luminosity LyC emitter
The observed spectroscopic and photometric properties in such intrinsically faint (F814W(AB)=28.60) galaxy can be measured only as a result of the factor magnification. The object is a compact (pc), young (20Myr), low mass () and dust-free galaxy, with an ionizing source able to generate a density-bounded condition in the interstellar medium as inferred from the large O32 index. Such a transparent medium would therefore enable the young stellar component to dominate the emission and produce the steep ultraviolet slope. The redshifted Civ nebular emission is also in line with an expanding optically-thin medium. In addition, the very narrow double peaked Ly profile ( km s-1), the proximity of the red Ly peak to the systemic redshift ( km s-1) and the low velocity outflow suggest a low (). Finally, as discussed by Raiter et al. (2010), the case of an escaping ionizing radiation would generate a depression of the nebular continuum that further favors a steepening of the ultraviolet slope, enhancing the equivalent width of the faint lines like Heii or Ciii], otherwise washed-out by the continuum.
The thinness of the medium is noteworthy in this object and opens the possibility that it is a LyC emitter. Irrespective of possible LyC leakage, the analysis addresses for the first time a still unexplored luminosity and mass domain, and provide a unique reference lower redshift analog to the higher redshift blue sources () at similar luminosities, believed to be the main actors during reionization (Castellano et al., 2016; Bouwens et al., 2015; Atek et al., 2015). It will be crucial to extend the analysis to a statistically significant sample and fainter luminosity limits.
Even though these extremely blue galaxies could be rare at , it might not be the case at , as the -luminosity relations of Bouwens et al. (2014) seems to indicate. In particular, at an average is expected at the luminosity probed here (, see also Finkelstein et al. 2012). In particular the Civ doublet discovered at by Stark et al. (2015b) would be interesting to compare with the source discussed here.
Finally, we remark that the initial phases of star-formation as observed here offer the opportunity to test models of galaxy formation and photoionization effects in low-mass objects for the first time.
References
- Atek et al. (2015) Atek, H., Richard, J., Kneib, J.-P., et al. 2015, ApJ, 800, 18
- Balestra et al. (2013) Balestra, I., Vanzella, E., Rosati, P., et al. 2013, A&A, 559, L9
- Bouwens et al. (2014) Bouwens, R. J., Illingworth, G. D., Oesch, P. A., et al. 2014, ApJ, 793, 115
- Bouwens et al. (2015) Bouwens, R. J., Illingworth, G. D., Oesch, P. A., et al. 2015, ApJ, 803, 34
- Bruzual & Charlot (2003) Bruzual, G., & Charlot, S. 2003, MNRAS, 344, 1000
- Caminha et al. (2016a) Caminha, G. B., Grillo, C., Rosati, P., et al. 2015, arXiv:1512.04555
- Castellano et al. (2012) Castellano, M., Fontana, A., Grazian, A., et al. 2012, A&A, 540, A39
- Castellano et al. (2016) Castellano, M., Dayal, P., Pentericci, L., et al. 2016, ApJ, 818, L3
- Christensen et al. (2012) Christensen, L., Laursen, P., Richard, J., et al. 2012, MNRAS, 427, 1973
- Coe et al. (2015) Coe, D., Bradley, L., & Zitrin, A. 2015, ApJ, 800, 84
- de Barros et al. (2016) de Barros, S., Vanzella, E., Amorín, R., et al. 2016, A&A, 585, A51
- Evans et al. (2015) Evans, C., Puech, M., Afonso, J., et al. 2015, arXiv:1501.04726
- Feltre et al. (2016) Feltre, A., Charlot, S., & Gutkin, J. 2016, MNRAS, 456, 3354
- Finkelstein et al. (2012) Finkelstein, S. L., Papovich, C., Salmon, B., et al. 2012, ApJ, 756, 164
- Fontanot et al. (2014) Fontanot, F., Cristiani, S., Pfrommer, C., Cupani, G., & Vanzella, E. 2014, MNRAS, 438, 2097
- Gräfener & Vink (2015) Gräfener, G., & Vink, J. S. 2015, A&A, 578, L2
- Gronke et al. (2015) Gronke, M., Bull, P., & Dijkstra, M. 2015, ApJ, 812, 123
- Izotov et al. (2006) Izotov, Y. I., Stasińska, G., Meynet, G., Guseva, N. G., & Thuan, T. X. 2006, A&A, 448, 955
- Izotov et al. (2016) Izotov, Y. I., Orlitová, I., Schaerer, D., et al. 2016, Nature, 529, 178
- Lotz et al. (2014) Lotz, J., Mountain, M., Grogin, N. A., et al. 2014, American Astronomical Society Meeting Abstracts #223, 223, 254.01
- Jaskot & Oey (2013) Jaskot, A. E., & Oey, M. S. 2013, ApJ, 766, 91
- Karen et al. (2014) Karen. D., Puech, M., Flores H., et al., 2014, SPIE, 914, 91
- Karman et al. (2015) Karman, W., Caputi, K. I., Grillo, C., et al. 2015, A&A, 574, A11
- Kelson (2003) Kelson, D. D. 2003, PASP, 115, 688
- Kimm & Cen (2014) Kimm, T., & Cen, R. 2014, ApJ, 788, 121
- Koekemoer et al. (2014) Koekemoer, A. M., Avila, R. J., Hammer, D., et al. 2014, American Astronomical Society Meeting Abstracts #223, 223, 254.02
- Kudritzki (2002) Kudritzki, R. P. 2002, ApJ, 577, 389
- Kulas et al. (2012) Kulas, K. R., Shapley, A. E., Kollmeier, J. A., et al. 2012, ApJ, 745, 33
- Madau & Haardt (2015) Madau, P., & Haardt, F. 2015, ApJ, 813, L8
- Modigliani et al. (2010) Modigliani, A., Goldoni, P., Royer, F., et al. 2010, Proc. SPIE, 7737, 773728
- Nakajima & Ouchi (2014) Nakajima, K., & Ouchi, M. 2014, MNRAS, 442, 900
- Peng et al. (2010) Peng, C. Y., Ho, L. C., Impey, C. D., & Rix, H.-W. 2010, AJ, 139, 2097, 2097
- Postman et al. (2012) Postman, M., Coe, D., Benítez, N., et al. 2012, ApJS, 199, 25
- Raiter et al. (2010) Raiter, A., Schaerer, D., & Fosbury, R. A. E. 2010, A&A, 523, A64
- Richards et al. (2011) Richards, G. T., Kruczek, N. E., Gallagher, S. C., et al. 2011, AJ, 141, 167
- Schaerer & de Barros (2010) Schaerer, D., & de Barros, S. 2010, A&A, 515, A73
- Schaerer & de Barros (2009) Schaerer, D., & de Barros, S. 2009, A&A, 502, 423
- Schaerer et al. (2011) Schaerer, D., Hayes, M., Verhamme, A., & Teyssier, R. 2011, A&A, 531, A12
- Shapley et al. (2003) Shapley, A. E., Steidel, C. C., Pettini, M., & Adelberger, K. L. 2003, ApJ, 588, 65
- Sharma et al. (2016) Sharma, M., Theuns, T., Frenk, C., et al. 2016, MNRAS, arXiv..
- Sobral et al. (2015) Sobral, D., Matthee, J., Darvish, B., et al. 2015, ApJ, 808, 139
- Stark et al. (2014) Stark, D. P., Richard, J., Siana, B., et al. 2014, MNRAS, 445, 3200
- Stark et al. (2015a) Stark, D. P., Richard, J., Charlot, S., et al. 2015, MNRAS, 450, 1846
- Stark et al. (2015b) Stark, D. P., Walth, G., Charlot, S., et al. 2015, MNRAS, 454, 1393
- Vanzella et al. (2016) Vanzella, E., de Barros, S., Vasei, K., et al. 2016, arXiv:1602.00688
- Vanzella et al. (2015) Vanzella, E., de Barros, S., Castellano, M., et al. 2015, A&A, 576, A116
- Verhamme et al. (2015) Verhamme, A., Orlitová, I., Schaerer, D., & Hayes, M. 2015, A&A, 578, A7
- Vernet et al. (2011) Vernet, J., Dekker, H., D’Odorico, S., et al. 2011, A&A, 536, A105
- Villar-Martín et al. (2004) Villar-Martín, M., Cerviño, M., & González Delgado, R. M. 2004, MNRAS, 355, 1132
- Wise et al. (2014) Wise, J. H., Demchenko, V. G., Halicek, M. T., et al. 2014, MNRAS, 442, 2560