A large light-mass component of cosmic rays at 1017 - 1017.5 eV from radio observations
Abstract
Cosmic rays are the highest energy particles found in nature. Measurements of the mass composition of cosmic rays between eV and eV are essential to understand whether this energy range is dominated by Galactic or extragalactic sources. It has also been proposed that the astrophysical neutrino signal[1] comes from accelerators capable of producing cosmic rays of these energies[2]. Cosmic rays initiate cascades of secondary particles (air showers) in the atmosphere and their masses are inferred from measurements of the atmospheric depth of the shower maximum, [3], or the composition of shower particles reaching the ground[4]. Current measurements[5] suffer from either low precision, and/or a low duty cycle. Radio detection of cosmic rays[6, 7, 8] is a rapidly developing technique[9], suitable for determination of [10, 11] with a duty cycle of in principle nearly 100%. The radiation is generated by the separation of relativistic charged particles in the geomagnetic field and a negative charge excess in the shower front[6, 12]. Here we report radio measurements of with a mean precision of 16 g/cm2 between eV. Because of the high resolution in we can determine the mass spectrum and find a mixed composition, containing a light mass fraction of %. Unless the extragalactic component becomes significant already below eV, our measurements indicate an additional Galactic component dominating at this energy range.
S. Buitink1,2, A. Corstanje2, H. Falcke2,3,4,5, J. R. Hörandel2,4, T. Huege6, A. Nelles2,7, J. P. Rachen2, L. Rossetto2, P .Schellart2, O. Scholten8,9, S. ter Veen3, S. Thoudam2, T. N. G. Trinh8, J. Anderson10, A. Asgekar3,11, I. M. Avruch12,13, M. E. Bell14, M. J. Bentum3,15, G. Bernardi16,17, P. Best18, A. Bonafede19, F. Breitling20, J. W. Broderick21, W. N. Brouw3,13, M. Brüggen19, H. R. Butcher22, D. Carbone23, B. Ciardi24, J. E. Conway25, F. de Gasperin19, E. de Geus3,26, A. Deller3, R.-J. Dettmar27, G. van Diepen3, S. Duscha3, J. Eislöffel28, D. Engels29, J. E. Enriquez2, R. A. Fallows3, R. Fender35, C. Ferrari30, W. Frieswijk3, M. A. Garrett3,31, J. M. Grießmeier32,33, A. W. Gunst3, M. P. van Haarlem3, T. E. Hassall21, G. Heald3,13, J. W. T. Hessels3,23, M. Hoeft28, A. Horneffer5, M. Iacobelli3, H. Intema31,34, E. Juette27, A. Karastergiou35, V. I. Kondratiev3,36, M. Kramer5,44, M. Kuniyoshi37, G. Kuper3, J. van Leeuwen3,23, G. M. Loose3, P. Maat3, G. Mann20, S. Markoff23, R. McFadden3, D. McKay-Bukowski38,39, J. P. McKean3,13, M. Mevius3,13, D. D. Mulcahy21, H. Munk3, M. J. Norden3, E. Orru3, H. Paas40, M. Pandey-Pommier41, V. N. Pandey3, M. Pietka35, R. Pizzo3, A. G. Polatidis3, W. Reich5, H. J. A. Röttgering31, A. M. M. Scaife21, D. J. Schwarz42, M. Serylak35, J. Sluman3, O. Smirnov43,17, B. W. Stappers44, M. Steinmetz20, A. Stewart35, J. Swinbank23,45, M. Tagger32, Y. Tang3, C. Tasse43,46, M. C. Toribio3,31, R. Vermeulen3, C. Vocks20, C. Vogt3, R. J. van Weeren16, R. A. M. J. Wijers23, S. J. Wijnholds3, M. W. Wise3,23, O. Wucknitz5, S. Yatawatta3, P. Zarka47, J. A. Zensus5
Astrophysical Institute, Vrije Universiteit Brussel, Pleinlaan 2, 1050 Brussels, Belgium
Department of Astrophysics/IMAPP, Radboud University Nijmegen, P.O. Box 9010, 6500 GL Nijmegen, The Netherlands
ASTRON, Netherlands Institute for Radio Astronomy, Postbus 2, 7990 AA, Dwingeloo, The Netherlands
Nikhef, Science Park Amsterdam, 1098 XG Amsterdam, The Netherlands
Max-Planck-Institut für Radioastronomie, Auf dem Hügel 69, 53121 Bonn, Germany
IKP, Karlsruhe Institute of Technology (KIT), Postfach 3640, 76021 Karlsruhe, Germany
Department of Physics and Astronomy, University of California Irvine, Irvine, CA 92697, USA
KVI CART, University of Groningen, 9747 AA Groningen, The Netherlands
Vrije Universiteit Brussel, Dienst ELEM, Brussels, Belgium
Helmholtz-Zentrum Potsdam, DeutschesGeoForschungsZentrum GFZ, Department 1: Geodesy and Remote Sensing, Telegrafenberg, A17, 14473 Potsdam, Germany
Shell Technology Center, Bangalore, India
SRON Netherlands Insitute for Space Research, PO Box 800, 9700 AV Groningen, The Netherlands
Kapteyn Astronomical Institute, PO Box 800, 9700 AV Groningen, The Netherlands
CSIRO Australia Telescope National Facility, PO Box 76, Epping NSW 1710, Australia
University of Twente, The Netherlands
Harvard-Smithsonian Center for Astrophysics, 60 Garden Street, Cambridge, MA 02138, USA
SKA South Africa, 3rd Floor, The Park, Park Road, Pinelands, 7405, South Africa
Institute for Astronomy, University of Edinburgh, Royal Observatory of Edinburgh, Blackford Hill, Edinburgh EH9 3HJ, UK
University of Hamburg, Gojenbergsweg 112, 21029 Hamburg, Germany
Leibniz-Institut für Astrophysik Potsdam (AIP), An der Sternwarte 16, 14482 Potsdam, Germany
School of Physics and Astronomy, University of Southampton, Southampton, SO17 1BJ, UK
Research School of Astronomy and Astrophysics, Australian National University, Canberra, ACT 2611 Australia
Anton Pannekoek Institute for Astronomy, University of Amsterdam, Science Park 904, 1098 XH Amsterdam, The Netherlands
Max Planck Institute for Astrophysics, Karl Schwarzschild Str. 1, 85741 Garching, Germany
Onsala Space Observatory, Dept. of Earth and Space Sciences, Chalmers University of Technology, SE-43992 Onsala, Sweden
SmarterVision BV, Oostersingel 5, 9401 JX Assen
Astronomisches Institut der Ruhr-Universität Bochum, Universitaetsstrasse 150, 44780 Bochum, Germany
Thüringer Landessternwarte, Sternwarte 5, D-07778 Tautenburg, Germany
Hamburger Sternwarte, Gojenbergsweg 112, D-21029 Hamburg
Laboratoire Lagrange, Université Côte d’Azur, Observatoire de la Côte d’Azur, CNRS, Blvd de l’Observatoire, CS 34229, 06304 Nice cedex 4, France
Leiden Observatory, Leiden University, PO Box 9513, 2300 RA Leiden, The Netherlands
LPC2E - Universite d’Orleans/CNRS
Station de Radioastronomie de Nancay, Observatoire de Paris - CNRS/INSU, USR 704 - Univ. Orleans, OSUC , route de Souesmes, 18330 Nancay, France
National Radio Astronomy Observatory, 1003 Lopezville Road, Socorro, NM 87801-0387, USA
Astrophysics, University of Oxford, Denys Wilkinson Building, Keble Road, Oxford OX1 3RH
Astro Space Center of the Lebedev Physical Institute, Profsoyuznaya str. 84/32, Moscow 117997, Russia
National Astronomical Observatory of Japan, Japan
Sodankylä Geophysical Observatory, University of Oulu, Tähteläntie 62, 99600 Sodankylä, Finland
STFC Rutherford Appleton Laboratory, Harwell Science and Innovation Campus, Didcot OX11 0QX, UK
Center for Information Technology (CIT), University of Groningen, The Netherlands
Centre de Recherche Astrophysique de Lyon, Observatoire de Lyon, 9 av Charles André, 69561 Saint Genis Laval Cedex, France
Fakultät fü r Physik, Universität Bielefeld, Postfach 100131, D-33501, Bielefeld, Germany
Department of Physics and Electronics, Rhodes University, PO Box 94, Grahamstown 6140, South Africa
Jodrell Bank Center for Astrophysics, School of Physics and Astronomy, The University of Manchester, Manchester M13 9PL,UK
Department of Astrophysical Sciences, Princeton University, Princeton, NJ 08544, USA
GEPI, Observatoire de Paris, CNRS, Université Paris Diderot, 5 place Jules Janssen, 92190 Meudon, France
LESIA, UMR CNRS 8109, Observatoire de Paris, 92195 Meudon, France
Observations were made with the Low Frequency Array (LOFAR[13]), a radio telescope consisting of thousands of crossed dipoles, with built-in air shower detection capability[14]. LOFAR records the radio signals from air showers continuously while running astronomical observations simultaneously. It comprises a scintillator array (LORA), that triggers the readout of buffers, storing the full waveforms received by all antennas.
We have selected air showers from the period June 2011 - January 2015 with radio pulses in at least 192 antennas. The total uptime was 150 days, limited by construction and commissioning of the telescope. Showers that occurred within an hour from lightning activity, or have a polarisation pattern that is indicative of influences from atmospheric electric fields are excluded from the sample[15].
Radio intensity patterns from air showers are asymmetric due to the interference between geomagnetic and charge excess radiation. They can be reproduced from first principles by summing the radio contributions of all electrons and positrons in the shower. We use the radio simulation code CoREAS[16], a plug-in of CORSIKA[17], which follows this approach.
It has been shown that can be accurately reconstructed from densely sampled radio measurements[18]. We use a hybrid approach, simultaneously fitting the radio and particle data. The radio component is very sensitive to , while the particle component is used for the energy measurement.
The fit contains four free parameters: the shower core position , and scaling factors for the particle density and the radio power . If deviates significantly from unity, the reconstructed energy does not match the simulation and a new set of simulations is produced. This procedure is repeated until the energies agree within uncertainties. The ratio between and should be the same for all showers and is used to derive the energy resolution of 32% (see Figure 1).
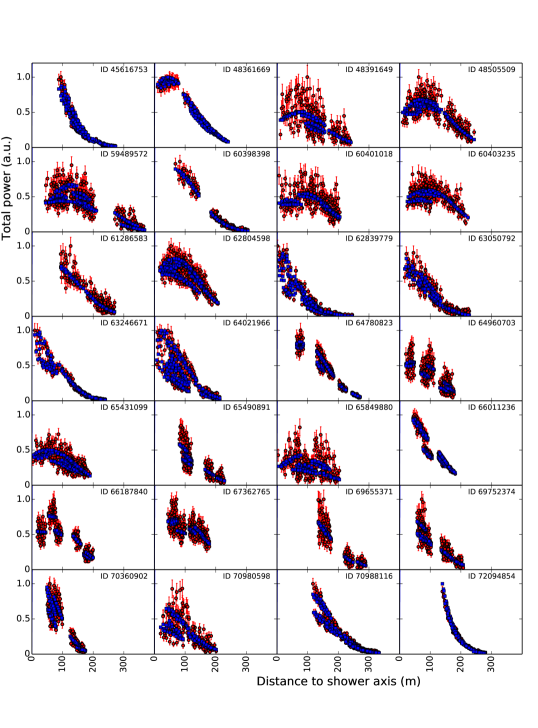
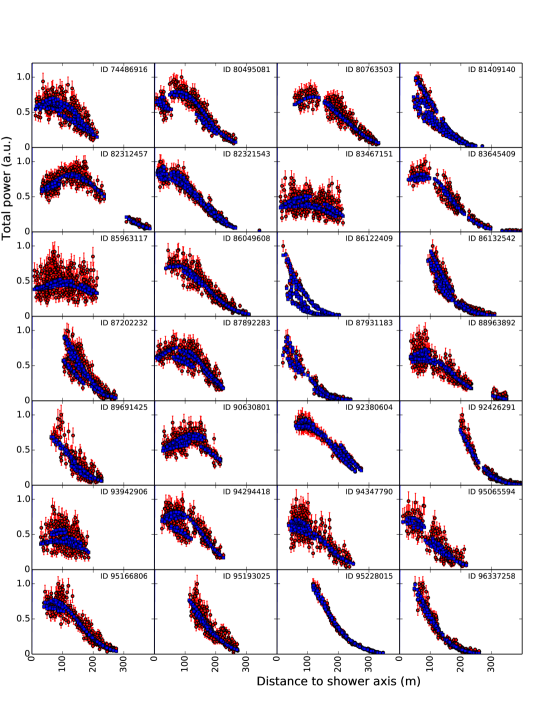
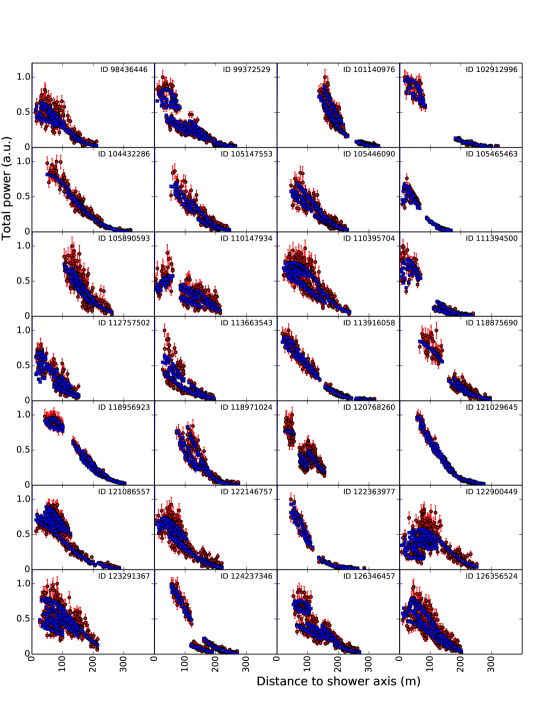
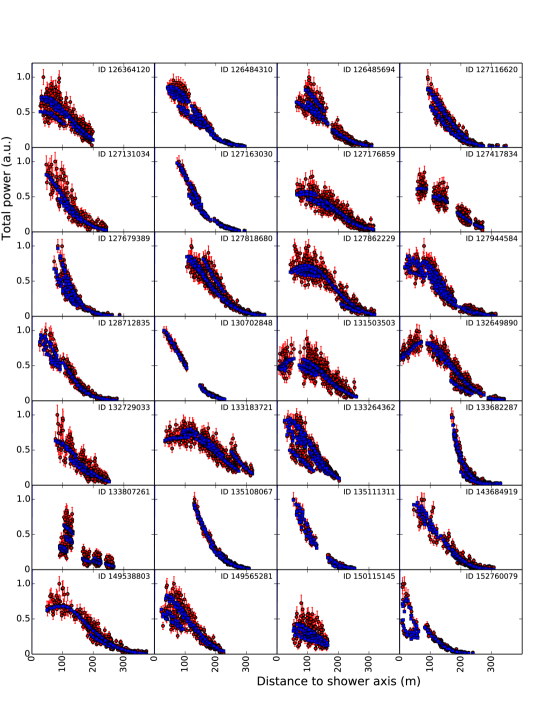
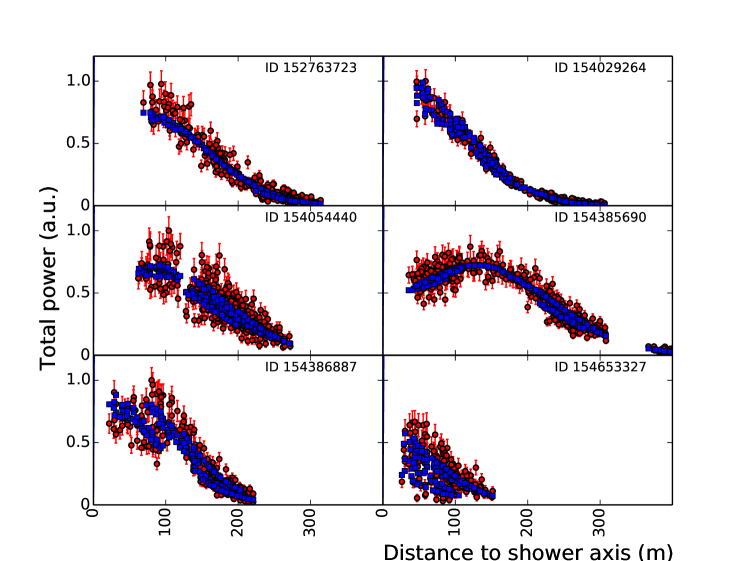
The radio intensity fits have reduced -values ranging from 0.9 to 2.9. All features in the data are well reproduced by the simulation (see Extended Data Figs. 1-5), demonstrating that the radiation mechanism is now well-understood. The reduced -values exceeding unity may indicate remaining uncertainties in the antenna response, atmospheric properties, or limitations of the simulation software.
Radio detection becomes more efficient for higher-altitude showers that have larger footprints. The particle trigger, however, becomes less efficient since the number of particles reaching the ground decreases. To avoid a bias, we require that all the simulations produced for a shower pass the trigger criteria. Above eV this cut removes 4 showers from the sample. At lower energies, this number rapidly increases, and we exclude all showers below eV from this analysis.
Furthermore, we evaluate the reconstructed core positions of all simulated showers. Showers with a mean reconstruction error above 5 m are rejected. This cut does not introduce a composition bias, because it is based on the sets of simulated showers, and not on the data. The final event sample contains 118 showers.
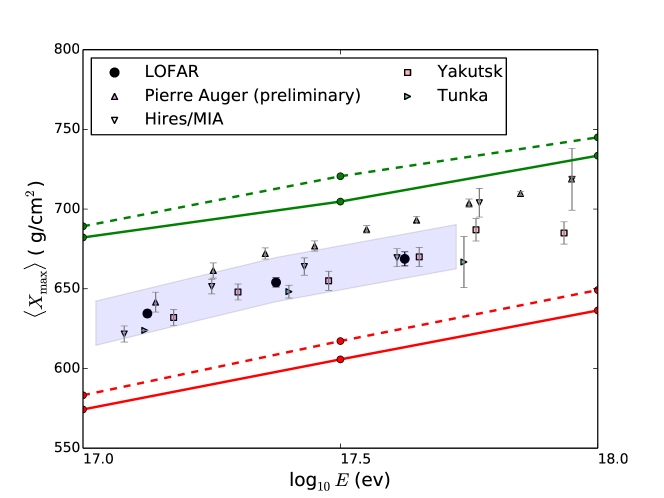
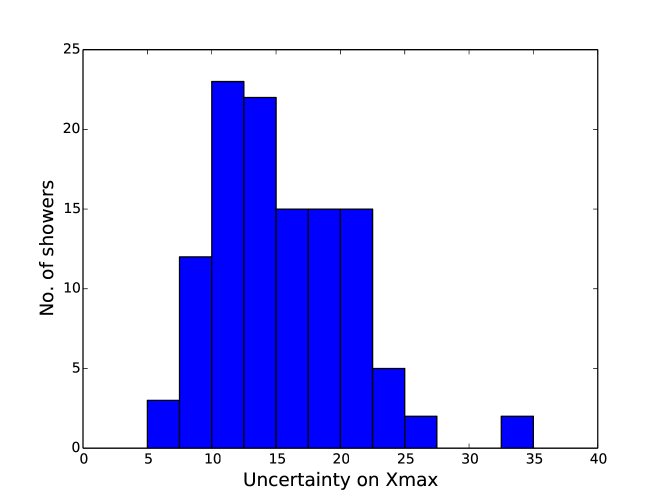
The uncertainty on is determined independently for all showers[18], and has a mean value of 16 g/cm2 (see Extended Data Figure 6). Figure 2 shows our measurements of the average , which are consistent with earlier experiments using different methods, within statistical uncertainties. The high resolution for per shower allows us to derive more information on the composition of cosmic rays, by studying the complete shape of the distribution. For each shower, we calculate:
| (1) |
where is the reconstructed , and and are mean values predicted by the hadronic interaction code QGSJETII.04[19].
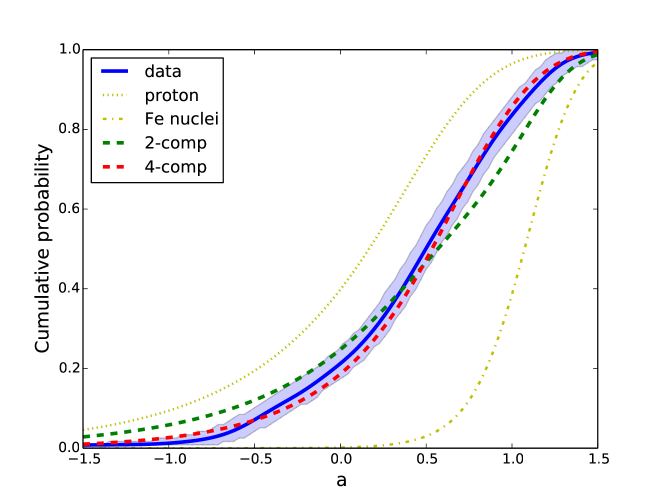
The cumulative probability density function (CDF) for all showers is plotted in Fig. 3. First, we fit a 2-component model of proton and iron nuclei, with the mixing ratio as the only free parameter. To calculate the corresponding CDFs we use a parametrisation of the distribution fitted to simulations based on QGSJETII.04. The best fit is found for a proton fraction of 62%, but it describes the data poorly with a p-value of .
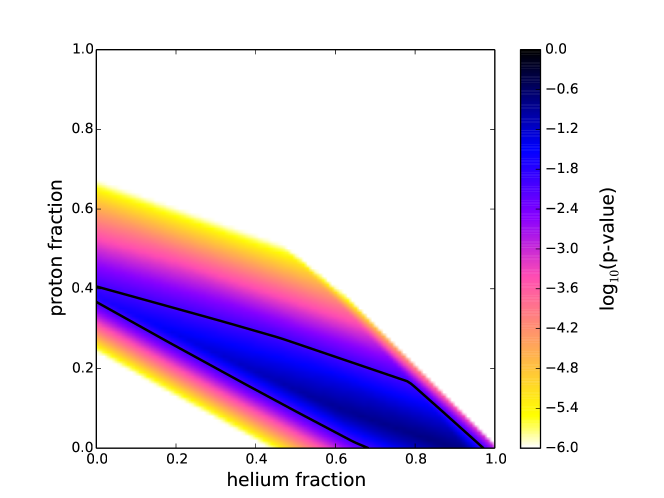
A better fit is achieved with a four-component model (p+He+N+Fe), yielding a p-value of 0.17. While the best fit is found for a Helium fraction of 80%, the fit quality deteriorates only slowly when replacing helium by protons. This is demonstrated in Figure 4 where the p-value is plotted for four-component fits where the fractions of helium and proton are fixed, and the ratio between N and Fe is left as the only free parameter. The total fraction of light elements (p+He) is in the range [0.38,0.98] at 99% confidence level, with a best fit value of 0.8. The heaviest composition that is allowed within systematic uncertainties still has a best fit p+He fraction of 0.6, and a 99% confidence level interval of [0.18, 0.82]. The online method section contains information about the systematic uncertainties and the statistical analysis.
The abundances of individual elements depend on the hadronic interaction model. The values predicted by EPOS-LHC[20] are on average 15-20 g/cm2 higher than QGSJETII.04 (see Fig. 2). This coincides with the separation between, for example, protons and deuterium or between helium and beryllium. We therefore prefer to present our result as a total fraction of light elements, instead of placing too much emphasis on individual elements.
Recent results for the Pierre Auger Observatory indicate that the cosmic ray composition at 1018 eV, just below the ankle, can be fitted with a mixture of protons and either helium (QGSJET.II04) or nitrogen (EPOS-LHC)[3]. With decreasing energy, their proton fraction drops, while their helium (or nitrogen) fraction rises, down to the threshold energy of eV. An extrapolation of this trend to our mean energy of eV connects smoothly to our best fitting solution in which helium dominates.
KASCADE-Grande has reported an ankle-like feature at eV, where the spectral index for light elements changes to [4]. However, they find a light particle (p+He) fraction below 30% at eV (based on their Figure 4), considerably lower than our value. In contrast to LOFAR and Auger, their composition measurements are based on the muon/electron ratio. Auger has reported a muon excess compared to all commonly used hadronic interaction models[21]. Inaccurate predictions of muon production, or , can be the cause of the discrepancy in the fraction of light particles between LOFAR and KASCADE-Grande.
If the knee in the all-particle spectrum near eV corresponds to the proton or helium cut-off of the main Galactic cosmic-ray population, the corresponding iron cut-off would lie at most at an energy 26 times larger. If this population still dominates at 1017 eV, the mass composition should be dominated by heavy elements at that energy. Therefore, the large component of light elements observed with LOFAR must have another origin.
In principle, it is possible that we observe an extragalactic component. In that case the ankle in the cosmic-ray spectrum, slightly above 1018 eV, does not indicate the transition from Galactic to extragalactic origin. Instead, it can be explained as the imprint of pair production on the cosmic microwave background on an extragalactic proton spectrum[22]. However, since this feature only appears for a proton-dominated flux it is in tension with our data that favours a mixture of light elements.
A second Galactic component, dominating around 1017 eV, can be produced by a class of extremely energetic sources (Galactic exatrons), like the explosions of Wolf Rayet stars into their stellar winds[23], or past Galactic gamma-ray bursts[24]. Alternatively, the original Galactic population could be reaccelerated by the Galactic wind termination shock[25]. Such scenarios predict mixtures of light elements, consistent with our results.
References
- [1] Aartsen, M. et al. [IceCube collaboration], Evidence for High-Energy Extraterrestrial Neutrinos at the IceCube Detector, Science 342, 1242856 (2013).
- [2] Murase, K., Ahlers, M., and Lacki, B., Testing the hadronuclear origin of PeV neutrinos observed with IceCube, Phys. Rev. D 88, 121301 (2013).
- [3] Aab, A. et al. [Pierre Auger collaboration], Depth of maximum of air-shower profiles at the Pierre Auger Observatory. II. Composition implications, Phys. Rev. D 90, 122006 (2014).
- [4] Apel, W. et al. [KASCADE-Grande collaboration], Ankle-like feature in the energy spectrum of light elements of cosmic rays observed with KASCADE-Grande, Phys. Rev. D 87, 081101 (2013).
- [5] Kampert, K.-H. and Unger, M., Measurements of the cosmic ray composition with air shower experiments, Astropart. Phys. 35, 660-678 (2012).
- [6] Allan, H. R., Radio Emission from Extensive Air Showers, Prog. Elem. Part. Cosm. Ray Phys. 10, 171-302 (1971).
- [7] Falcke, H. & Gorham, P.W., Detecting radio emission from cosmic ray air showers and neutrinos with a digital radio telescope, Astropart. Phys. 19, 477-494 (2003).
- [8] Falcke, H. et al. [LOPES collaboration], Detection and imaging of atmospheric radio flashes from cosmic ray air showers, Nature 435, 313-316 (2005).
- [9] Huege, T., The Renaissance of Radio Detection of Cosmic Rays, Brazilian Journal of Physics 44, 520-529 (2014).
- [10] Apel, W. et al. [LOPES collaboration], Reconstruction of the energy and depth of maximum of cosmic-ray air showers from LOPES radio measurements, Phys. Rev. D 90, 062001 (2014).
- [11] Belov, K. et al. [ANITA collaboration], Towards determining the energy of the UHECRs observed by the ANITA detector, AIP Conference Proceedings 1535, 209-213 (2013).
- [12] Werner, K. and Scholten, O., Macroscopic Treatment of Radio Emission from Cosmic Ray Air Showers based on Shower Simulations, Astropart. Phys. 29, 393-411 (2008).
- [13] Van Haarlem, M. et al. [LOFAR collaboration], LOFAR: The LOw-Frequency ARray, Astron. Astrophys. 556, A2 (2013).
- [14] Schellart, P. et al. [LOFAR collaboration], Detecting cosmic rays with the LOFAR radio telescope, Astron. Astrophys. 560 A98 (2013).
- [15] Schellart, P. et al. [LOFAR collaboration], Probing Atmospheric Electric Fields in Thunderstorms through Radio Emission from Cosmic-Ray-Induced Air Showers, Phys. Rev. Lett. 114, 165001 (2015).
- [16] Huege, T., Ludwig, M. and James,C., Simulating radio emission from air showers with CoREAS, AIP Conference Proceedings 1535, 128-132 (2012).
- [17] Heck, D. et al., CORSIKA: a Monte Carlo code to simulate extensive air showers, Report FZKA 6019 (1998).
- [18] Buitink, S. et al. [LOFAR collaboration], Method for high precision reconstruction of air shower Xmax using two-dimensional radio intensity profiles, Phys. Rev. D 90, 082003 (2014).
- [19] Ostapchenko, S., QGSJET-II: results for extensive air showers, Nucl. Phys. B Proc. Suppl. 151, 147-150 (2006).
- [20] Pierog, T., and Werner, K., EPOS Model and Ultra High Energy Cosmic Rays, Nucl. Phys. B Proc. Suppl. 196, 102-105 (2009).
- [21] Aab, A. et al. [Pierre Auger collaboration], Muons in air showers at the Pierre Auger Observatory: Mean number in highly inclined events, Phys. Rev. D 91, 032003 (2015).
- [22] Aloisio, R. et al., A dip in the UHECR spectrum and the transition from galactic to extragalactic cosmic rays, Astropart. Phys. 27, 76-91 (2007).
- [23] Stanev, T., Biermann, P., and Gaisser, T., Cosmic rays. IV. The spectrum and chemical composition above 10 GeV, Astron. Astrophys. 274, 902-915 (1993).
- [24] Calvez, A., Kusenko, S., and Nagataki, S., Role of Galactic sources and magnetic fields in forming the observed energy-dependent composition of ultrahigh-energy cosmic rays, Phys. Rev. Lett. 105, 091101 (2010).
- [25] Jokipii, J.R. and Morfill, G., Ultra-high-energy cosmic rays in a galactic wind and its termination shock, Astrophys. J. 312, 170-177 (1987).
- [26] Porcelli, A. for the Pierre Auger Collaboration, PoS (ICRC2015) 420; arXiv:1509.03732
- [27] Abu-Zayyad, T. et al. [HiRes/MIA collaboration], Measurement of the Cosmic-Ray Energy Spectrum and Composition from 1017 to 1018.3 eV Using a Hybrid Technique, Astrophys. J. 557 (2001) 686-699.
- [28] Knurenko, S. and Sabourov, A. [Yakutsk collaboration], The depth of maximum shower development and its fluctuations: cosmic ray mass composition at , Proc. XVI ISVHECRI (2010).
- [29] Berezhnev, S.F. et al. [Tunka collaboration.], Tunka-133: Primary Cosmic Ray Mass Composition in the Energy Range eV, Proc. 32nd ICRC Beijing 209 (2011). {addendum} We acknowledge financial support from the Netherlands Organization for Scientific Research (NWO), VENI grant 639-041-130, the Netherlands Research School for Astronomy (NOVA), the Samenwerkingsverband Noord-Nederland (SNN) and the Foundation for Fundamental Research on Matter (FOM). We acknowledge funding from the European Research Council under the European Union’s Seventh Framework Program (FP/2007-2013) / ERC (grant agreement n. 227610) and under the European Union’s Horizon 2020 research and innovation programme (grant agreement n. 640130). LOFAR, the Low Frequency Array designed and constructed by ASTRON, has facilities in several countries, that are owned by various parties (each with their own funding sources), and that are collectively operated by the International LOFAR Telescope (ILT) foundation under a joint scientific policy. All authors are part of the LOFAR collaboration and have contributed to the design, construction, calibration, and maintenance of LOFAR and/or LORA. The first thirteen authors constitute the Cosmic Ray Key Science Project and have contributed to the acquisition, calibration, and analysis of cosmic ray radio data and LORA data. The manuscript was written by S.B. and subjected to an internal collaboration-wide review process. All authors approved the final version of the manuscript. Reprints and permissions information is available at www.nature.com/reprints. The authors declare no competing financial interests. Correspondence and requests for materials should be addressed to Stijn Buitink (Stijn.Buitink@vub.ac.be).
0.1 Methods
0.2 Event selection
Cosmic ray detection at LOFAR continuously runs in the background during astronomical observations. When 16 out of the 20 scintillator stations of the LORA particle array detect a signal, a trigger is issued and the ring buffers of all active antennas within a km radius are stored for offline analysis[14]. Which antennas are active depends on the settings of the astronomical observation. For this analysis we have selected showers that were measured with at least 4 antenna stations (corresponding to at least 192 antennas) in the low band (30 - 80 MHz after filtering)
The trigger and selection criteria introduce a composition bias. This bias is removed with a cut based on dedicated sets of simulations that are produced for each observed shower. These sets contain 50 proton and 25 iron showers, that span the whole range of possible shower depths. A shower is only accepted when all simulations in its set pass the triggering and selection criteria. This anti-bias cut removes many showers below eV, but only 4 above that energy. In this analysis, we restrict ourselves to the higher-energy showers and impose a cut on energy eV.
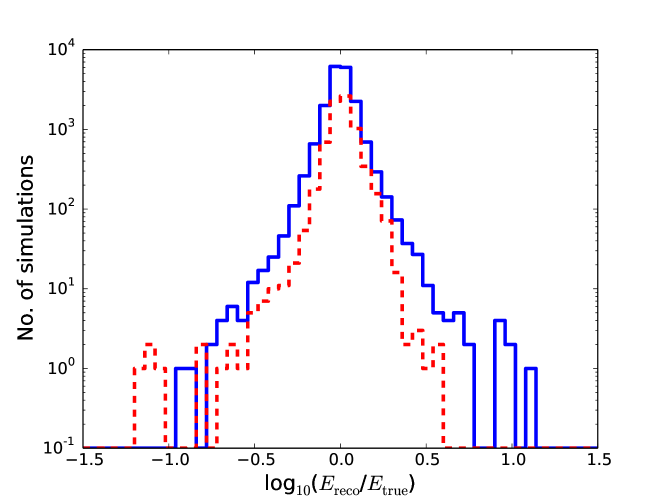
The energy cut itself is another potential source of compositional bias, as the reconstructed energy might be dependent on the depth of the shower. However, in our reconstruction approach this effect is very small because energy and are fitted simultaneously. Extended Data Figure 7 shows distributions of the ratio between true and reconstructed energy for proton and iron simulations. The systematic offset between the two particle types is of the order of %.
We used data from the Royal Netherlands Meteorological Institute to check for lightning storm conditions during our observations. When lightning strikes have been detected in the North of the Netherlands within an hour from a detection, the event is flagged and excluded from the analysis. The presence of electric fields in the clouds can severely alter the radio emission even in the absence of lightning discharges[1]. The polarisation angle of the radio pulse is very sensitive to the nature of the emission mechanism [2, 15] and is used as an additional veto against strong field conditions.
Finally, a quality cut is imposed on the sample in order to only include showers that have a core position and arrival direction that allows accurate reconstruction. We use the dedicated sets of simulations produced for each shower to derive uncertainties on core position, energy and . These three values are highly correlated, so a single cut on the core uncertainty of m is sufficient.
The quality cut is based on the dedicated sets of simulations. These sets are produced for a specific combination of core position and arrival direction. Therefore, the quality cut is effectively a cut on position and direction, and does not introduce a composition bias.
Furthermore, we stress that there is no cut on the quality of the reconstruction of the actual data. By applying the cuts described above we obtain a sample of 118 showers that are fitted to the simulation yielding reduced -values in the range 0.9-2.9. Deviations from unity can be ascribed to uncertainties in antenna response, atmospheric properties like the index of refraction, or limitations of the simulation software.
0.3 Reconstruction
The energy and of the shower are reconstructed with the technique described in Buitink et al. (2014)[18].
0.4 Statistical uncertainty
The statistical uncertainty on the power measurements of individual antennas include three contributions. First, there is contribution from the background noise which is a combination of system noise and the Galactic background. Secondly, there is a contribution from uncertainties in the antenna response model. There can be differences between the responses of antennas, either because of antenna properties (e.g. cross-talk between nearby antennas), or because of signal properties (e.g. polarisation). Since these fluctuations are different for each shower core position and arrival direction, they are essentially random and included as a 10% statistical uncertainty on the power. A third contribution is due to the error introduced by interpolating the simulated pulse power. Strictly speaking this is not a measurement uncertainty, but it must be taken into account when fitting the data to simulation. The interpolation error is of the order of 2.5% of the maximum power[18]. The three contributions are added in quadrature and produce the one sigma error bars shown in Extended Data Figures 1-5.
The statistical uncertainty on is given by the quadratic sum of the uncertainties due to reconstruction technique and the atmospheric correction. The former is found by applying our analysis to simulated events with added Gaussian noise, where the noise level is determined from the data.
In the CORSIKA simulations the standard US atmosphere model was used. The reconstructed shower depth is corrected for variations in the atmosphere using data from the Global Data Assimilation System (GDAS) of the NOAA National Climatic Data Center. We follow a procedure developed by the Pierre Auger collaboration[3]. This typically leads to adjustments of the order of 5–20 g/cm2. Remaining uncertainty after correction if of the order of 1 g/cm2
The index of refraction of air is a function of temperature, air pressure, and relative humidity. Using local weather information the final data sample was split in two equal size groups corresponding to conditions with relatively high or low index of refraction. The mean reconstructed of these groups deviate from the mean by g/cm2, and we adopt this value as an additional statistical uncertainty. Because the refractivity used in simulation corresponds to dry air there is also an associated systematic error (see below).
The total statistical uncertainty on is found by adding above factors in quadrature. A distribution of the uncertainty for the showers in our final sample is shown in Extended Data Figure 6.
The energy resolution is 32% and is found by comparing energy scaling factors of the radio power and particle density fit (see Figure 1).
0.5 Systematic effects
The data has been subjected to several tests to find the systematic uncertainty on the reconstructed values for :
-
•
Zenith angle dependence The final data sample is split into two groups of equal size by selecting showers with a zenith angle below or above 32 degrees. For both groups the mean reconstructed is calculated, yielding deviations from the mean value of g/cm2. This spread is larger than expected from random fluctuations alone and is included as a systematic uncertainty. The dependence on zenith angle may be related with atmospheric uncertainties (see below).
-
•
Index of refraction of air As explained above, the index of refraction changes because of differences in atmospheric conditions. Fluctuations on due to changing humidity are of the order of 5 g/cm2 with respect to the mean. However, the index of refraction that was used in the radio simulations corresponds to dry air, and is a lower bound to the actual value. Therefore, the real value of can be higher than the reconstructed value but not lower, and we adopt an asymmetrical systematic uncertainty of g/cm2.
-
•
Hadronic interaction model Since the reconstruction technique is based on full Monte Carlo simulations, it is sensitive to the choice of hadronic interaction model that is used. It has been shown with a comparison between QGSJETII.04, SYBILL 2.1, and EPOS-LHC, that the uncertainty due to model dependence is g/cm2. Note that the uncertainty on the composition due to different models (in other words: on how to interpret the measured values) is of course larger.
-
•
Radiation code For this analysis we have used the radiation code CoREAS in which the contributions of all individual charges to radiation field are added together. The advantage of this microscopic approach is that it is completely model-independent and based on first principles. ZHAireS[5] is another microscopic code and gives very similar results[6]. To calculate the emission CoREAS uses the end-point formalism[7], while ZHAireS is based on the ZHS algorithm[8]. Both formalisms are derived directly from Maxwell’s equations and have been shown to be equivalent[9]. The other difference between CoREAS and ZHAires is that they take the particle distribution from different air shower propagation codes (CORSIKA and AIRES respectively) that internally use different hadronic interaction models. Since the radiation formalisms themselves are equivalent, small differences between CoREAS and ZHAireS are most likely due to differences in the hadronic interaction models used to simulate the particle interactions. The choice of radiation code does therefore not introduce an additional systematic uncertainty on top of the uncertainty to hadronic interaction models that is already included. A comparison study with LOFAR data did also not show any evidence for a systematic offset between the codes and will be published in an upcoming paper.
The remaining small dependence of on zenith angle is possibly related to the index of refraction. Showers with different inclination angles have their shower maximum at different altitudes, and therefore different local air pressure and index of refraction. Therefore, increasing the index of refraction used in simulations will result in a zenith-dependent change in reconstructed . This possibly removes the observed dependence of the composition on zenith angle. Correctly taking into account a complete atmospheric model for the profile of the refractivity of air is subject of further study. Here, we treat the effect conservatively by adding the first two contributions to the uncertainty linearly. The other two contribution are independent and are added in quadrature, yielding a total systematic uncertainty of g/cm2.
0.6 Statistical analysis
For each observed shower, we calculate:
| (2) |
where is the reconstructed , and and are mean values predicted by QGSJETII.04[19]. Thus is an energy-independent parameter that is mass sensitive. A pure proton composition would give a wide distribution of centered around zero, while a pure iron composition gives a narrower distribution around unity.
From the measurements we construct a cumulative distribution function (CDF) in the following Monte Carlo approach. A realisation of the data is made by taking the measured values for the energy and , adding random fluctuations based on the statistical uncertainty of these parameters, and calculating the parameters and the corresponding CDF. By constructing a large number of realisations with different random fluctuation, we can calculate the mean CDF and the region that contains 99% of all realisations. These are indicated in Figure 3 as the solid blue line and the shaded region respectively.
We fit theoretical CDFs based on composition with two or four mass components to the data. The test statistic in the fit is the maximum deviation between the data and the model CDFs. The p-value is given by the probability of observing this deviation, or a larger one, assuming the fitted composition model.
We first use a two-component model of proton and iron nuclei, where the mixing ratio is the only free parameter. The best fit is found for a proton fraction of 62%, but it describes the data poorly with a p-value of .
A better fit is achieved with a four-component model (p+He+N+Fe), yielding a p-value of 0.17. While the best fit is found for a Helium fraction of 80%, the fit quality deteriorates only slowly when replacing helium by protons. This is demonstrated in Figure 4 where the p-value is plotted for four-component fits where the fractions of helium and proton are fixed, and the ratio between N and Fe is left as the only free parameter. The solid line in this Figure contains the parameter space where . We construct a 99% confidence level interval on the total fraction of light elements (p+He) by finding the two extreme values of this fraction that still lie within the region.
The total fraction of light elements (p+He) is in the range [0.38,0.98] at 99% confidence level, with a best fit value of 0.8. The heaviest composition that is allowed within systematic uncertainties (see above) still has a best fit p+He fraction of 0.6, and a 99% confidence level interval of [0.18, 0.82].
References
- [1] Buitink, S. et al. [LOPES collaboration], Amplified radio emission from cosmic ray air showers in thunderstorms., Astron. Astrophys. 467, 385-394 (2007).
- [2] Schellart, P. et al. [LOFAR collaboration], Polarized radio emission from extensive air showers measured with LOFAR, JCAP 10, 14 (2014).
- [3] Abreu, P. et al. [Pierre Auger collaboration], Description of atmospheric conditions at the Pierre Auger Observatory using the Global Data Assimilation System (GDAS), Astropart. Phys. 35, 591-607 (2012).
- [4] Thoudam, S. et al. [LOFAR collaboration], LORA: A scintillator array for LOFAR to measure extensive air showers, Nucl. Instr. and Meth. in Phys. Res. A 767, 339-346 (2014).
- [5] Alvarez-Muñiz, J. et al., Monte Carlo simulations of radio pulses in atmospheric showers using ZHAireS, Astropart. Phys. 35, 325-341 (2012).
- [6] Huege, T. et al., The convergence of EAS radio emission models and a detailed comparison of REAS3 and MGMR simulations, NIMPA 662, 179-186 (2012).
- [7] James, C., Falcke, H., Huege, T. and Ludwig, M., General description of electromagnetic radiation processes based on instantaneous charge acceleration in “endpoints”., Phys. Rev. E 84, 056602 (2011).
- [8] Zas, E., Halzen, F., and Stanev. T., Electromagnetic pulses from high-energy showers: Implications for neutrino detection. Phys. Rev. D 45, 362-376 (1992).
- [9] Belov, K. et al. [SLAC T-510], Accelerator measurements of magnetically-induced radio emission from particle cascades with applications to cosmic-ray air showers [ eprint arXiv:1507.07296 ] (2015).
- [10] Thoudam, S. et al. [LOFAR collaboration], Measurement of the cosmic-ray energy spectrum above 1016 eV with the LOFAR Radboud Air Shower Array, Astropart. Phys. 73, 34-43 (2016).