The first X-ray imaging spectroscopy of
quiescent solar active regions with NuSTAR
Abstract
We present the first observations of quiescent active regions (ARs) using NuSTAR, a focusing hard X-ray telescope capable of studying faint solar emission from high temperature and non-thermal sources. We analyze the first directly imaged and spectrally resolved X-rays above 2 keV from non-flaring ARs, observed near the west limb on 2014 November 1. The NuSTAR X-ray images match bright features seen in extreme ultraviolet and soft X-rays. The NuSTAR imaging spectroscopy is consistent with isothermal emission of temperatures MK and emission measures cm-3. We do not observe emission above 5 MK but our short effective exposure times restrict the spectral dynamic range. With few counts above 6 keV, we can place constraints on the presence of an additional hotter component between 5 and 12 MK of cm-3 and cm-3, respectively, at least an order of magnitude stricter than previous limits. With longer duration observations and a weakening solar cycle (resulting in an increased livetime), future NuSTAR observations will have sensitivity to a wider range of temperatures as well as possible non-thermal emission.
Subject headings:
Sun: X-rays, gamma rays — Sun: activity — Sun: corona1. Introduction
The detailed process by which energy is released in the Sun’s atmosphere remains poorly understood. In active regions (ARs), the heating of material and acceleration of particles occur impulsively in flares, but even when there appear to be no flares, ARs still contain loops of material heated to several million Kelvin. One proposed solution is to have episodic heating, with events frequent enough to smooth out the time series (e.g. Glencross, 1975). Parker (1988) described this explanation in magnetohydrodynamic terms as the natural development of small current sheets in magnetic flux tubes that appear as coronal loops, and coined the term “nanoflare” to represent the idea, estimating that an individual event might contain the energy of a major flare. This coronal energy release would be driven by the movement of the magnetic loops’ footpoints. These need to be sufficiently slow (longer than the Alfvén time for wave propagation) otherwise waves would dominate and be an alternative heating mechanism (e.g. Klimchuk, 2006; Reale, 2014).
The nanoflare conjecture implies that the plasma temperature temporarily, and locally, will exceed the mean (Sturrock et al., 1990; Cargill, 1994, 2014; Reale, 2014). Individual nanoflares are likely to be so small that they will be difficult to detect, but their presence should be observable through the impact of an unresolved ensemble. The spectrum would contain a range of temperatures reflecting an assortment of nanoflares at different energies and stages of their energy redistribution. Extreme ultraviolet (EUV) observations with SDO/AIA and Hinode/EIS of non-flaring ARs typically show a Differential Emission Measure (DEM) peaked about 3 MK, steeply falling off to higher and lower temperatures (e.g. Warren et al., 2011, 2012; Del Zanna et al., 2015). The slope of the DEM is well studied over MK due to the number of EUV lines observable from quiescent regions, giving scalings of . This is consistent with high-frequency events, where the time between impulsive heatings is shorter than the cooling timescale (Cargill & Klimchuk, 2004; Reale, 2014). The higher temperature (5 MK) slope has considerably larger uncertainties, due to weaker EUV diagnostics. It appears to be steeper, with (Warren et al., 2012). Observed lines include Fe XVIII (SUMER; Teriaca et al., 2012) and Fe XIX (EUNIS; Brosius et al., 2014), with peak formation temperatures of 7.1 MK and 8.9 MK respectively. SDO/AIA 94Å can also be used to access Fe XVIII (Reale et al., 2011; Warren et al., 2011; Testa & Reale, 2012; Warren et al., 2012; Del Zanna, 2013).
The hottest material would produce X-ray emission but is difficult to detect given the expected weak signal and instruments designed for brighter flares. Hinode/XRT has been used with Hinode/EIS (Testa et al., 2011) and RHESSI (Schmelz et al., 2009; Reale et al., 2009) to constrain the high temperature component. X-ray spectrometers are required to robustly diagnose this hottest emission but there have been few instruments capable of quiescent AR observations: a Bragg crystal on a Skylark sounding rocket (Parkinson, 1975) and SMM’s Flat Crystal Spectrometer (FCS) (Schmelz et al., 1996; Del Zanna & Mason, 2014). These show weak emission from lines with peak formation temperatures up to 10 MK but emission mainly over 3-5 MK, with very steeply falling DEMs above 5 MK (Del Zanna & Mason, 2014). Observations above 2 keV typically have poorer spectral resolution but the bremsstrahlung continuum dominates. Temperature diagnostics from the continuum have the advantage of being insensitive to non-equilibrium ionization that can affect line measurements (e.g. Bradshaw & Mason, 2003). Full-disc observations of various “non-flaring” ARs have found higher temperatures of up to 11 MK with a SDO/EVE sounding rocket’s X123 (Caspi et al., 2015), 6.6 MK with CORONAS-Photon/SphinX (Miceli et al., 2012) and 6-8 MK with RHESSI (McTiernan, 2009).
If nanoflares are just energetically smaller versions of flares/microflares then they should also release stored magnetic energy in the form of accelerated electrons, as even the smallest microflares (GOES A,B-Class flares) show hard X-ray (HXR) emission (Lin et al., 1984; Hannah et al., 2008). Similar physics seems possible given that flare energies appear to behave as a power-law frequency distribution (e.g. Hannah et al., 2011), with the occurrence increasing with decreasing magnitude. Accelerated electrons are detectable in flares via their bremsstrahlung emission at higher X-ray energies (10 keV) but for quiescent periods these signatures have remained elusive. RHESSI has been prolific at observing flare/microflare HXRs but struggles with quiescent emission due to its indirect imaging and high non-solar background. Only high-temperature emission was found for quiescent ARs using RHESSI (McTiernan, 2009) and 3-200 keV upper limits for the quiet Sun (Hannah et al., 2007, 2010). The FOXSI sounding rocket has higher X-ray sensitivity and direct imaging and has briefly observed the Sun twice. It was able to constrain the high temperature emission from a non-flaring AR but has not detected anything non-thermal (Krucker et al., 2014; Ishikawa et al., 2014). The presence of accelerated electrons has been suggested from IRIS ultraviolet observation (Testa et al., 2014), as the rapid variability of intensities and velocities at hot coronal loop footpoints are consistent with simulations of heating by accelerated electron beams. However X-ray observations are needed to definitively detect non-thermal emission.
In this paper we present the first directly imaged and spectrally resolved X-rays above 2 keV from quiescent ARs using the Nuclear Spectroscopic Telescope Array (NuSTAR; Harrison et al. 2013). NuSTAR is the first focusing optics telescope that covers the HXR bandpass (2.5-78 keV) and has a higher sensitivity than RHESSI (Lin et al., 2002), with an effective area larger at keV and lower background. NuSTAR provides a unique X-ray view of the Sun but is not an optimized solar telescope. The solar pointings therefore present challenges, especially to use NuSTAR’s full sensitivity. We briefly discuss this in §2 and a full discussion is available in Grefenstette et al. (2016). In §3 we present NuSTAR X-ray images and spectroscopy of several ARs observed on 2014 November 1, showing detection of emission at MK. We determine constraints to the emission above 5 MK, which are an order of magnitude more restrictive than previous observations, in §4.
2. NuSTAR Solar Observations
NuSTAR carries two identical co-aligned mirror modules that focus onto two focal-plane modules (FPMA, FPMB). Each has a field of view (FoV) and FWHM of 18′′ (Madsen et al., 2015). The focal-plane modules are arrays of CdZnTe detectors each with pixels operated in a photon-counting mode. It has a useable energy-range of 2.5-78 keV with a resolution of keV FWHM below 20 keV. The effective area is well calibrated down to 3 keV, with only small deviations to 2.5 keV, becoming substantial at lower energies due to trigger threshold uncertainty (see Grefenstette et al., 2016). The readout time per event of 2.5 ms gives a maximum throughput of 400 counts sec-1 per module. The data are processed using the NuSTAR Data Analysis software v1.5.1 and NuSTAR CALDB 20150414111http://heasarc.gsfc.nasa.gov/docs/nustar/analysis/, generating an event list from which images/spectra are created. To reduce the effects of pile-up – multiple low energy photons being recorded as a single high energy count (e.g. Datlowe, 1975) – we restrict our analysis to single-pixel (“Grade 0”) events (Grefenstette et al., 2016). NuSTAR’s optics are such that objects outside the FoV can add to the detected background via photons that reflect only once, instead of twice for properly focused photons, allowing them to reach the focal plane as “ghost rays” (Madsen et al., 2015). These have a well-characterised shape and behaviour. Without detailed knowledge of the brightness and variability of the ghost ray sources, no corrections are possible. Optimal NuSTAR solar observations therefore require weak sources outside the target region.
The data in this paper are from the first solar science campaign on 2014 November 1 (Grefenstette et al., 2016), consisting of four orbits of observations (each about an hour). We present the analysis of the fourth orbit as it provides the most stable view of ARs near the west limb and has the highest livetime, with effective exposures of about and seconds.
3. NuSTAR Quiescent ARs
3.1. Time Profile and Image Mosaic
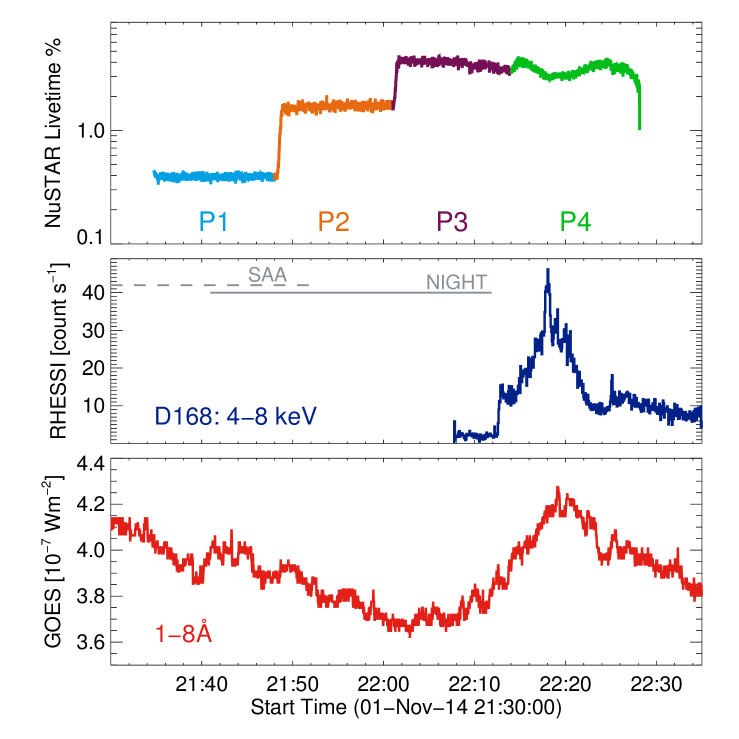
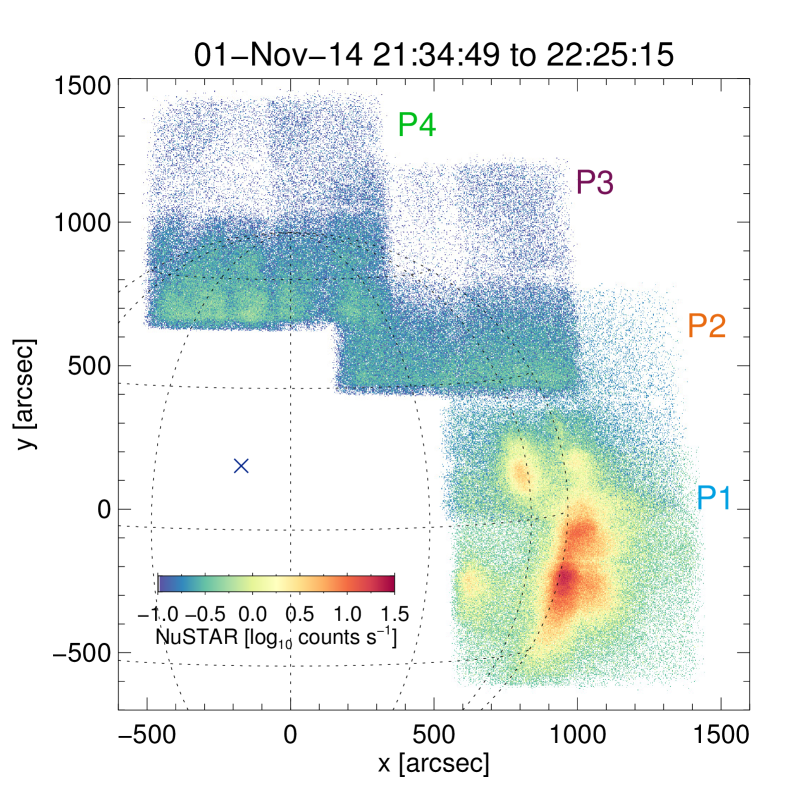
Figure 1 shows the fourth orbit observations starting 21:34 UT 2014 November 1, which consists of four pointings (P1, P2, P3, and P4) going from solar W to N. For the majority of this orbit the solar position was found by a single combination of star trackers, or Camera Head Units (CHUs; Walton et al. 2016). A given CHU combination is accurate to 1.5′ (Grefenstette et al., 2016) and varies with the pointing. The NuSTAR images from P1 and P2 are individually shifted to match the AR locations from the EUV/SXR images (see Figure 2). As there are no clear features in P3, the P2 shift was used. For P4 there are no sources and it is a different CHU combination, so data from the previous orbit during the same combination, while observing the ARs, were used for co-alignment.
The time series in Figure 1 compares the NuSTAR livetime percentage (averaged over FPMA and FPMB, individually similar) with the RHESSI and GOES observations. The NuSTAR livetime is very low (about 0.4) and near constant during P1, which is due to the quiescent ARs. These regions can be seen in the keV image in Figure 1, from FPMA and FPMB combined. In P2, the livetime increases due to fewer ARs in the FoV and increases further in P3 and P4 once there are no ARs in the FoV. In these pointings the background (blue-green in Figure 1) is ghost rays from ARs on the disk (the imaged limb ones and those elsewhere on the disk). The cross shape, most evident in P4, is from the gap between the detector quadrants. During P4 a small microflare occured outside NuSTAR’s FoV, detected by GOES and RHESSI, appearing as a dip in the NuSTAR livetime due to the increase in ghost rays. During the times when NuSTAR was directly imaging the limb ARs, the full disc GOES flux was Wm-2, mostly coming from ARs outside NuSTAR’s FoV. These ghost rays are about weaker than the directly imaged ARs (see Grefenstette et al., 2016) and so will have a negligible contribution.
3.2. X-ray and EUV Image Comparison
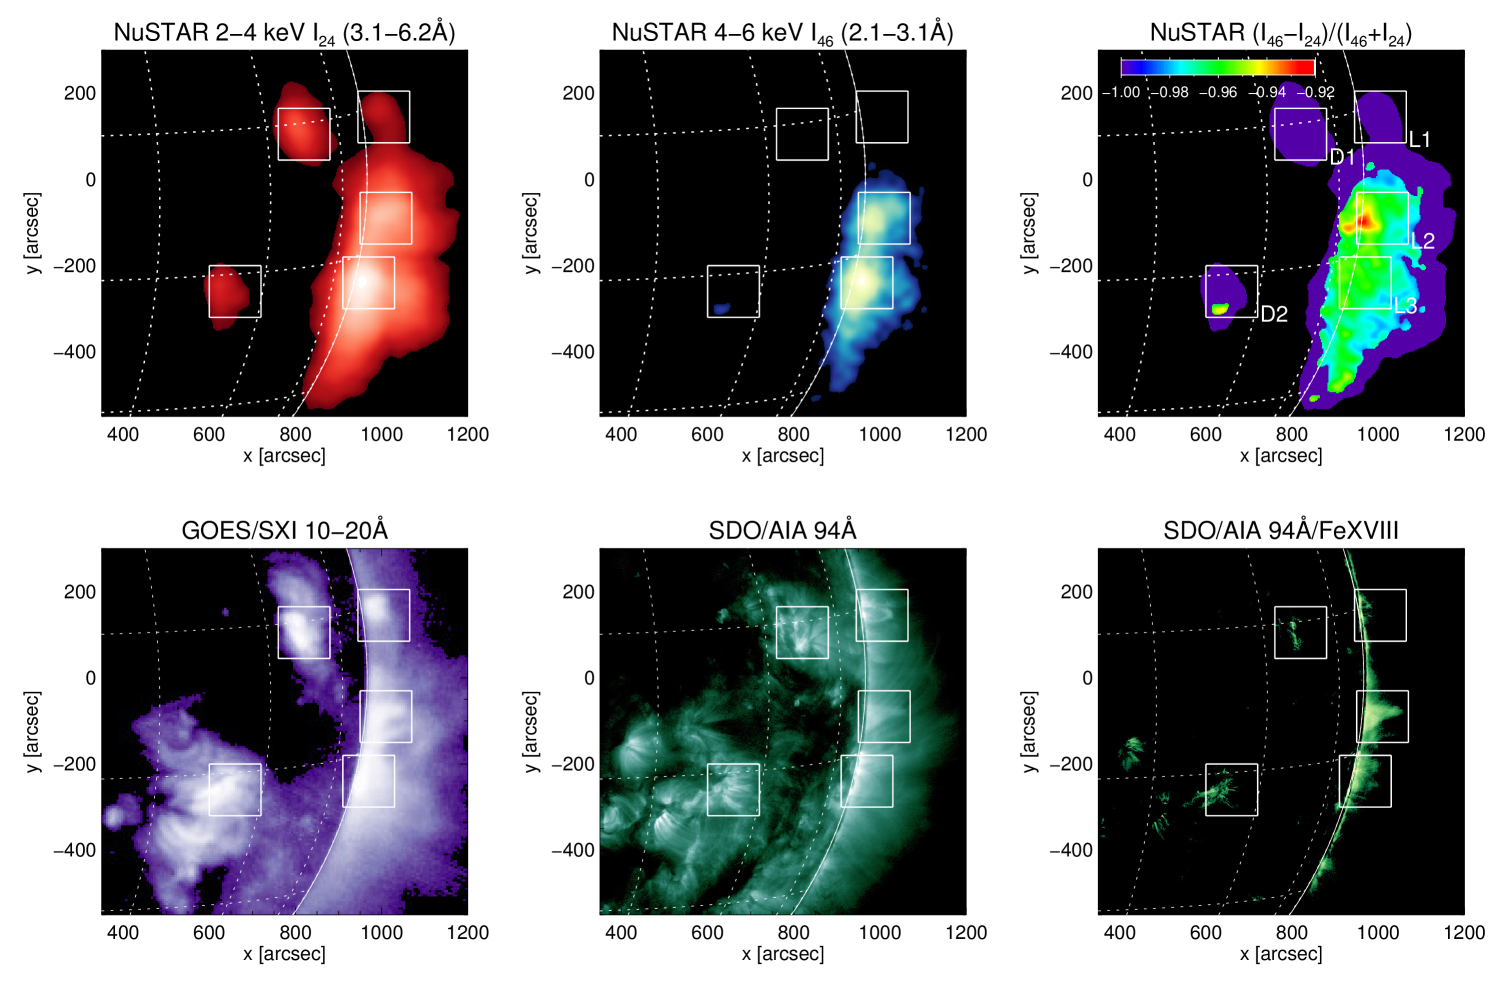
Combining the P1 and P2 data we produce 2-4 keV and 4-6 keV livetime-corrected images (with 7′′ Gaussian smoothing), and compare these to SDO/AIA EUV and GOES/SXI soft X-ray (SXR) images (Figure 2). The regions in EUV/SXR show little variability during the NuSTAR observation time, and those shown are averaged over that period.
In the NuSTAR 2-4 keV image there are five distinct regions which match features in the EUV/SXR images. They correspond to (and we label as) NOAA AR12195 (D1), AR12196 (D2), and above-the-limb sources (L1), highly occulted AR12192 (L2) and AR12194 (L3). The major region AR12192 produced several X-class flares when on the disk and contained expansive coronal loops, still visible above the limb in EUV/SXR. SDO/AIA 94Å’s temperature response contains cooler (0.5-1 MK) and hotter (3-10 MK) components (Testa et al., 2012; Boerner et al., 2014). So for comparison to the NuSTAR images we isolate the emission above 3 MK, from Fe XVIII (Warren et al., 2011; Del Zanna, 2013) (bottom right Figure 2). These show that the hottest emission is from more compact regions, the brightest from L2 and L3. This agrees with the NuSTAR 4-6 keV image, which only shows discernible emission from these locations. We also show the differential hardness ratio of the 4-6 keV () to 2-4 keV () emission, finding the highest spectral hardness in L2 and L3.
3.3. X-ray Imaging Spectroscopy
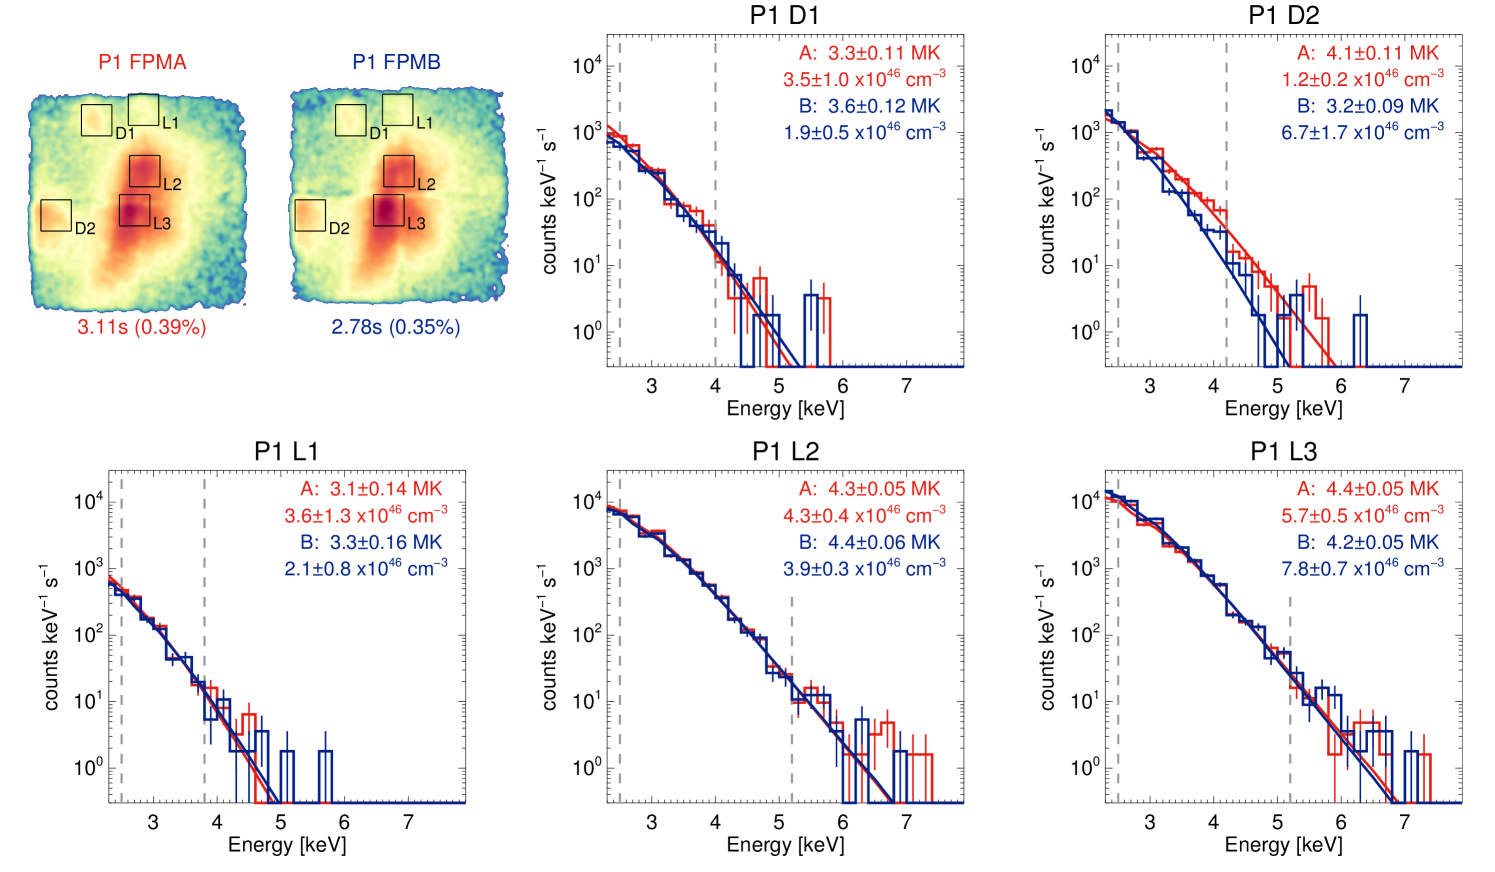
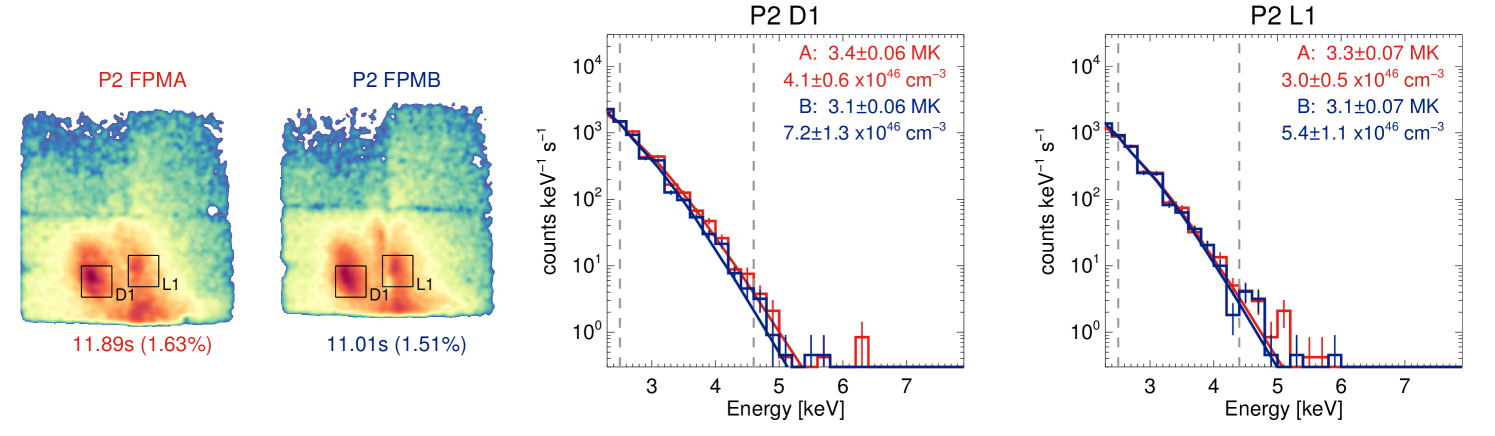
For each AR we accumulate the NuSTAR spectrum over a region (Figures 3 and 4). This is done separately for P1, P2 and FPMA, FPMB as the instrument response is different for each. These spectra are binned with 0.2 keV resolution and only include Grade 0 (single-pixel hit, minimizing pile-up) events, in the dominant CHU combination. To forward-fit a model to this data using SolarSoft/OSPEX222http://hesperia.gsfc.nasa.gov/ssw/packages/spex/doc/ we need a spectral response matrix (SRM) for each region, generated from the Redistribution Matrix and Ancillary Response Files (RMF, ARF) produced by the NuSTAR Data Analysis Software333http://heasarc.gsfc.nasa.gov/docs/nustar/analysis/.
Figure 3 and 4 shows forward-fits of CHIANTI 7.1 (Dere et al., 1997; Landi et al., 2013) isothermal models to each NuSTAR spectrum. We fit from 2.5 keV (the minimum useable energy) to the highest energy with counts per bin, so that the uncertainties are Gaussian (as OSPEX uses the chi-square test). These isothermal models fit the data well, with the few excess counts at higher energies consistent within Poisson statistics. Similar temperatures and emission measures are achieved for each region in FPMA and FPMB except for D2 (top right Figure 3). Here the FPMB spectrum is from the detector edge, where the ARF is poorly calibrated (Madsen et al., 2015) and there might be missing counts. The regions observed in both P1 and P2 show similar values for each fit, within the relative calibration (Grefenstette et al., 2016). The P2 values are more robust as the regions are closer to the imaging axis and observed with a higher effective exposure (about 11 s instead of 3 s).
We can compare the NuSTAR isothermal fits to the SDO/AIA observations of the regions by folding them through the 94Å temperature response (Boerner et al., 2014). We find that the NuSTAR fits reproduces 3-17% of the observed 94Å flux and 10-82% of the 94Å Fe XVIII flux, consistent with NuSTAR only observing part of the multi-thermal emission seen by SDO/AIA. This is due to the weak response of NuSTAR to cooler temperatures and the short effective exposure times (limiting the dynamic range of the spectra at higher energies). To improve our sensitivity to a faint high-temperature (or non-thermal) component we could increase our exposure by observing for longer (more than 790s) and/or during times of weaker solar activity (and hence achieve livetimes larger than 0.4% and 1.6%).
4. High Temperature Constraints
The NuSTAR spectra do not show additional high temperature (5 MK) or non-thermal emission, but we can calculate upper limits on this emission. We concentrate on the possible high temperature constraints as we know that hot plasma could be present (from EUV/SXR observations) and would have to be accounted for before non-thermal constraints are attempted.
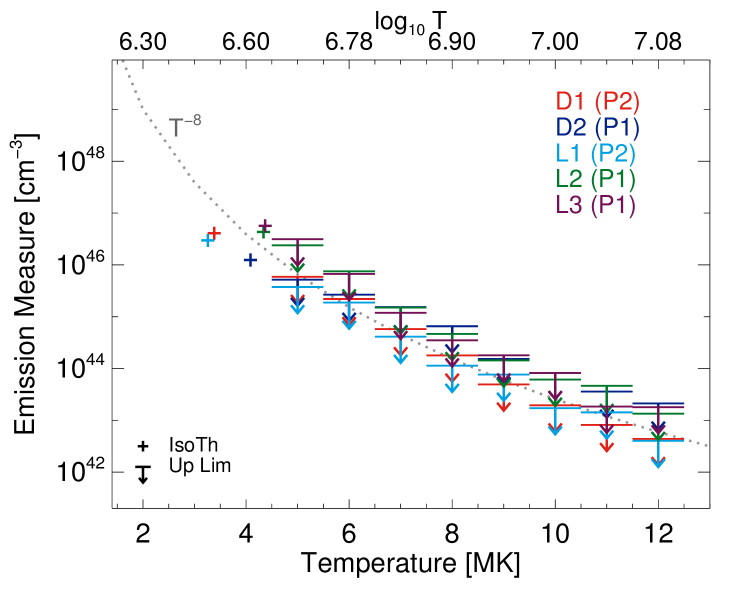
We determine the upper limits on the emission of an additional hotter component for all regions using FPMA (which has a slightly higher livetime) and P1 for D2, L2 and L3 and P2 for D1 and L1. A Monte Carlo approach is used with the livetime and SRM of each region to generate a synthetic NuSTAR spectrum of a two-component thermal model (one using the fitted thermal parameters, the other a chosen temperature between MK). The emission measure of the second component starts with a large value (that of the lower temperature fit) and is iteratively reduced until there are fewer than 4 counts above 6 keV, consistent within of a null detection (Gehrels, 1986). This is repeated for each temperature and region. The resulting upper limits (Figure 5) range from about cm-3 at 5 MK to cm-3 at 12 MK, with the lowest limits coming from the observations with the largest effective exposure, P2.
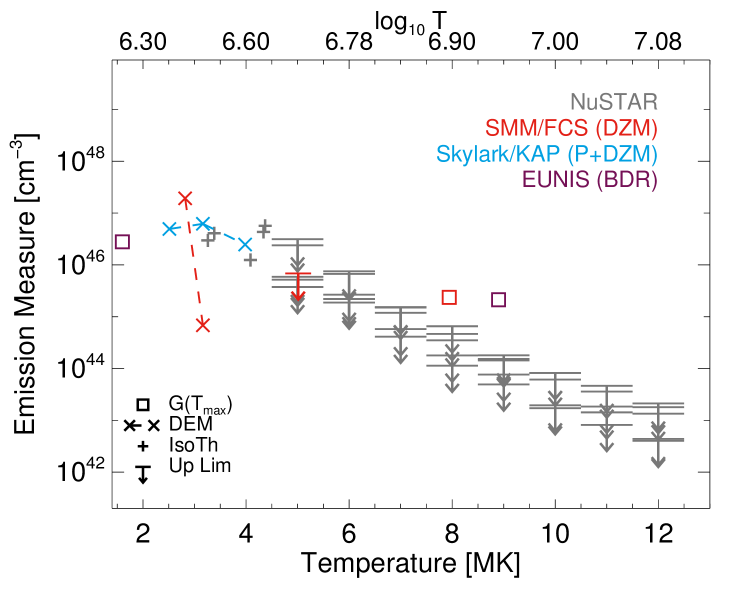
Compared to the observations from EUNIS (Brosius et al., 2014) and SMM/FCS (Del Zanna & Mason, 2014) the NuSTAR limits are at least an order of magnitude lower (Figure 5, middle panel). This might be due to these previous studies observing ARs with brighter hot emission. Even within the NuSTAR limits there is about an order of magnitude spread from the different regions. The high temperature values from EUNIS and SMM/FCS are calculated using the maximum of the contribution functions , an isothermal approach using the peak formation temperature. If the emission is due to a wider range of temperatures, and the DEM is expected to be sharply falling with temperature, then the actual emission is from lower temperatures. This “effective temperature” was calculated for SMM/FCS Fe XVIII (Del Zanna & Mason, 2014) giving emission at 5 MK, instead of the 8 MK using the peak formation temperature (red upper limit versus square in Figure 5, middle panel). The DEMs of quiescent ARs from X-ray spectroscopy (Parkinson, 1975; Del Zanna & Mason, 2014) show emission over 2-4 MK. The NuSTAR isothermal fits are consistent with the Skylark results but higher than the SMM/FCS. This again could be indicative of quiescent ARs producing a wide range of emission.
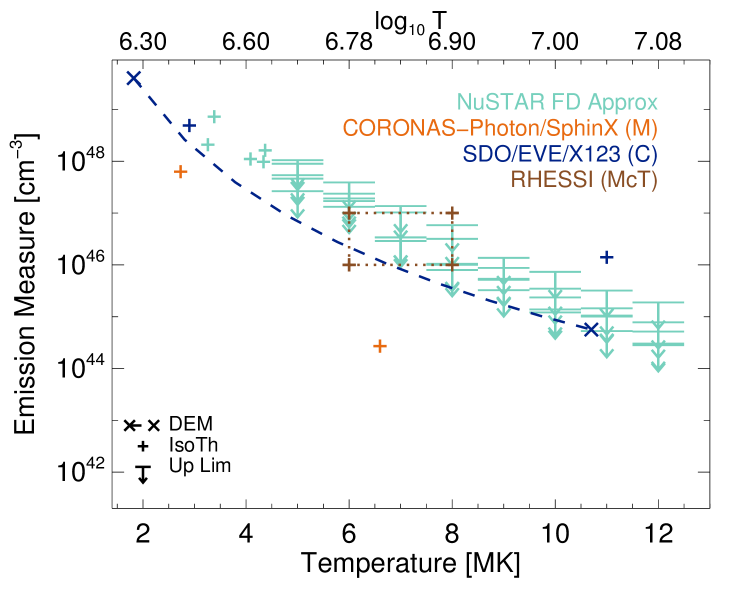
We scale the NuSTAR limits by the fraction of the SDO/AIA 94Å Fe XVIII emission in each region to compare to other full-disk X-ray spectroscopy of quiescent ARs. About 0.5% of the full-disk emission comes from D1, 1.1% for D2, 1.4% for L1, 4.4% for L2 and 3.5% for L3. These NuSTAR full disk limits (Figure 5, bottom panel) match the range of emission observed with RHESSI (McTiernan, 2009) and the DEM from X123 (Caspi et al., 2015). The SphinX two-thermal fit gives emission considerably lower than the scaled NuSTAR values, which is still consistent as they are upper limits. The SphinX values are small as they are from a period of very low solar activity and averaged over a month of observations.
5. Conclusions
NuSTAR is a uniquely sensitive telescope, capable of observing faint X-ray emission from the non-flaring Sun. This paper shows for the first time X-ray emission above keV directly imaged from quiescent ARs. The spectra of these regions are well fitted by 3.1-4.4 MK isothermal emission. We have not detected a higher temperature or non-thermal contribution to the HXR spectra for these ARs. We place strict constraints on hotter sources, requiring them to decrease with at least , which is consistent with impulsive heating models (e.g. Cargill, 1994; Klimchuk et al., 2008). To increase NuSTAR‘s spectral dynamic range, improving our ability to detect or further constrain high temperature and non-thermal contributions, we need observations with larger effective exposure times. This can be achieved by longer duration observations and/or diminishing solar activity (producing lower deadtime). Accessing NuSTAR‘s full sensitivity, combined with other new data from the FOXSI (Krucker et al., 2014) and MAGIXS (Kobayashi et al., 2011) sounding rockets, will provide crucial steps towards improved X-ray observations of the Sun and understanding the nature of its quiescent energy release.
References
- Boerner et al. (2014) Boerner, P. F., Testa, P., Warren, H., Weber, M. A., & Schrijver, C. J. 2014, Sol. Phys., 289, 2377
- Bradshaw & Mason (2003) Bradshaw, S. J., & Mason, H. E. 2003, A&A, 401, 699
- Brosius et al. (2014) Brosius, J. W., Daw, A. N., & Rabin, D. M. 2014, ApJ, 790, 112
- Cargill (1994) Cargill, P. J. 1994, ApJ, 422, 381
- Cargill (2014) —. 2014, ApJ, 784, 49
- Cargill & Klimchuk (2004) Cargill, P. J., & Klimchuk, J. A. 2004, ApJ, 605, 911
- Caspi et al. (2015) Caspi, A., Woods, T. N., & Warren, H. P. 2015, ApJ, 802, L2
- Datlowe (1975) Datlowe, D. W. 1975, Space Science Instrumentation, 1, 389
- Del Zanna (2013) Del Zanna, G. 2013, A&A, 558, A73
- Del Zanna & Mason (2014) Del Zanna, G., & Mason, H. E. 2014, A&A, 565, A14
- Del Zanna et al. (2015) Del Zanna, G., Tripathi, D., Mason, H., Subramanian, S., & O’Dwyer, B. 2015, A&A, 573, A104
- Dere et al. (1997) Dere, K. P., Landi, E., Mason, H. E., Monsignori Fossi, B. C., & Young, P. R. 1997, A&AS, 125, 149
- Gehrels (1986) Gehrels, N. 1986, ApJ, 303, 336
- Glencross (1975) Glencross, W. M. 1975, ApJ, 199, L53
- Grefenstette et al. (2016) Grefenstette, B. W., Glesener, L., Krucker, S., et al. 2016, ApJ, submitted
- Hannah et al. (2011) Hannah, I. G., Hudson, H. S., Battaglia, M., et al. 2011, Space Sci. Rev., 159, 263
- Hannah et al. (2010) Hannah, I. G., Hudson, H. S., Hurford, G. J., & Lin, R. P. 2010, ApJ, 724, 487
- Hannah et al. (2007) Hannah, I. G., Hurford, G. J., Hudson, H. S., Lin, R. P., & van Bibber, K. 2007, ApJ, 659, L77
- Hannah et al. (2008) Hannah, I. G., Krucker, S., Hudson, H. S., Christe, S., & Lin, R. P. 2008, A&A, 481, L45
- Harrison et al. (2013) Harrison, F. A., Craig, W. W., Christensen, F. E., et al. 2013, ApJ, 770, 103
- Ishikawa et al. (2014) Ishikawa, S.-n., Glesener, L., Christe, S., et al. 2014, PASJ, 66, 15
- Klimchuk (2006) Klimchuk, J. A. 2006, Sol. Phys., 234, 41
- Klimchuk et al. (2008) Klimchuk, J. A., Patsourakos, S., & Cargill, P. J. 2008, ApJ, 682, 1351
- Kobayashi et al. (2011) Kobayashi, K., Cirtain, J., Golub, L., et al. 2011, in Society of Photo-Optical Instrumentation Engineers (SPIE) Conference Series, Vol. 8147, Society of Photo-Optical Instrumentation Engineers (SPIE) Conference Series, 1
- Krucker et al. (2014) Krucker, S., Christe, S., Glesener, L., et al. 2014, ApJ, 793, L32
- Landi et al. (2013) Landi, E., Young, P. R., Dere, K. P., Del Zanna, G., & Mason, H. E. 2013, ApJ, 763, 86
- Lin et al. (1984) Lin, R. P., Schwartz, R. A., Kane, S. R., Pelling, R. M., & Hurley, K. C. 1984, ApJ, 283, 421
- Lin et al. (2002) Lin, R. P., Dennis, B. R., Hurford, G. J., et al. 2002, Sol. Phys., 210, 3
- Madsen et al. (2015) Madsen, K. K., Harrison, F. A., Markwardt, C. B., et al. 2015, ApJS, 220, 8
- McTiernan (2009) McTiernan, J. M. 2009, ApJ, 697, 94
- Miceli et al. (2012) Miceli, M., Reale, F., Gburek, S., et al. 2012, A&A, 544, A139
- Parker (1988) Parker, E. N. 1988, ApJ, 330, 474
- Parkinson (1975) Parkinson, J. H. 1975, Sol. Phys., 42, 183
- Reale (2014) Reale, F. 2014, Living Reviews in Solar Physics, 11, 4
- Reale et al. (2011) Reale, F., Guarrasi, M., Testa, P., et al. 2011, ApJ, 736, L16
- Reale et al. (2009) Reale, F., McTiernan, J. M., & Testa, P. 2009, ApJ, 704, L58
- Schmelz et al. (1996) Schmelz, J. T., Saba, J. L. R., Ghosh, D., & Strong, K. T. 1996, ApJ, 473, 519
- Schmelz et al. (2009) Schmelz, J. T., Kashyap, V. L., Saar, S. H., et al. 2009, ApJ, 704, 863
- Sturrock et al. (1990) Sturrock, P. A., Dixon, W. W., Klimchuk, J. A., & Antiochos, S. K. 1990, ApJ, 356, L31
- Teriaca et al. (2012) Teriaca, L., Warren, H. P., & Curdt, W. 2012, ApJ, 754, L40
- Testa et al. (2012) Testa, P., Drake, J. J., & Landi, E. 2012, ApJ, 745, 111
- Testa & Reale (2012) Testa, P., & Reale, F. 2012, ApJ, 750, L10
- Testa et al. (2011) Testa, P., Reale, F., Landi, E., DeLuca, E. E., & Kashyap, V. 2011, ApJ, 728, 30
- Testa et al. (2014) Testa, P., De Pontieu, B., Allred, J., et al. 2014, Science, 346, 1255724
- Walton et al. (2016) Walton, D. J., Madsen, K. K., Harrison, F. A., Grefenstette, B. W., & Stern, D. 2016, ApJ, submitted
- Warren et al. (2011) Warren, H. P., Brooks, D. H., & Winebarger, A. R. 2011, ApJ, 734, 90
- Warren et al. (2012) Warren, H. P., Winebarger, A. R., & Brooks, D. H. 2012, ApJ, 759, 141