The Likely Fermi detection of the supernova remnant SN 1006
Abstract
We report the likely detection of -ray emission from the northeast shell region of the historical supernova remnant (SNR) SN 1006. Having analyzed 7 years of Fermi LAT Pass 8 data for the region of SN 1006, we found a GeV gamma-ray source detected with significance. Both the position and spectrum of the source match those of HESS J1504418 respectively, which is TeV emission from SN 1006. Considering the source as the GeV -ray counterpart to SN 1006, the broadband spectral energy distribution is found to be approximately consistent with the leptonic scenario that has been proposed for the TeV emission from the SNR. Our result has likely confirmed the previous study of the SNRs with TeV shell-like morphology: SN 1006 is one of them sharing very similar peak luminosity and spectral shape.
Subject headings:
acceleration of particles — gamma rays: ISM — ISM: individual objects (SN 1006) — ISM: supernova remnants1. Introduction
As one of the few supernova remnants (SNRs) that were historically recorded by people from different countries or continents (Stephenson & Green, 2002; Stephenson, 2010), SN 1006 is of great interest and has been extensively studied at multiple energy bands. It is located far away from the Galactic plane, with a Galactic latitude of 145, in a relatively low ambient-density ( cm-3; e.g., Katsuda et al. 2009) environment. The long-term proper motion measurements of the shock front at optical narrow band, combined with the expanding velocity, implies a distance of 2.2 kpc for the SNR (Winkler et al., 2003). Multiwavelength emission from SN 1006 shows that the remnant has a diameter of 30′(or 19 pc at 2.2 kpc), with two main lobes located at northeast (NE) and southwest (SW) parts of the SNR’s disk-like region. While the interior of the SNR is dominated by thermal emission (e.g., Uchida et al. 2013), the shell is dominated by synchrotron emission which is bright in radio (Reynolds & Gilmore, 1986) and hard X-ray (Rothenflug et al., 2004; Winkler et al., 2014) bands.
SNRs are considered to be the main sites in the Milky Way for producing cosmic rays with energies up to a few 1015 eV. Charged particles are accelerated in their shock fronts due to the diffusive shock acceleration mechanism (e.g., Blandford & Eichler 1987). As for SN 1006, in addition to hard X-rays that indicate high-energy electrons accelerated to 100 TeV in the shock front (Koyama et al., 1995), very high energy (VHE; GeV) emission was also detected with the High Energy Stereoscopic System (HESS). The two HESS sources J1504418 and J1502421 correspond to the NE and SW shell regions respectively (Acero et al., 2010), with the former approximately 50% brighter than the latter. Given these, GeV -ray emission from SN 1006 has been searched in observations with the Large Area Telescope (LAT) onboard Fermi Gamma-ray Space Telescope (Fermi). Using 3.5 and 6 years of Fermi LAT data, only upper limits have been obtained by Araya & Frutos (2012) and Acero et al. (2015a), respectively. Combining the TeV spectrum with the GeV upper limits, a leptonic scenario, in which -ray photons arise from the inverse Compton (IC) scattering process, is favored for the -ray emission (Acero et al., 2010; Araya & Frutos, 2012; Acero et al., 2015a).
The Fermi upper limits already tightly constrain the models typically considered for young SNRs (e.g., Cas A: Acero et al. 2010, Araya & Cui 2010; Tycho: Giordano et al. 2012) or for SNRs having a TeV shell-like morphology (Acero et al., 2015a). Evidence for the interaction with a HI cloud in the SW limb region of SN 1006 has been reported by Miceli et al. (2014). With the release of the best Fermi LAT dataset (Pass 8 data) in early 2015 and the accumulation of 7 years data, detailed analysis of the -ray emission from SN 1006 is thus warranted. In this paper we report our analysis of the Fermi LAT data of the SN 1006 region and the likely detection of -ray emission in 0.15–300 GeV energy range from the NE region of the SNR.
2. Data Analysis and Results
2.1. Fermi LAT Data
LAT is a -ray imaging instrument that scans the whole sky every three hours and is basically conducting long-term -ray observations of GeV sources (Atwood et al., 2009). For this analysis we selected Fermi LAT Pass 8 events in the energy range from 150 MeV to 300 GeV centered at the SIMBAD position of SN 1006, which is (, ) = (15h02m221, 42∘05′490), obtained by Wright & Otrupcek (1990). The events below 150 MeV were excluded to reduce the effects of the Galactic background and the relatively large uncertainties of the instrument response function of the LAT in low energy range. The time period of the LAT data is from 2008-08-04 15:43:36 (UTC) to 2015-09-24 00:03:16 (UTC). Following the recommendations of the LAT team111http://fermi.gsfc.nasa.gov/ssc/data/analysis/scitools/, we included those events with zenith angles less than 90 degrees, which prevents the Earth’s limb contamination, and excluded the events with quality flags of ‘bad’.
2.2. Source Detection
We included all sources within 20 degrees centered at the position of SN 1006 in the Fermi LAT 4-year catalog (Acero et al., 2015b) to make the source model. The spectral forms of these sources are provided in the catalog. Spectral parameters of the sources within 5 degrees from SN 1006 were set as free parameters, and the other parameters were fixed at their catalog values. The background Galactic and extragalactic diffuse emission were also added in the source model with the spectral model gll_iem_v06.fits and the file iso_P8R2_SOURCE_V6_v06.txt, respectively, used. The normalizations of the diffuse components were set as free parameters.
We first performed standard binned likelihood analysis to the LAT data in the 1 GeV band using the LAT science tool gtlike in the science tools software package v10r0p5. The Instrument Response Functions (IRFs) of P8R2_SOURCE_V6 were used. Test Statistic (TS) maps obtained in this higher energy range would likely be better resolved in a possibly crowded region and source positions be better determined as well. With the fitted source model, we calculated the binned TS map (using gttsmap in the Fermi software package) of a region centered at SN 1006. All sources in the source model were considered and removed. The obtained residual TS map of the source region is shown in the top panel of Figure 1. Excess emission in the SN 1006 region was detected with a maximum TS value of 25. The TS value at a given position is a measurement of the fit improvement for including a source, and is approximately the square of the detection significance of the source (Abdo et al., 2010). Therefore, the excess was detected with significance. We noted that no catalog sources are within the square region, but there is an additional source in the top left corner of the TS map.
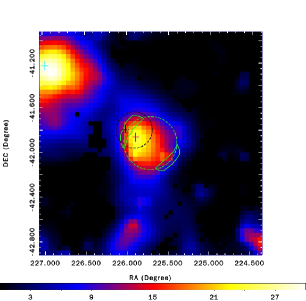
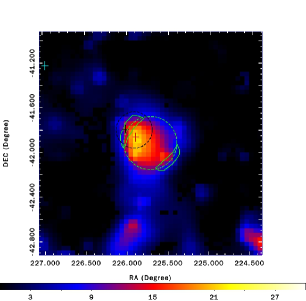
We investigated if the nearby additional source might contaminate the detection of the excess emission in the SN 1006 region. We ran gtfindsrc in the LAT software package, and determined its position: (, ) = (2270, 412) with 1 nominal uncertainty of 02. Adding the nearby source in the source model as a point source with power-law emission at its best-fit position, we re-performed the binned likelihood analysis. The TS map with this nearby source considered in the source model is shown in the bottom panel of Figure 1. Now with the nearby source totally removed, the maximum TS value for the excess emission in the SN 1006 region was 22, still significant. In the following analysis the nearby source was considered in the source model. For the confirmed excess source, we determined its position, which is (, ) = (2259, 418) with 1 nominal uncertainty of 01. The VHE source HESS J1504418 (Acero et al. 2010, marked in Figure 1) is 008 from the best-fit position and within the 1 error circle.
We then investigated whether the confirmed excess source is point-like or extended. Using both point-source and uniform disk models with power-law spectra at the best-fit position, we performed likelihood analysis to the data in 1–300 GeV energy range. The radius for the uniform disk was set in a range of 01–05 with a step of 01. The spectral parameters of the sources within 5 degrees from SN 1006 were set as free parameters, and all other parameters in the source model were fixed at their catalog values. No significant extended emission was detected. The TSext values, calculated from TSdisk TSpoint (see, e.g., Lande et al. 2012), were smaller than 0. We included the excess source as a point source in the source model with power-law emission and performed likelihood analysis in 0.15–300 GeV band. The photon index 0.3 and the photon flux photons s-1 cm-2 were obtained, with a TS value of 15.
2.3. Variability Analysis
In addition to the VHE source HESS J1504418, there is an another known source located in the 2 error circle of the best-fit position, that is the quasar QSO J15044152 (Winkler & Long, 1997). Its position is marked in Figure 1. Given that active galactic nuclei (AGN) are the dominant source class detected by Fermi LAT (Acero et al., 2015b), we thus searched for long-term variability for the purpose of checking any possible association between QSO J15044152 and the excess source. We calculated the variability index TSvar for the point source in SN 1006 region with 87 time bins (each bin constructed from 30-day data) in the energy range of 0.15–300 GeV, following the procedure introduced in Nolan et al. (2012). If the flux is constant, TSvar would be distributed as with 86 degrees of freedom. Variable sources would thus be identified with TSvar larger than 119.4 (at a 99% confidence level in the distribution; see Nolan et al. 2012). The computed TSvar for the source is 48.9, corresponding to a 1% confidence level for a variable source. The value indicates that there was no signifiant long-term variability observed in the -ray source.
2.4. Spectral Analysis
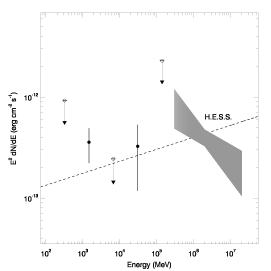
Considering the excess emission at the SN 1006 region as a point source at the best-fit position, we extracted its -ray spectrum by performing likelihood analysis to the LAT data in 5 evenly divided energy bands in logarithm from 0.15–300 GeV. The excess emission was modelled with a power law in each energy band. The fluxes obtained in this way are not dependent on the emission model assumed for a source, providing a good description for the -ray emission of the source. In the extraction, the spectral normalizations of the sources within 5 degrees from the central position of SN 1006 were set as free parameters, while all the other parameters of the sources were fixed at the values obtained from the above maximum likelihood analysis. The obtained spectrum is plotted in Figure 2, where we kept the data points with TS greater than 9 (corresponding to the detection significance of 3), and derived 95% flux upper limits otherwise. The fluxes (or flux upper limits) and TS values are provided in Table 1. We also estimated the systematic uncertainties for the spectral data points due to the Galactic diffuse emission model, by repeating the likelihood analysis in each energy band with the normalization of the diffuse component artificially fixed to the 6% deviation from the best-fit value (see e.g., Abdo et al. 2009, 2010a). The uncertainties estimated in this way are provided in Table 1, which have been considered together with the statistic ones in Figure 2.
3. Discussion and Summary
Having analyzed 7 years of Fermi LAT Pass 8 data, we found excess -ray emission at the SN 1006 region. As shown in Figure 1 and 2, both the position and spectrum (i.e., the high-energy data point at 30 GeV; see Table 1) match those of the TeV emission from the NE shell region of SN 1006 (see Acero et al. 2010 for details). The detected excess emission may well be the GeV counterpart to SN 1006 that has been previously searched (Araya & Frutos, 2012; Acero et al., 2015a). We tested to repeat the analysis in Acero et al. (2015a), where 6 years of P7REP data were used, and obtained the same non-detection result as theirs. Then as we changed to repeat our above analysis using Pass 8 data in the same 6 years time period, the 1 GeV excess emission was detected with TS. Therefore our detection of the source should be due to the overall sensitivity improvement in the Pass 8 data.
3.1. Model Fitting
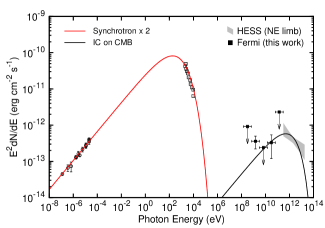
Considering the Fermi source as the GeV counterpart and combining its spectrum with the HESS TeV one, we checked if a leptonic model that has been proposed (see Acero et al. 2010; Araya & Frutos 2012; Acero et al. 2015a) could decribe the broadband spectrum of SN 1006. We employed a simple one-zone stationary model, in which the synchrotron and IC emission originates from the same population of electrons with a power-law form plus an exponential cutoff. Given the radio spectral index of 0.6 (e.g., Allen et al. 2001), the electron spectral index was set to . To fit the data, for which we have included radio (Allen et al., 2001), X-ray (Bamba et al., 2008), and GeV and TeV -ray, the required parameters were found to be: the cutoff energy TeV, the total electron energy erg, and the magnetic field strength 24 G. These parameter values are compatible with those considered in the previous leptonic models (see Araya & Frutos 2012; Acero et al. 2015a). The broadband spectral energy distribution (SED) and the model spectrum are shown in Figure 3, where because the radio and X-ray data were emission from the whole remnant, the synchrotron flux was multiplied by a factor of 2 in our calculation assuming a symmetry between the NE and SW parts for simplicity. Not surprisingly as indicated by the previous studies, the leptonic model generally can describe the broadband data. The observed flux at 1.5 GeV is higher than the model flux, but within the 2 uncertainty.
3.2. Summary
Analysis of the lastest Fermi LAT Pass 8 data for the SN 1006 region results in the detection of a source at a significance level in 0.15–300 GeV. The spectrum of the excess emission can be described by a power law (the dashed line in Figure 2), which can be connected to the HESS spectrum. Both the quasar QSO J15044152 (Winkler & Long, 1997) and the VHE source HESS J1504418 (Acero et al., 2010) are within the 2 error circle of the best-fit position of the source. We searched for variability in the source, but no significant variations were found. In addition the spectral index of 1.9 does not favor the association to AGN since AGN generally have soft power-law spectra with photon indices up to 3.0 in the LAT -ray energy range (Ackermann et al., 2015). All of these indicate the source is more likely the GeV counterpart to SN 1006.
The combined Fermi LAT and HESS spectrum can be described by a leptonic model with reasonable parameters, although the data point at 1.5 GeV is slightly higher than our model spectrum. The discrepancy may suggest that a more complicated model, e.g., multi-emission zones, would be needed in order to better fit the broadband SED. On the other hand, we note that the index is compatible with those of the other 4 (RX J1713.73946, RX J0852.04622, RCW 86, and HESS J1731347; ) TeV shell SNRs summarized by Acero et al. (2015a). This similarity may provide additional evidence for supporting the -ray excess emission as the counterpart to the SNR. At the source distance of 2.2 kpc, the 0.15–300 GeV luminosity is 1 erg s-1, estimated from the best-fit model. The luminosity value is consistent with the general emissional property for the currently Fermi detected SNRs: young SNRs (with ages no larger than a few thousands of years) have -ray luminosities of – erg s-1, while middle-aged, dynamically evolved SNRs are two orders of magnitude brighter due to their interaction with nearby molecular clouds (see, e.g., Xing et al. 2015 and references therein).
Finally, Miceli et al. (2014) have reported that the SW limb of SN 1006 is interacting with an atomic cloud, and predicted a 3–30 GeV flux of erg cm-2 s-1 based on their hadronic model proposed to explain the TeV emission. The flux is reached with the current Fermi LAT data (see Figure 2). However in our analysis, we did not see any significant sources in the SW region of SN 1006 (see Figure 1). A simple estimation for its flux can be used by scaling the NE flux with the ratio between the HESS SW and NE fluxes (0.67; Acero et al. 2010), which gives 1.5–3.4 erg cm-2 s-1 and 0.8–3.6 erg cm-2 s-1 at 1.5 and 30 GeV (Table 1), respectively. With the Fermi LAT observation time increasing for the source region, it can be expected that the SW GeV emission would likely be detected in the near future. The detection will help confirm our result presented here in this work.
Acknowledgements
This research made use of the High Performance Computing Resource in the Core Facility for Advanced Research Computing at Shanghai Astronomical Observatory. The research was supported by the Shanghai Natural Science Foundation for Youth (13ZR1464400), the National Natural Science Foundation of China for Youth (11403075), the National Natural Science Foundation of China (11373055), and the Strategic Priority Research Program “The Emergence of Cosmological Structures” of the Chinese Academy of Sciences (Grant No. XDB09000000). Z.W. acknowledges the support by the CAS/SAFEA International Partnership Program for Creative Research Teams. Y.C. and X.Z. acknowledge the support of NSFC grant 11233001 and 973 Program grant 2015CB857100.
| Band | TS | ||
|---|---|---|---|
| (GeV) | (GeV) | (10-13 erg cm-2 s-1) | |
| 0.32 | 0.15–0.69 | 9.2 | 2 |
| 1.47 | 0.69–3.14 | 3.61.30.4 | 10 |
| 6.71 | 3.14–14.35 | 2.4 | 1 |
| 30.68 | 14.35–65.60 | 3.32.10.0 | 10 |
| 140.29 | 65.60–300.00 | 23 | 3 |
Note: fluxes with uncertainties are given in energy bins with detection significance, and fluxes without uncertainties are the 95 upper limits. The first and second uncertainties are statistic and systematic ones, respectively.
References
- Abdo et al. (2009) Abdo, A. A., Ackermann, M., Ajello, M., et al. 2009, ApJ, 706, L1
- Abdo et al. (2010a) —. 2010a, ApJ, 718, 348
- Abdo et al. (2010) Abdo, A. A., Ackermann, M., Ajello, M., et al. 2010, ApJS, 188, 405
- Abdo et al. (2013) Abdo, A. A., Ajello, M., Allafort, A., et al. 2013, ApJS, 208, 17
- Acero et al. (2015a) Acero, F., Lemoine-Goumard, M., Renaud, M., et al. 2015a, A&A, 580, A74
- Acero et al. (2010) Acero, F., Aharonian, F., Akhperjanian, A. G., et al. 2010, A&A, 516, A62
- Acero et al. (2015b) Acero, F., Ackermann, M., Ajello, M., et al. 2015b, ApJS, 218, 23
- Ackermann et al. (2015) Ackermann, M., Ajello, M., Atwood, W. B., et al. 2015, ApJ, 810, 14
- Allen et al. (2001) Allen, G. E., Petre, R., & Gotthelf, E. V. 2001, ApJ, 558, 739
- Araya & Cui (2010) Araya, M., & Cui, W. 2010, ApJ, 720, 20
- Araya & Frutos (2012) Araya, M., & Frutos, F. 2012, MNRAS, 425, 2810
- Atwood et al. (2009) Atwood, W. B., Abdo, A. A., Ackermann, M., et al. 2009, ApJ, 697, 1071
- Bamba et al. (2008) Bamba, A., Fukazawa, Y., Hiraga, et al. 2008, PASJ, 60, S153
- Blandford & Eichler (1987) Blandford, R., & Eichler, D. 1987, Phys. Rep., 154, 1
- Giordano et al. (2012) Giordano, F., Naumann-Godo, M., Ballet, J., et al. 2012, ApJ, 744, L2
- Katsuda et al. (2009) Katsuda, S., Petre, R., Long, K. S., et al. 2009, ApJ, 692, L105
- Koyama et al. (1995) Koyama, K., Petre, R., Gotthelf, E. V., et al. 1995, Nature, 378, 255
- Lande et al. (2012) Lande, J., Ackermann, M., Allafort, A., et al. 2012, ApJ, 756, 5
- Miceli et al. (2014) Miceli, M., Acero, F., Dubner, G., et al. 2014, ApJ, 782, L33
- Nolan et al. (2012) Nolan, P. L., Abdo, A. A., Ackermann, M., et al. 2012, ApJS, 199, 31
- Reynolds & Gilmore (1986) Reynolds, S. P., & Gilmore, D. M. 1986, AJ, 92, 1138
- Rothenflug et al. (2004) Rothenflug, R., Ballet, J., Dubner, G., et al. 2004, A&A, 425, 121
- Stephenson (2010) Stephenson, F. R. 2010, Astronomy and Geophysics, 51, 27
- Stephenson & Green (2002) Stephenson, F. R., & Green, D. A. 2002, Historical supernovae and their remnants, by F. Richard Stephenson and David A. Green. International series in astronomy and astrophysics, vol. 5. Oxford: Clarendon Press, 2002, ISBN 0198507666, 5
- Uchida et al. (2013) Uchida, H., Yamaguchi, H., & Koyama, K. 2013, ApJ, 771, 56
- Winkler & Long (1997) Winkler, P. F., & Long, K. S. 1997, ApJ, 486, L137
- Winkler et al. (2003) Winkler, P. F., Gupta, G., & Long, K. S. 2003, ApJ, 585, 324
- Winkler et al. (2014) Winkler, P. F., Williams, B. J., Reynolds, S. P., et al. 2014, ApJ, 781, 65
- Wright & Otrupcek (1990) Wright, A., & Otrupcek, R. 1990, in PKS Catalog (1990), 0
- Xing et al. (2015) Xing, Y., Wang, Z., Zhang, X., & Chen, Y. 2015, ApJ, 805, 19