Search for Gamma-ray Emission from Dark Matter Annihilation in the Small Magellanic Cloud with the Fermi Large Area Telescope
Abstract
The Small Magellanic Cloud (SMC) is the second-largest satellite galaxy of the Milky Way and is only 60 kpc away. As a nearby, massive, and dense object with relatively low astrophysical backgrounds, it is a natural target for dark matter indirect detection searches. In this work, we use six years of Pass 8 data from the Fermi Large Area Telescope to search for gamma-ray signals of dark matter annihilation in the SMC. Using data-driven fits to the gamma-ray backgrounds, and a combination of N-body simulations and direct measurements of rotation curves to estimate the SMC DM density profile, we found that the SMC was well described by standard astrophysical sources, and no signal from dark matter annihilation was detected. We set conservative upper limits on the dark matter annihilation cross section. These constraints are in agreement with stronger constraints set by searches in the Large Magellanic Cloud and approach the canonical thermal relic cross section at dark matter masses lower than 10 GeV in the and channels.
pacs:
95.35.+d,95.30.Cq,98.35.GiI INTRODUCTION
It has been clear for many decades that the observed Universe includes a significant component of matter which does not interact like any known field in the Standard Model of particle physics. Though solid observational evidence exists for the gravitational influence of this dark matter (DM) from the earliest moments of the Universe’s history to the present day Zwicky (1933); Rubin et al. (1980); Olive (2003); Ade et al. (2014), no direct measurements have been made of the particle nature of this mysterious substance.
Though by no means the only possibility, a theoretically well motivated class of DM models has interactions between itself and the Standard Model that are approximately as strong as the weak nuclear force, and a mass of similar scale (10–1000 GeV). Such weakly interacting massive particles (WIMPs) would generically attain the observed DM density after thermal freeze-out in the early Universe. The canonical “WIMP” is a 100 GeV particle interacting through the weak force, though many other candidates have been proposed with a wide range of masses and interaction strengths Feng and Kumar (2008).
These models provide a useful benchmark for DM searches designed to look for the present-day pair annihilation (or decay) of DM particles in regions of high density of DM. A thermally-averaged annihilation cross section of cm3/s results in approximately the correct WIMP relic density, and so experiments capable of seeing the present-day annihilation of DM with cross sections near this value have the sensitivity to either confirm or exclude a large number of theoretically interesting models.
Within the paradigm of annihilating DM, there are many possibilities for the annihilation channel. Of particular interest is annihilation resulting in gamma rays, as this signature is more easily distinguished from other astrophysical sources. However this annihilation channel is suppressed; thus, searches for this signature are challenging. In addition to the direct annihilation to pairs of photons, if DM annihilates into pairs of other Standard Model particles, the resulting hadronization and/or decay will result in a continuum of gamma rays observable from Earth with an energy distribution that extends up to the rest mass of the DM particle. Gamma rays are also relatively unaffected by the intervening medium and arrive at the Earth unscattered and unattenuated (at least in the local Universe), which allows the emission to be tracked. Gamma-ray observations together with separate information or assumptions about the distribution of DM in the region under study and models for the hadronization then allow measurement, or determination of upper limits for, the annihilation cross section.
With this motivation in mind, the gamma-ray data set compiled by the Large Area Telescope (LAT) carried by the Fermi Gamma-ray Space Telescope (Fermi-LAT) is of great interest. At the present time, the Fermi-LAT is one of the most sensitive instruments to DM with weak-scale mass and cross section annihilating into gamma rays. Analysis of the LAT gamma-ray data can place strong limits on—or discover—DM annihilation with cross sections near the canonical thermal value into a wide variety of Standard Model particles Atwood et al. (2009).
A large number of DM searches have been performed using the Fermi-LAT data; as annihilation rates are proportional to the square of the DM density, lower annihilation cross sections can be probed by targeting regions of the sky with the greatest densities of DM, such as the center of the Milky Way Abazajian and Kaplinghat (2012); Abazajian et al. (2014); Boyarsky et al. (2011); Daylan et al. (2014); Goodenough and Hooper (2009); Gordon and Macias (2013); Hooper and Goodenough (2011); Hooper and Linden (2011); Hooper et al. (2013a); Hooper and Slatyer (2013); Huang et al. (2013); Ajello et al. (2016), satellite dwarf spheroidal galaxies of the Milky Way Ackermann et al. (2011, 2014); Geringer-Sameth and Koushiappas (2011); Geringer-Sameth et al. (2015a); Ackermann et al. (2015a); Geringer-Sameth et al. (2015b); Drlica-Wagner et al. (2015), unresolved halo substructure Ackermann et al. (2012); Belikov et al. (2012); Berlin and Hooper (2014); Buckley and Hooper (2010), galaxy clusters Ackermann et al. (2010); Dugger et al. (2010), and the Large Magellanic Cloud Buckley et al. (2015).
The LAT observations of the Galactic center indicate that the region is brighter than expected from standard models for Galactic diffuse emission in the few-GeV range, and the spatial distribution is broadly consistent with our expectations for a DM signal. However, previously unconsidered astrophysical backgrounds could match the observed morphology and spectrum Abazajian (2011); Wharton et al. (2012); Hooper et al. (2013b); Carlson and Profumo (2014); Petrovic et al. (2015, 2014); Mirabal (2013), and the true source of the gamma rays remains a subject of much debate.
Considering both the broad interest in indirect searches for DM, and the current questions raised by the Galactic center excess, it is important to identify new high-density targets for DM annihilation indirect searches. Here we apply the techniques developed in the search for DM in the Large Magellanic Cloud (LMC) Buckley et al. (2015), to a similar analysis of the Small Magellanic Cloud (SMC). The SMC is a satellite galaxy of the Milky Way, approximately 60 kpc away and with a DM mass of 10 within a radius of 3 kpc Bekki and Stanimirovic (2009). The SMC is in a complicated orbit with its larger cousin the LMC Besla et al. (2010), and the combined Magellanic system appears to be on its first approach to the Milky Way Besla et al. (2007); Kallivayalil et al. (2013). Therefore, the Clouds are not expected to have been substantially tidally stripped of DM by our Galaxy. Though the SMC DM profile may be affected by its interactions with the LMC, direct measurements of the rotation curve of the SMC indicate significant amounts of DM remain bound to the galaxy itself. As we shall demonstrate in this paper, the combination of rotation curves and comparison with cosmological simulations of galaxies of the same size that include baryonic physics indicates that at minimum the amount of DM present in the SMC would result in a DM annihilation signal as large as the brightest dwarf galaxies, though somewhat dimmer than the LMC itself. This lower signal is offset by the lower gamma-ray background in the SMC compared to the LMC, as modeled using Fermi-LAT data Abdo et al. (2010), and as a result the SMC is an attractive target for DM indirect detection searches.
In Section II, we describe the DM distribution in the SMC and how it relates to searches for indirect signals of DM annihilation. In Section III, we discuss the Fermi-LAT instrument, the method of modeling the SMC as a gamma-ray source, and the data set and background models used for the DM analysis. The analysis techniques and the resulting bounds are shown in Sections IV and V, and we conclude in Section VI.
II SMC DARK MATTER DISTRIBUTION
The flux spectrum of gamma rays from any distribution of DM depends on a number of quantities, which can be factored into astrophysics- and particle physics-dependent terms Ullio et al. (2002):
| (1) |
The quantities in the first parentheses are the annihilation cross section-speed product averaged over the velocity distribution of the DM particles , the differential yield of gamma rays from a single DM annihilation , the mass of the DM particle , and a normalization factor which is unity if the DM is its own antiparticle and if it is not. All of these depend on the unknown microphysics in the dark sector. The typical approach of DM indirect detection searches, as we will follow here, is to place an upper bound (if no excess is observed) on as a function of mass , assuming a particular spectrum and value for , the result of making a particular choice for the DM annihilation channel. In this paper, we assume and consider the final states and , which have been of particular interest given the Galactic center excess. Other sets of Standard Model final states are possible, but have sufficient similarity to the channels selected that bounds can reasonably be extrapolated. In this work, we calculate the spectrum for each final state and DM mass choice using code available as part of the Fermi-LAT ScienceTools.111The DMFitFunction spectral model described at http://fermi.gsfc.nasa.gov/ssc/data/analysis/documentation/Cicerone/Cicerone_Likelihood/Model_Selection.html, see also Ref. Jeltema and Profumo (2008). Note that our implementation does not include electroweak corrections Kachelrieß and Serpico (2007); Berezinsky et al. (2002); Kachelrieß et al. (2009); Ciafaloni and Urbano (2010); Ciafaloni et al. (2011). Such corrections can be important for heavy DM ( TeV); in any case, they would increase the resulting flux and thus strengthen the resulting bounds Ciafaloni et al. (2011); Cirelli et al. (2011); Ackermann et al. (2015b).
In order to describe experimental results in terms of the particle physics quantities in Eq. (1), the astrophysical quantities in the second set of parentheses must be known. This quantity, the integral of the square of the DM density along the line of sight and over a solid angle corresponding to the region under study, is known as the -factor, and encapsulates the dependence of an indirect detection search on the distribution of DM in the search target. As the -factor depends on the density squared for annihilating DM and implicitly on inverse distance squared, targeting nearby overdensities of DM yields larger values of the -factor and thus results in searches that probe smaller annihilation cross sections . In order to extract results from an analysis of the SMC that can be compared with indirect detection searches targeting other astrophysical objects, we must determine the DM density distribution of the SMC, and from this calculate the -factor.
Our fit to the SMC density profile as a function of radius is parametrized in terms of a generalized Navarro-Frenk-White (NFW) profile Hernquist (1990); Navarro et al. (1996); Zhao (1996); Kravtsov et al. (1998)
| (2) |
where is a scale radius, is a maximum radius which we set to kpc (our results are relatively insensitive to this choice), is a normalization factor, is the Heaviside step-function, and control the inner and outer slopes of the profile. The classical NFW profile has . We will determine the best fit for the free parameters , , and to the SMC in two ways: first by using observations of the SMC to directly build the rotation curve and from there infer the DM in the inner regions, and second by comparing the SMC to similar galaxies drawn from cosmological simulations.
Proper motion data for the LMC indicate that it may be on its first infall into the Milky Way’s DM halo Besla et al. (2007). The LMC and SMC are likely a pair of dwarf galaxies that are being accreted to the Milky Way together. Both the Magellanic Bridge (H I gas joining the two galaxies) and the Magellanic Stream (H I gas trailing the orbit of the Clouds) are best explained by tidal interactions between the two galaxies before infall into the Milky Way Besla et al. (2012). As the smaller of the two galaxies, this may mean that the SMC has been tidally harassed by the LMC, leading to a somewhat complicated structure. The SMC is elongated along our line of sight, with a bar-like body that we may be viewing end-on (see e.g. Refs. Haschke et al. (2012); Scowcroft et al. (2015); de Grijs and Bono (2015)). In fact, it has been suggested that the stellar bar of the LMC is a remnant of a passage by the SMC through the LMC, leading to a bar that is elevated above the LMC’s disk plane Besla et al. (2012). Despite these complications, we demonstrate below that simple DM halo models derived from isolated halos provide a remarkably good fit to the observed rotation curve of the SMC.
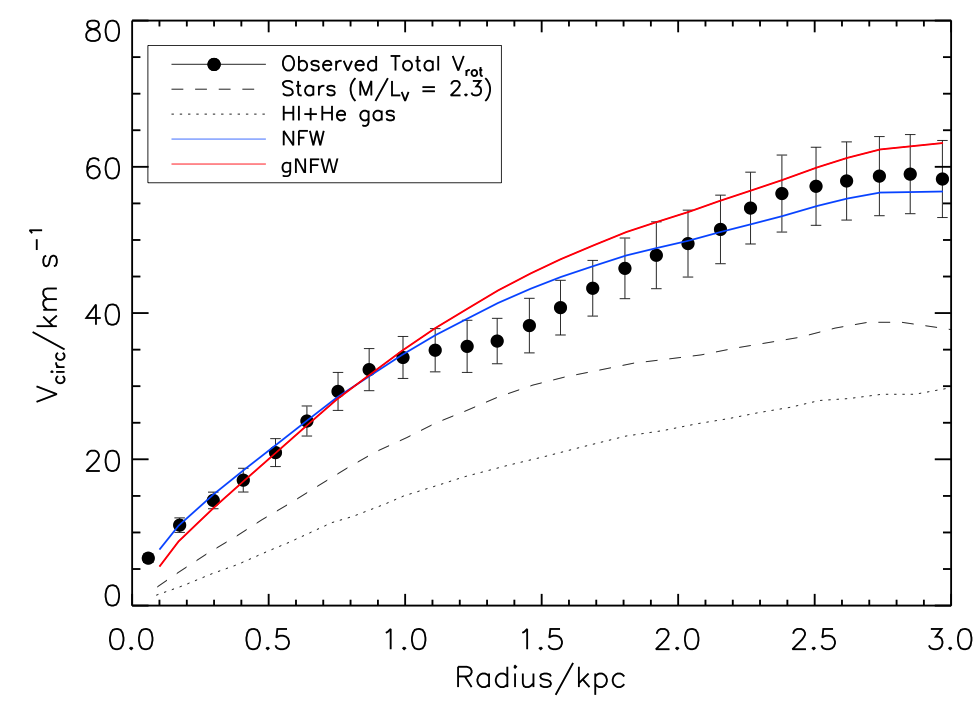
Under the assumption of circular orbits, the rotational velocity of a galaxy is a direct measurement of the mass enclosed as a function of radius, . The contribution of DM to the H I rotation curve of the SMC has been studied in detail by Refs. Stanimirovic et al. (2004); Bekki and Stanimirovic (2009), and we adopt some of their results in this work. To briefly summarize, Ref. Stanimirovic et al. (2004) fit a tilted ring model to the H I data, and corrected for asymmetric drift (the velocity dispersion of the SMC is fairly large, contributing as much dynamical support as the rotational support at some radii). A mean inclination of was found. By fitting an exponential disk with a scale height of 1 kpc, the H I+He mass of the SMC was found to be 5.6108 M⊙. Ref. Bekki and Stanimirovic (2009) adopted , and explored varying stellar mass-to-light ratios (, where is the -band luminosity of 4.3108 ). Based on the SMC’s derived star formation history Harris and Zaritsky (2004), Ref. Bekki and Stanimirovic (2009) suggest that in the range of 2–4 is reasonable. They adopt 2.3 as their fiducial model, giving a SMC stellar mass of 9.9108 M⊙ with kpc.
In Figure 1 we show the rotation curve data, adopted from Ref. Bekki and Stanimirovic (2009). We assume , and 9.9108 M⊙ (i.e., 2.3). The lines show the contribution from the H I+He gas, the stellar component, and the model that best fits both the inner and outer observed total rotation curve. This model has an NFW profile, and is denoted as the NFW model for the remainder of the paper.
As in Ref. Buckley et al. (2015), we also use state-of-the-art cosmological simulations to determine the “typical” DM density profile for a galaxy with the stellar mass of the SMC. We use a set of simulations that have shown that energetic feedback from stars and supernovae can transform an initially steep inner density profile into a shallower profile Governato et al. (2012); Teyssier et al. (2013); Di Cintio et al. (2014). The degree of transformation is sensitive to the mass of stars formed Penarrubia et al. (2012); Di Cintio et al. (2014), and the stellar mass is dependent on halo mass Behroozi et al. (2013); Moster et al. (2013). These simulations have been shown to match the observed stellar-to-halo mass relation at redshift [94]. Ref. Cintio et al. (2014) has provided a general relation for the generalized NFW parameters (, , ) as a function of stellar-to-halo mass ratio. Therefore, we can extract a range of generalized NFW profiles appropriate for the SMC from simulations.
To find the generalized NFW parameters that best describe the SMC, we searched for simulated galaxies in the available set that have a luminosity in the same range as the SMC. We adopt a stellar mass for the SMC in the range 4–16 (by adopting a luminosity of and ). Five simulated galaxies were in this stellar mass range, and had . We averaged the generalized profile from Ref. Di Cintio et al. (2014) at these two extremes, and found it to yield a remarkably good fit to the observed rotation curve when added to the stellar and H I contributions, shown by the red line in Figure 1. This model is referred to as the gNFW model below.
In Table 1, we summarize the two DM profiles, NFW and gNFW, which we will use for the remainder of the analysis. We explore both profiles because they span a range of density profiles consistent with the observations. The NFW model was shown by Ref. Bekki and Stanimirovic (2009) to be a good fit to the observed rotation curve, and has the expected steep DM density profile that is consistently produced in -body simulations of galaxy formation in Cold Dark Matter (CDM). However, observations and recent simulations that include energy feedback from stars suggest that the slopes of the DM density profiles of galaxies with the stellar mass of the SMC should be much shallower than NFW (Refs. Governato et al. (2012); Teyssier et al. (2013); Di Cintio et al. (2014); Penarrubia et al. (2012)). Adopting these two models allows us to explore the range of allowed profiles. The -factors for each profile were calculated assuming an SMC distance of 60 kpc Graczyk et al. (2014). We adopt as the center of the SMC the reported stellar kinematic center at J2000 epoch , though we will later scan over the possible central location when performing our fit. As can be seen, the resulting -factors of 19.1–19.6 are competitive with the best dwarf galaxies, which have 19–19.5 Martinez (2015); Geringer-Sameth et al. (2015c). For comparison, the Galactic center, integrated over the inner , has 21–24 Daylan et al. (2014), and the LMC has 19.5–20.5 Buckley et al. (2015). We should emphasize that it is possible for the SMC DM to be more concentrated in the inner region, resulting in a significantly larger -factor; however to set conservative lower limits we adopt this lower range.
| Profile | (kpc) | (M) | (GeV2/cm5) | |||
|---|---|---|---|---|---|---|
| NFW | 1 | 3 | 1 | 5.1 | ||
| gNFW | 5 |
III FERMI-LAT OBSERVATIONS OF THE SMC
The Fermi-LAT is a pair-conversion telescope. Incoming gamma rays pass through the anti-coincidence detector and convert in the tracker to pairs. The charged particle direction is reconstructed using the information in the tracker, and the energy is estimated from depositions in the calorimeter. Detailed descriptions of the LAT and its performance can be found in dedicated papers Atwood et al. (2009, 2012).
The SMC was detected in gamma rays for the first time by the LAT Abdo et al. (2010). The analysis of 17 months of all-sky observations led to the detection of an extended source 3 in size, approximately the angular size of the SMC in various bands, with a significance of about 11. The emission is steady and has an integrated MeV photon flux of ph/cm2/s. No obvious spatial correlation of the gamma-ray emission with known components of the SMC was observed, which made it hard to pinpoint the origin of the emission.The spectrum of the emission was consistent with emission arising from cosmic rays interacting with the interstellar medium in the SMC, but a population of high-energy pulsars could also account for a substantial fraction of the signal.
Compared to this early work, about five times more Fermi-LAT data are now available, and these include improvements in instrument calibration, event reconstruction, and background rejection ( the upgrade from Pass 6 to Pass 8 data; see Section III.2). We have revisited the study of the gamma-ray emission from the SMC based on this enlarged data set, and the full analysis will be presented elsewhere (Fermi-LAT Collaboration, 2016, in prep.). We briefly summarize below the results of the analysis, focusing on what is relevant to the present work. Understanding the methodology and uncertainties associated with the modeling of the gamma-ray emission of the SMC defines the limitations of searching for DM signals in this region.
The analysis to develop the SMC model uses Pass 8 SOURCE class events in the energy range 200 MeV–300 GeV with a zenith angle cut at 100. The lower energy bound is determined by the worsening angular resolution, and declining acceptance, with decreasing energy. We apply the standard selection criteria for good time intervals and remove data taken in non-standard operating and observing modes. The selection also excludes time periods during bright GRBs and solar flares. The data set that was used to develop our model for the SMC diffuse emission overlaps with the data set used in the DM search. The emission model is built from a fitting procedure using a maximum likelihood approach similar to the development of the LMC background model Buckley et al. (2015).
III.1 Modeling the SMC
The base model is composed of an isotropic diffuse component, a Galactic diffuse component,222The diffuse background models are available at: http://fermi.gsfc.nasa.gov/ssc/data/access/lat/BackgroundModels.html as iso_P8R2_SOURCE_V6_v06.txt and gll_iem_v06.fits. and objects listed in the Fermi-LAT Third Source Catalog (3FGL) Acero et al. (2015). Source 3FGL J0059.07242e is not included because it corresponds to the SMC, for which we sought a new model. The position of weak and soft source 3FGL J0021.66835 () within the region under study had to be refined because the fit resulted in a pair of negative and positive count residuals and an unphysically soft spectrum for the source. The new source, referred to as PS2 hereafter, best-fit position is . In the course of the analysis, an additional point-like source not listed in the 3FGL was found333The 3FGL catalog is based on 4 years of P7Rep data, so finding a new source with 6 years of Pass 8 data is not unexpected., between the SMC and globular cluster 47 Tuc, at position , referred to as PS1 hereafter. It has a TS in the 25–35 range, depending on the spatial model adopted for the SMC. Its spectrum can be described by a power law with photon index 1.8.
The remaining emission coincident with the SMC and not accounted for by the base model is then modeled in several ways. Representing the SMC as a combination of point sources resulted in too many degrees of freedom for a relatively limited improvement in the maximum likelihood. Using a 2D Gaussian intensity distribution provides a better likelihood for a smaller number of parameters. The maximum likelihood 2D Gaussian model is centered on with a size . A combination of 2D Gaussians was also considered as a possible model, but adding a second Gaussian to the one previously described resulted in only a negligible improvement of the the maximum likelihood. A more physically motivated model was tested, the so-called emissivity model, similar to what was performed for the LMC analysis Ackermann et al. (2015c). The emissivity model relies on the assumption that the gamma-ray emission results from cosmic rays interacting with interstellar gas in the SMC. The aim of this approach is to determine a spatial distribution for the emissivity, which is the gamma-ray luminosity per H-atom per solid angle and depends on the actual density and spectrum of cosmic rays threading the gas. We performed an iterative search including sources with TS 25 to find the combination of 2D Gaussian emissivity profiles that, after multiplication by the gas column density distribution, provides the overall maximum likelihood to the LAT data. The maximum likelihood model thus obtained is based on a single 2D Gaussian emissivity profile (compared to 5 for the LMC) in addition to the measured distribution of gas in the SMC, centered on with a size . The corresponding log of the maximum likelihood is increased compared to the Gaussian model by about 13, but the significance of that improvement is not easily quantified because the models are not nested.
Overall, both spatial models can be considered as two alternatives for the spatial modeling of the gamma-ray emission of the SMC and the slightly higher likelihood of the emissivity model should not be taken as a proof that the signal originates predominantly in cosmic rays. Using either model, the SMC is detected with a significance of nearly 28, with an integrated MeV photon flux of ph/cm2/s (extrapolated from the MeV analysis). The maximum likelihood spectral model, among those tested, is a power law with an exponential cutoff at GeV that is significant at the level.
III.2 Data Selection
For this analysis, we use six years of LAT data (2008 August 4 to 2014 August 5) selecting Pass 8 SOURCE-class events in the energy range from 500 MeV to 500 GeV in 24 logarithmic energy bins and with 01 angular pixelization. The data selection used in the DM search is very similar to that used to build the background model described earlier in this section, but is shifted to a higher energy range than the selection used to build the background model described in Section III. We model the performance of the LAT using the P8R2_SOURCE_V6 Instrument Response Functions (IRFs). The lower limit of 500 MeV was chosen to mitigate both the impact of the increasing width of the point-spread function at lower energies and the leakage from the Earth’s limb (terrestrial gamma rays).
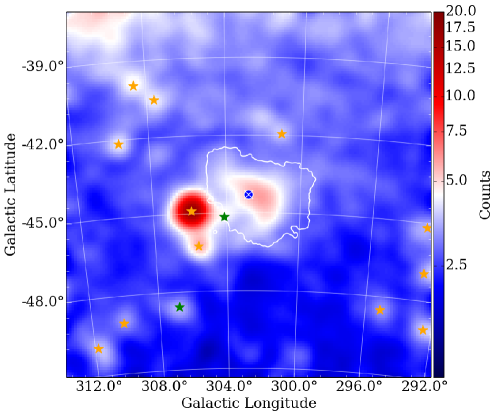
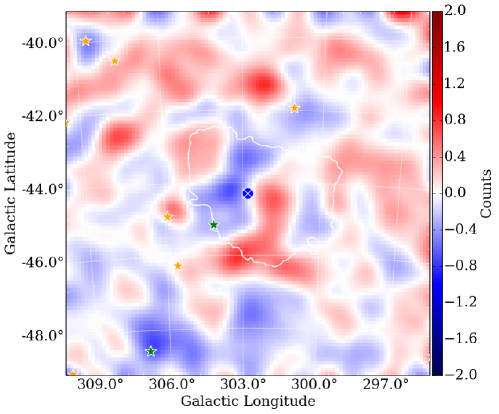
The data reduction and exposure calculations were performed using the LAT ScienceTools version 10-01-01444http://fermi.gsfc.nasa.gov/ssc/data/analysis/software. The event selection for the analysis is summarized in Table 2. In Figure 2, we show a counts map of the gamma rays in the SMC ROI and in Figure 3 we show the residual (data - model) map, both for 0.5–500 GeV. The residual map is consistent with statistical fluctuations indicating the model is in agreement with the data.
| Selection | Criteria |
|---|---|
| Observation Period | 2008 Aug. 4 to 2014 Aug. 5 |
| Mission Elapsed Time (s)555 Mission Elapsed Time is defined as seconds since 2001 January 1, 00:00:00 UTC | 239557414 to 428903014 |
| Energy Range (GeV) | 0.5–500 |
| Fit Region | 1010 centered on |
| Zenith Range | 100 |
| Data Quality Cut666Standard data quality selection: DATA_QUAL==1 LAT_CONFIG==1 with the Science Tool | yes |
IV ANALYSIS
The analysis techniques we apply in this paper closely follow those used in the LMC analysis Buckley et al. (2015). We take the center of the DM distribution (, ) to be the kinematic center of the SMC (see Table 2). The parameters of the DM density profile, the final annihilation states and the mass () define the search parameters. If an excess is detected, our goal is to determine the DM mass and annihilation cross section that best fits the observation. If no excess is found, we set an upper limit on the cross section (). The DM density profile which best fits both the SMC rotation curve and the results from the hydrodynamic cosmological simulation is the generalized NFW, or gNFW (Section II). Here we also investigate the pure NFW profile that best fits the SMC rotation curve. We first briefly describe the analysis technique we used to constrain the DM annihilation rate. Even though the SMC models fit the gamma-ray data, the models are empirically fit to the LAT data set. We must take into account degeneracies between our SMC modeling of the CR background and a potential DM signal. These systematic uncertainties are addressed later in the section.
IV.1 Fitting Method
To fit the DM template we use a multi-step likelihood fitting procedure that has been previously applied to searches for DM signals in dwarf spheroidal galaxies Ackermann et al. (2015a); Drlica-Wagner et al. (2015), the Smith High-Velocity Cloud Drlica-Wagner et al. (2014), and the LMC Buckley et al. (2015). We first perform a broadband fit over the entire energy range. This broadband fit determines the normalizations of the diffuse sources and of the point-like background sources within 10 of the kinematic center of the SMC. We consider sources over a larger area than the ROI. In this step, the spectral component of the DM annihilation gamma rays is modeled as a power law (index = 2)777Varying this power-law index by 0.5 does not significantly affect the results of the fit.. The spectral shape of the DM in each annihilation channel is taken into account in the second step of the analysis.
We then scan the likelihood as a function of the flux normalization of the assumed DM signal independently in each energy bin to create a spectral energy distribution for a source of the spatial morphology that we assume. For this bin-by-bin scan, we fix the normalizations of the background sources to avoid instabilities resulting from fine binning in energy and correlations between the Galactic and isotropic diffuse components. By analyzing each energy bin separately, we avoid selecting a single spectral shape to span the entire energy range at the expense of introducing additional degrees of freedom into the fit. For the fit in any given bin, the only free parameter describing the DM component is the normalization.
Since our background model is an empirical description of the SMC region, we must identify and quantify the degeneracies between the DM models and the components of the background model. We then allow the normalizations of those components to vary within the statistical uncertainties of the broadband fit when performing the bin-by-bin fitting. The degenerate components are determined based on their correlation with the spatial morphology of the DM template. This is described in Section IV.2.
The uncertainties associated with each background component are derived from the results of the broadband fit. To account for the reduced statistics in the bin-by-bin fits, we assign the width of the assumed Gaussian prior on the background components highly correlated with the dark-matter signal as ten times the uncertainties of the parameters in the broadband fit as determined empirically from a coverage study described in Section IV.2 888We varied the width of the Gaussian prior and found that using a factor of ten resulted in the correct coverage properties for upper limits on the Monte Carlo.. By allowing the background normalizations in the bin-by-bin fit to vary within uncertainties, we can estimate not only the correlations between the background and signal models but also the significance of any observed excess. From the significance, we can also calculate the upper limit on the cross section for a specific final state as a function of DM mass.
We evaluate the significance of the DM hypothesis using the test statistic (TS) defined as:
| (3) |
For DM masses up to 500 GeV the statistics are large enough that the TS-distribution follows a distribution (Chernoff’s theorem Chernoff (1954)) and the significance of a given TS value can be calculated from the tail probability of the distribution function. As the counts per bin decreases, the distribution moderately over-predicts the number of high TS trials observed in simulated data.
The final step of the fitting procedure is to convert the bin-by-bin likelihood curve in flux into a likelihood curve in for each spatial profile and annihilation channel, which determines the spectrum. We scan DM masses () from 2–10000 GeV (when kinematically allowed in the annihilation channel under consideration), and the pair-annihilation final states listed in Section II. For each DM spectrum, we extract the expected flux, , in each energy bin and calculate the likelihood of observing that flux value. The log-likelihood in each energy bin is summed to get the log-likelihood curve, defined as:
| (4) |
For each DM mass and channel, we can calculate the maximum likelihood cross section and the 95% CL upper limit on the cross section.
IV.2 Correlations Between Background and Signal Components
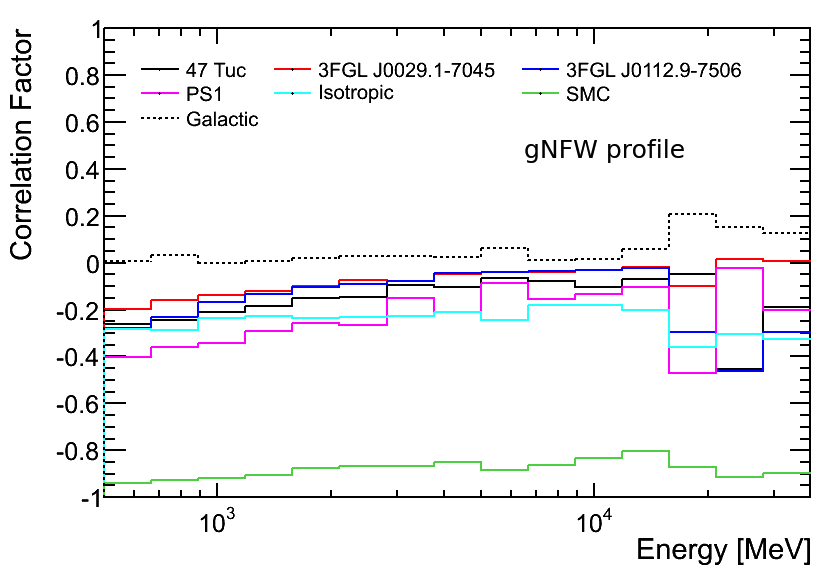
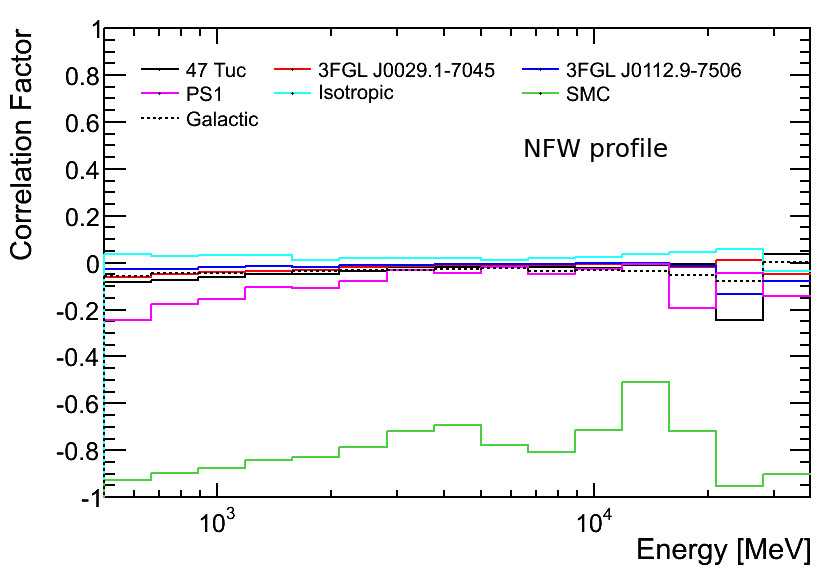
To measure the effect of correlations between background models and the simulated DM signal, in our bin-by-bin fit we allowed the normalizations of different backgrounds to vary within ten times the uncertainties of the parameters in the broadband fit. The background components we tested for correlations were those nearest the kinematic center of the SMC and are as follows: the new point source (PS1), two 3FGL sources (3FGL J0029.17045 and 3FGL J0112.97506), 47 Tuc, the extended SMC component, and the isotropic and the Galactic diffuse backgrounds. The correlation factor at a given energy between the DM component and the background component in energy bin can be obtained from the covariance matrices for the parameters once the likelihood function has been maximized:
| (5) |
where is the variance on the normalizations of the model component in the energy bin. In Figure 4, we show the correlation factor between the dark matter and background component as a function of photon energy for the gNFW and NFW DM profiles at the kinematic center of the SMC. We found that the SMC component, PS1, and the isotropic diffuse have the highest correlation factor with the gNFW DM profile, whereas the NFW is most highly correlated with the SMC component only. Since PS1 has a relatively small flux, also allowing the normalization to vary in the bin-by-bin fit does not significantly change the results.
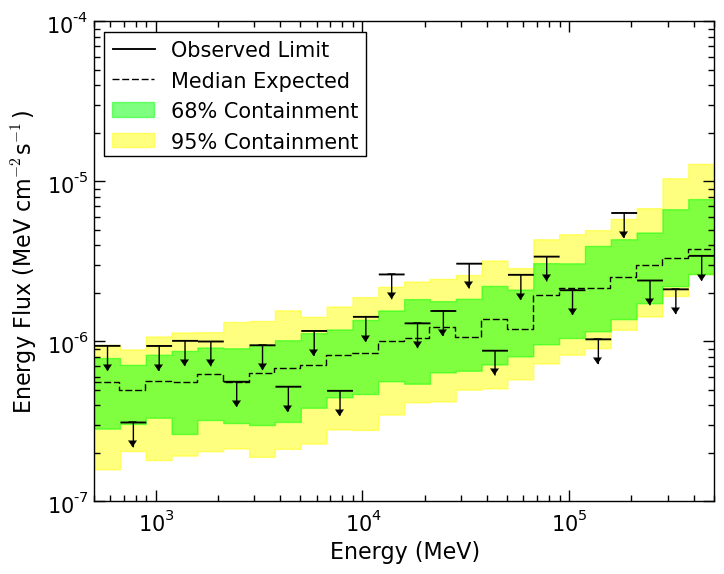
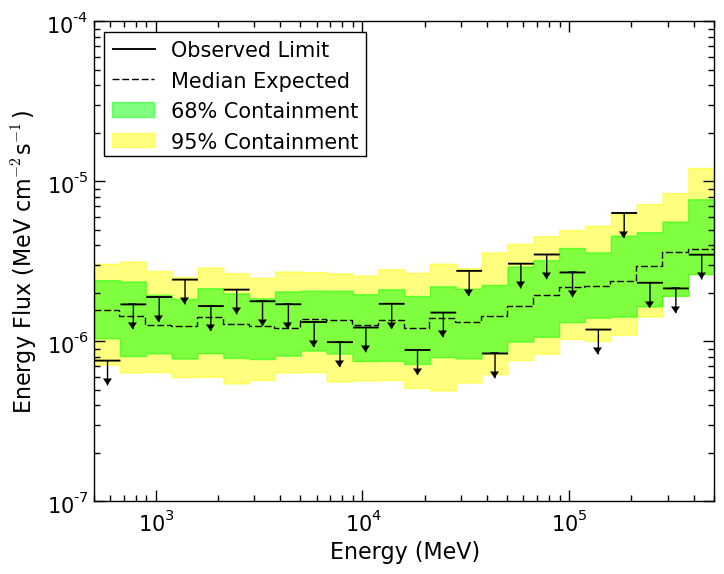
For the components that are highly correlated with DM, fixing the normalizations in the bin-by-bin analysis to the values derived from the broadband fit could result in a potential DM signal being assigned to one of the known backgrounds. This would result in an overly optimistic set of bounds on DM annihilations since there are large correlations with several of the SMC background components. In Figure 5, we show the simulated energy bin-by-bin 95% CL exclusion limits for an energy flux from a DM signal with a gNFW morphology. In the left-hand panel, we use the values from the broadband fit to define the normalizations for the SMC component and the isotropic diffuse component. In the right-hand panel, we allow these normalizations to vary within the uncertainties. Especially at lower energies, the flux upper limits are significantly weaker when the normalizations are allowed to vary. This is due to the uncertainty associated with the correlation between the morphologies. To evaluate the upper limits, we generated a Monte Carlo (MC) simulation of the SMC ROI drawn from the background-only model outlined in Section II and the fitting procedure outlined above. We used 100 trials to construct the expected containment bands for the upper limits.
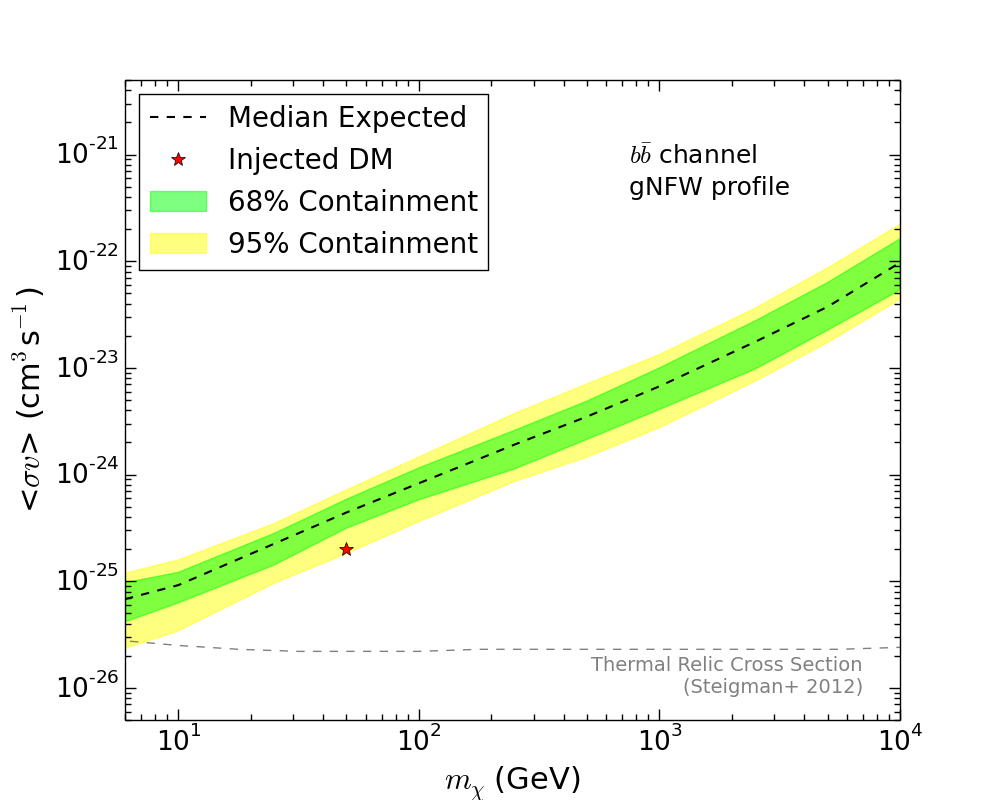
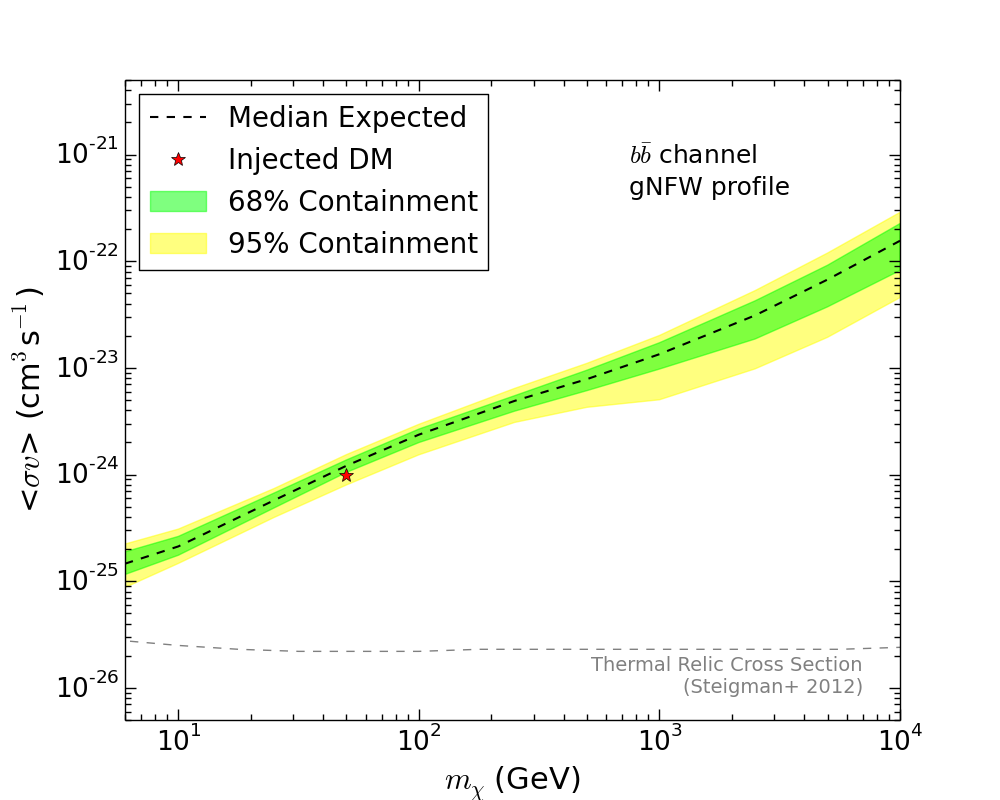
We calculate the expected exclusion curves for a DM annihilation signal from the kinematic center of the SMC by including a gNFW profile with the simulation of the other components to demonstrate the coverage of our upper limit calculations. The injected signal999We tested 50 GeV DM annihilating to and with = 210-25 cm3/s and = 110-24 cm3/s. We also tested 5 GeV DM annihilating to with = 210-25 cm3/s. should lie below the 95% CL upper limit on the cross section in 95% of the pseudo-experiments. This is demonstrated in Figure 6, where the injected signal falls at nearly the 95% CL upper limit in the case with a smaller . The results were similar for the other injected signals. When a larger DM annihilation signal is injected, the exclusion rate is higher (between the 68% and 95% CL upper limit bands). The consistency between the injected signal and the observed upper limits demonstrates that our method for setting upper limits has the correct frequentist coverage. (Note: = 110-24 cm3/s is 50 times the nominal thermal relic cross section and has already been well excluded by other searches Ackermann et al. (2015a)).
As an additional way to quantify the correlation between the DM annihilation term of the model and the background components of the model, we have adopted a technique similar to the LMC analysis to estimate the “effective background” Buckley et al. (2015) (i.e., the background that overlaps with the signal Albert et al. (2014)). We calculate the ratio of signal events to effective backgrounds and compare it to the statistical uncertainty. Since the only free parameters in the fit are the normalizations, the statistical uncertainty on the signal is .
If the signal and background models are degenerate, the diverges indicating that the model has little power to distinguish signal from background. Comparing the expected statistical () and systematic uncertainties (0.02 using Eq. 16 from Buckley et al. (2015)) we can determine if the analysis is statistics or systematics limited. For each source component, the effective background and expected counts () are shown in Table 3, along with the total effective background counts for the model with the gNFW profile.
| Source | ||
|---|---|---|
| Isotropic diffuse | 5100 | 8600 |
| Galactic diffuse | 6400 | 18000 |
| SMC | 140 | 2000 |
| PS1 | 81.7 | 24.8 |
| 47 Tuc | 0.0043 | 2150 |
| PS2 | 0.02 | 870 |
| Total | 25300 | 31600 |
IV.3 Alternative SMC Background Modeling
In Section III, we described two methods for modeling the SMC. For the main results of this analysis we used the model that provided the overall maximum likelihood, the one-component emissivity model. We repeated the analysis using the alternative 2D Gaussian to model the SMC. This allows the sensitivity of the DM limits to the background model of the SMC to be estimated. We allowed the isotropic diffuse and the 2D Gaussian model to vary within ten times the statistical uncertainties as determined by the broadband fit when we introduced a DM component. In Figure 7, we show the resulting flux upper limits. For the bands we used the same MC simulation derived from the emissivity model shown in the right-hand panel of Figure 5. The flux upper limits of the 2D Gaussian SMC model are mostly within the two sigma bands of the MC simulation of the emissivity SMC model illustrating sufficient agreement between the two models.

We find that overall the largest contributor to the systematic uncertainty is the correlations with the backgrounds as described in Section IV.2. These uncertainties are large enough that in our final results we do not explicitly consider the modeling uncertainties suggested by the comparison we made here.
V RESULTS
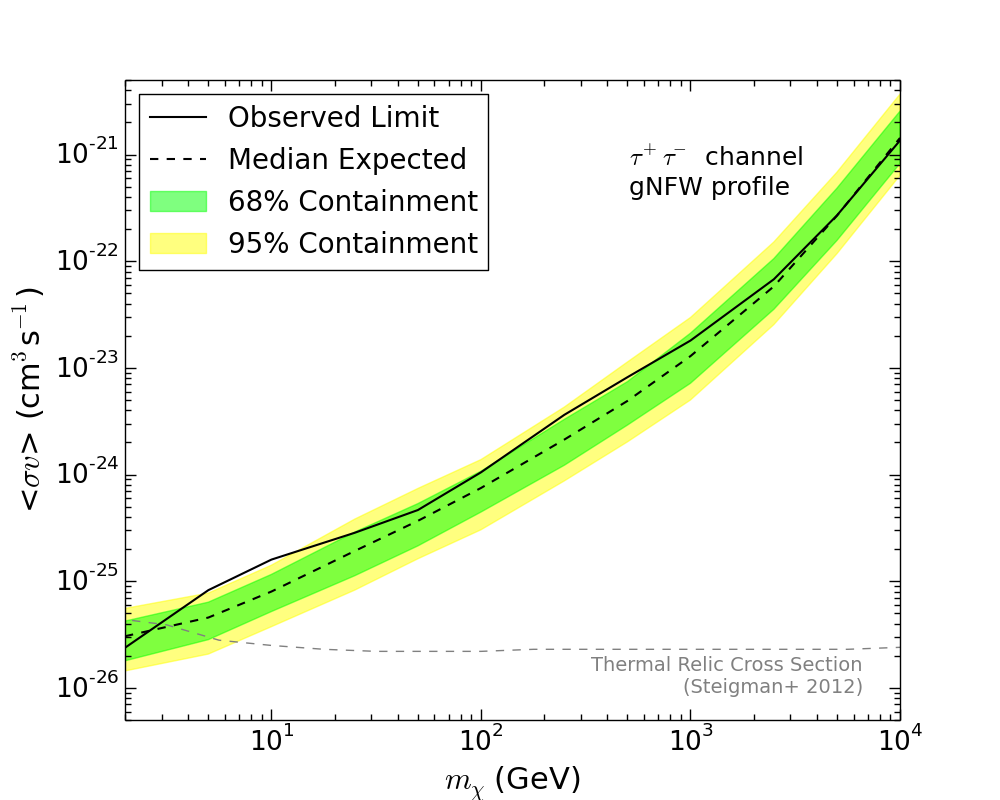
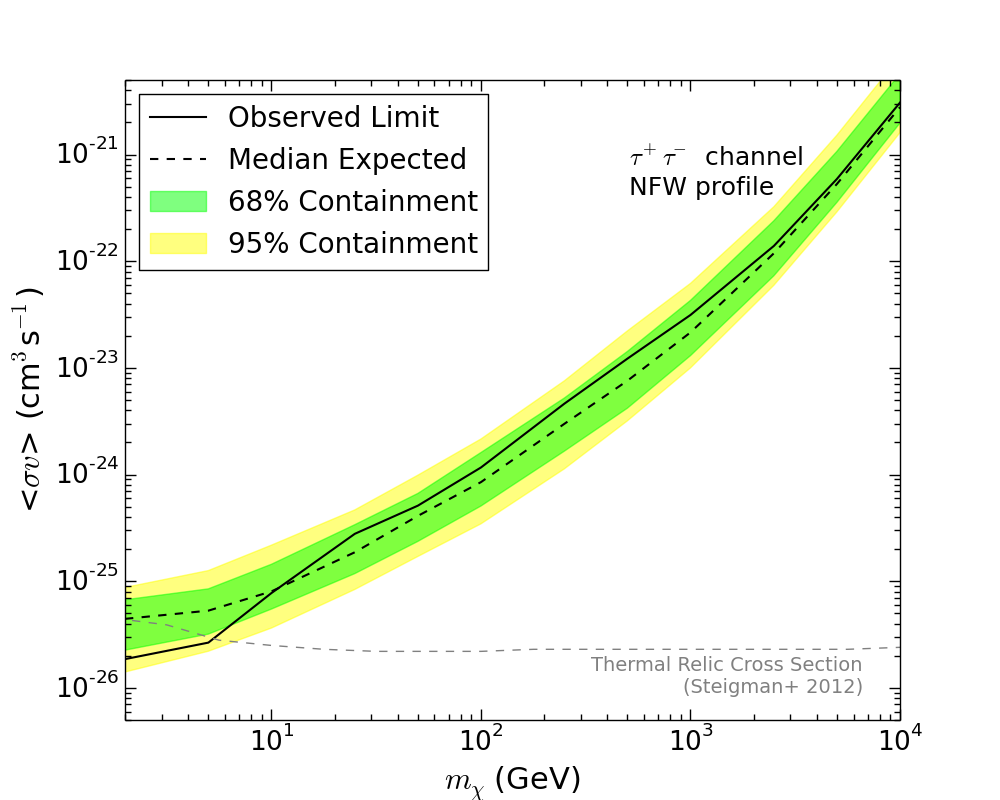
We can now set constraints on the annihilation of DM into Standard Model particles that result in gamma rays. We report the 95% CL upper limit on the annihilation cross section for the , channels. These channels were previously considered in the dwarf spheroidal analyses Ackermann et al. (2015a); Drlica-Wagner et al. (2015). We evaluate cross section limits for the gNFW and the NFW DM distributions considered in Section II. Since these two distributions also represented the highest and lowest -factor estimates, the results can also be interpreted as optimistic and conservative limits respectively.
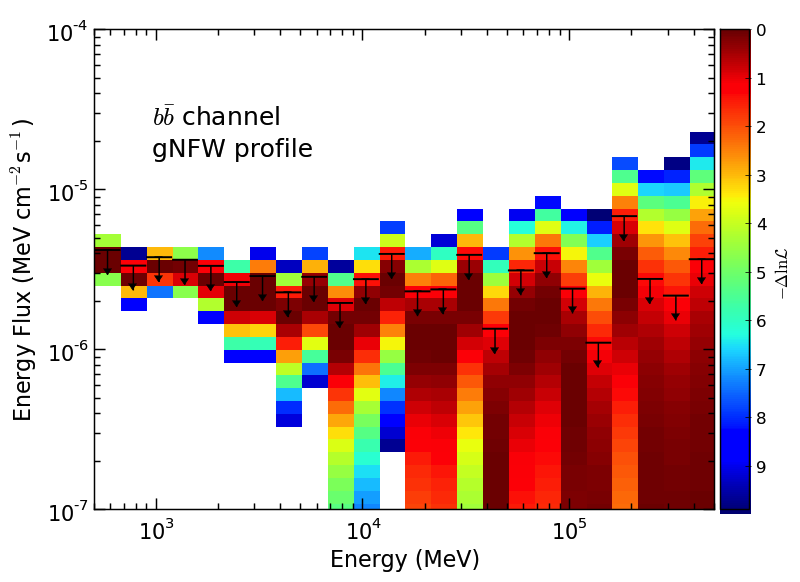
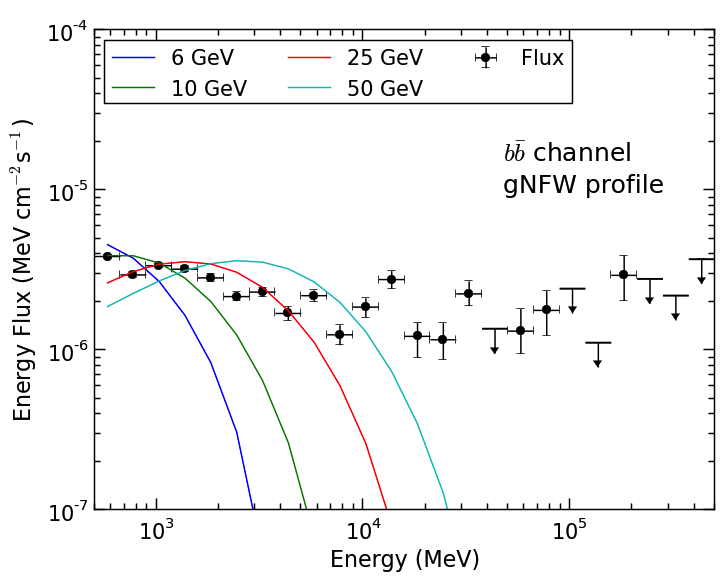
Since the one component emissivity background model of the SMC is highly correlated with both the gNFW and NFW profiles (see Figure 4) and the model is data driven, we first wanted to measure under the assumption that all the gamma rays from the SMC region are attributable to DM annihilation. We evaluated the flux dependence of the maximum of the likelihood function, shown in the left-hand panel of Figure 8. As expected, when only a gNFW template is used (and the SMC template is neglected), the likelihood analysis would indicate a significant DM component, especially in the low energy (10 GeV) bins. If this excess could be attributed entirely to DM annihilation it would follow the predicted spectral energy distribution for that process. The right-hand panel shows the Maximum Likelihood Estimator (MLE) of the energy flux per energy bin. The MLE prediction of the flux is fit to a DM spectral template where the normalization () is fit with four different DM masses. The fit is performed by assembling a global likelihood from the bin-by-bin likelihoods and the global likelihood is maximized to derive the normalization. In this figure, only the channel is shown; however, similar results were obtained for the channel. Since a pure DM annihilation spectrum is not a good fit to the observed spectrum, the majority of the gamma rays from the SMC are not from DM annihilation. Furthermore, the implied MLE cross sections are large and have been excluded by the dwarf spheroidal DM searches Ackermann et al. (2015a). This further supports the conclusion that the gamma-ray emission from the SMC is not dominantly from DM annihilation unless the -factor is implausibly larger than the values we derived.
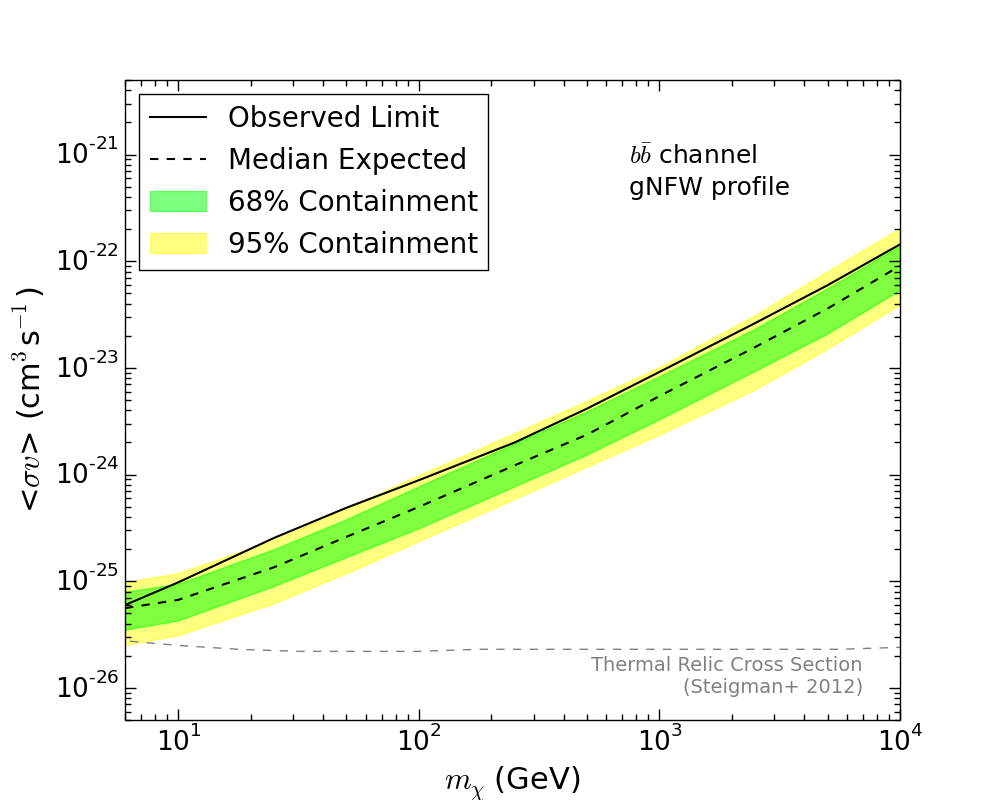
Since a pure DM annihilation spectrum is not a good fit to the observed spectrum of the SMC region and the implied DM cross section has already been excluded by other studies, we include the emissivity model of the SMC to derive upper limits on the annihilation cross sections for the two choices for the DM density profile. In Figures 9 and 10 we show the 95% CL upper bounds for the and annihilation channels for the gNFW and NFW profiles. There are no obvious features in the mass dependence of these limits, except the dip in the observed limit at lower DM masses for the gNFW profile. This could result from a fluctuation in the data, or an overestimation of the correlation of the DM signal with the backgrounds at low masses. The highest TS value measured is 4 in the channel using the NFW profile. This is shown as the slight excess in Figure 9 at 10 GeV. In these figures, we also see that the two profiles set nearly the same constraints in both channels. This is not surprising since, although the gNFW profile has a larger -factor than the NFW profile, it is also more highly correlated with the SMC baryonic template (especially at higher masses). In the case of the NFW profile, we can exclude the canonical thermal cross section for DM up to 7 GeV in the channel. This is consistent with the results from the dwarf spheroidal and LMC analyses Ackermann et al. (2015a); Drlica-Wagner et al. (2015); Buckley et al. (2015). When using the gNFW profile, we cannot exclude the canonical thermal cross section in the channel at any mass, and only up to 2 GeV in the channel. Several studies have shown that in the Galactic center when the annihilation channel has a large leptonic component (i.e., the case), secondary emission is important to consider in particular at high masses (1000 GeV) Buch et al. (2015); Kaplinghat et al. (2015); Lacroix et al. (2015); Gómez-Vargas et al. (2013); Ackermann et al. (2015b). In the case of the SMC, the strengths of both the magnetic field and the Interstellar Radiation Field (ISRF) are smaller than in the Galactic center Abdo et al. (2010), and the gas densities are not any greater. It is most likely that the signal from the secondaries would have a similar spatial distribution as the other classical backgrounds, making it difficult to disentangle the signal and background components in the fit. We estimate that if the secondary emission was distinguishable from classical backgrounds, considering it would improve the limits at 1 GeV and for 1000 GeV by 20%, which is subdominant to other statistical and systematic effects.
The expectation bands in Figures 9 and 10 are derived from the same 100 MC trials that were used in deriving the flux upper limits in the right-hand panel Figure 5. See Section IV.2. This correlation is the largest uncertainty in our limits, in particular at energies less than 100 GeV. We find that the observed limits are weaker than the predicted limits over most of the mass range for both channels when using the gNFW spectral model for the DM component. This indicates that letting the background components most correlated with the DM signal vary within uncertainties in the bin-by-bin fit is not a perfect method to take the correlation of the components into account. However, our observed limits using the NFW profile are consistent and in some cases more constraining than indicated by the MC simulations.

VI DISCUSSION AND CONCLUSIONS
The SMC is the second largest satellite of the Milky Way and contains an amount of DM that would result in a DM annihilation signal at Earth as large as the brightest dwarf galaxies. Although it has less DM than the LMC, and is slightly more distant, it also has less interstellar gas and massive star formation, and fewer conventional sources of gamma rays.
Given the enormous interest in the possible detection of a DM signal from the Galactic center, the advantages of the SMC makes it an excellent target for analysis with -LAT gamma-ray data. This work provides the first constraints on the annihilation of DM into Standard Model particles from observations of the SMC. Consideration of both hydrodynamical cosmological simulations and the observed rotation curve indicates that the DM density profile is best described by either a gNFW or an NFW profile. We based our search for a DM annihilation signal on six years of -LAT data over a 1010 ROI centered at the SMC. To derive a model for the gamma-ray emission from the SMC, we employed a physical emissivity model which yielded a one-component description of the SMC (Fermi-LAT Collaboration, 2016, in prep.). We place upper limits on the velocity-averaged cross section that reach the benchmark canonical thermal freeze-out value for DM with an NFW up to 7 GeV in the channel. Compared to the expectation given the SMC baryonic model and the DM profiles, the limits we found were modestly weaker than expected. No DM annihilation signal was found to be statistically significant, the largest being slightly greater than 2. An interpretation of the significance should also consider a trials factor, which further reduces the value.
The main source of uncertainty is correlations between the SMC gamma-ray emission model and the gNFW and NFW DM profiles. We found that these DM profiles are highly correlated with components of our SMC background model and this is the largest source of uncertainty. The correlation between these components weakens the limits, in particular in the energy range associated with the excess near the Galactic center.
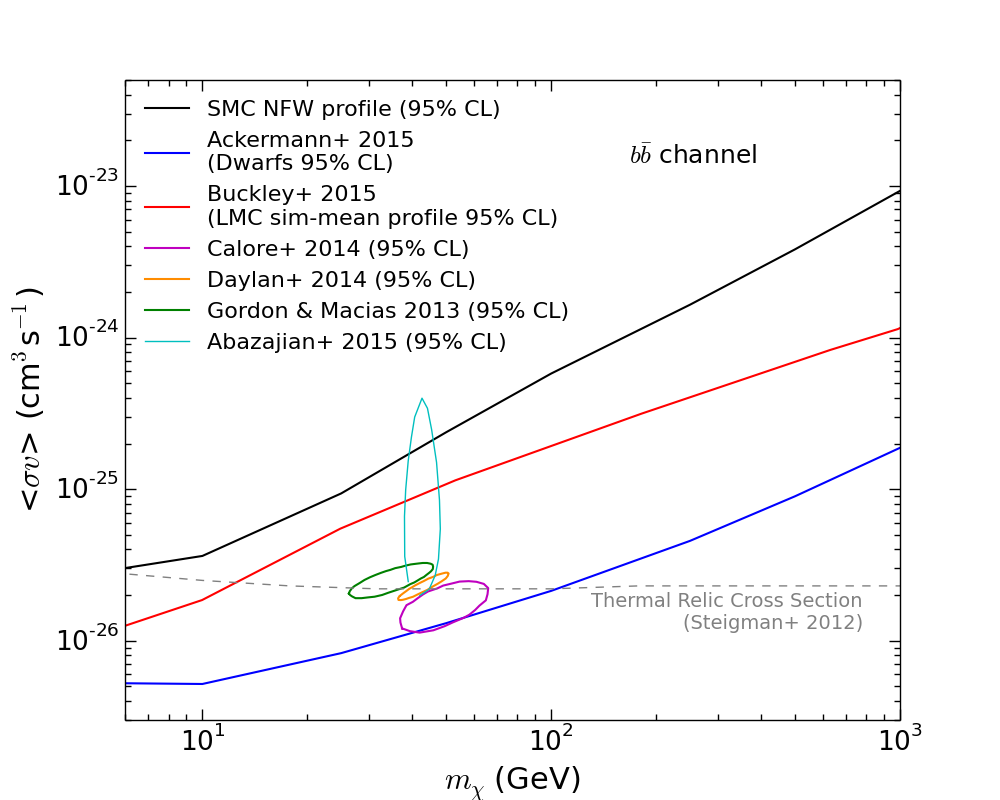
Both DM profiles yielded similar limits and are either competitive with or exceed the existing limits from any individual dwarf spheroidal galaxy. However, the limits are weaker than the limit from a joint analysis of the dwarf spheroidal galaxies. The limits we found are also comparable to the more conservative limits derived from the analysis of the LMC. In Figure 11, we compare the bounds set for the channel using the NFW profile, the LMC analysis which used Pass 7 Rep data and a more realistic sim-mean profile Buckley et al. (2015), and the most recent -LAT analysis of the dwarf spheroidal galaxies Ackermann et al. (2015a). We expected to find stronger or comparable bounds across the entire mass range, but did not due to correlations of the DM profiles with components of the SMC background. In the figure, we also show our limits compared with the values preferred by analyses of the Galactic center excess Calore et al. (2014); Daylan et al. (2014); Gordon and Macias (2013); Abazajian and Keeley (2015). The ellipses shown in the figure are meant to illustrate the parameter space of interest and do not include uncertainties on due to the uncertainties of the corresponding DM density profiles.
A better understanding of the populations of cosmic rays and high energy sources in the SMC would help disambiguate astrophysical emission from DM signals. In this study, our approach was conservative, resulting in robust bounds. More accurate simulations of the Magellanic system eventually will be made possible using the results of stellar surveys, such as GAIA Perryman et al. (2001), and would give greater confidence in both the morphological shape of the expected DM signal and value of the -factor. Nevertheless, the present work and the LMC analysis Buckley et al. (2015) already demonstrate the potential of DM searches in complicated systems such as the Magellanic Clouds.
Acknowledgements.
The Fermi LAT Collaboration acknowledges generous ongoing support from a number of agencies and institutes that have supported both the development and the operation of the LAT as well as scientific data analysis. These include the National Aeronautics and Space Administration and the Department of Energy in the United States, the Commissariat à l’Energie Atomique and the Centre National de la Recherche Scientifique / Institut National de Physique Nucléaire et de Physique des Particules in France, the Agenzia Spaziale Italiana and the Istituto Nazionale di Fisica Nucleare in Italy, the Ministry of Education, Culture, Sports, Science and Technology (MEXT), High Energy Accelerator Research Organization (KEK) and Japan Aerospace Exploration Agency (JAXA) in Japan, and the K. A. Wallenberg Foundation, the Swedish Research Council and the Swedish National Space Board in Sweden. Additional support for science analysis during the operations phase is gratefully acknowledged from the Istituto Nazionale di Astrofisica in Italy and the Centre National d’Études Spatiales in France. Resources supporting this work were provided by the NASA High-End Computing (HEC) Program through the NASA Advanced Supercomputing (NAS) Division at Ames Research Center.References
- Zwicky (1933) F. Zwicky, Helv. Phys. Acta 6, 110 (1933).
- Rubin et al. (1980) V. Rubin, N. Thonnard, and J. Ford, W.K., ApJ 238, 471 (1980).
- Olive (2003) K. A. Olive, ArXiv e-prints (2003), arXiv:astro-ph/0301505 [astro-ph] .
- Ade et al. (2014) P. Ade et al. (Planck Collaboration), A&A (2014), 10.1051/0004-6361/201321591, arXiv:1303.5076 [astro-ph.CO] .
- Feng and Kumar (2008) J. L. Feng and J. Kumar, Phys. Rev. Lett. 101, 231301 (2008), arXiv:0803.4196 [hep-ph] .
- Atwood et al. (2009) W. Atwood et al. (Fermi-LAT Collaboration), ApJ. 697, 1071 (2009), arXiv:0902.1089 [astro-ph.IM] .
- Abazajian and Kaplinghat (2012) K. N. Abazajian and M. Kaplinghat, Phys. Rev. D 86, 083511 (2012), arXiv:1207.6047 [astro-ph.HE] .
- Abazajian et al. (2014) K. N. Abazajian, N. Canac, S. Horiuchi, and M. Kaplinghat, Phys. Rev. D 90, 023526 (2014), arXiv:1402.4090 [astro-ph.HE] .
- Boyarsky et al. (2011) A. Boyarsky, D. Malyshev, and O. Ruchayskiy, Phys. Lett. B705, 165 (2011), arXiv:1012.5839 [hep-ph] .
- Daylan et al. (2014) T. Daylan et al., ArXiv e-prints (2014), arXiv:1402.6703 [astro-ph.HE] .
- Goodenough and Hooper (2009) L. Goodenough and D. Hooper, ArXiv e-prints (2009), arXiv:0910.2998 [hep-ph] .
- Gordon and Macias (2013) C. Gordon and O. Macias, Phys. Rev. D 88, 083521 (2013), arXiv:1306.5725 [astro-ph.HE] .
- Hooper and Goodenough (2011) D. Hooper and L. Goodenough, Phys. Lett. B697, 412 (2011), arXiv:1010.2752 [hep-ph] .
- Hooper and Linden (2011) D. Hooper and T. Linden, Phys. Rev. D 84, 123005 (2011), arXiv:1110.0006 [astro-ph.HE] .
- Hooper et al. (2013a) D. Hooper, C. Kelso, and F. S. Queiroz, Astropart. Phys. 46, 55 (2013a), arXiv:1209.3015 [astro-ph.HE] .
- Hooper and Slatyer (2013) D. Hooper and T. R. Slatyer, Phys. Dark Univ. 2, 118 (2013), arXiv:1302.6589 [astro-ph.HE] .
- Huang et al. (2013) W.-C. Huang, A. Urbano, and W. Xue, ArXiv e-prints (2013), arXiv:1307.6862 [hep-ph] .
- Ajello et al. (2016) M. Ajello et al. (Fermi-LAT), Astrophys. J. 819, 44 (2016), arXiv:1511.02938 [astro-ph.HE] .
- Ackermann et al. (2011) M. Ackermann et al. (Fermi-LAT Collaboration), Phys. Rev. Lett. 107, 241302 (2011), arXiv:1108.3546 [astro-ph.HE] .
- Ackermann et al. (2014) M. Ackermann et al. (Fermi-LAT Collaboration), Phys. Rev. D 89, 042001 (2014), arXiv:1310.0828 [astro-ph.HE] .
- Geringer-Sameth and Koushiappas (2011) A. Geringer-Sameth and S. M. Koushiappas, Phys. Rev. Lett. 107, 241303 (2011), arXiv:1108.2914 [astro-ph.CO] .
- Geringer-Sameth et al. (2015a) A. Geringer-Sameth, S. M. Koushiappas, and M. G. Walker, Phys. Rev. D91, 083535 (2015a), arXiv:1410.2242 [astro-ph.CO] .
- Ackermann et al. (2015a) M. Ackermann et al. (Fermi-LAT Collaboration), Phys. Rev. Lett. 115, 231301 (2015a), arXiv:1503.02641 [astro-ph.HE] .
- Geringer-Sameth et al. (2015b) A. Geringer-Sameth, M. G. Walker, S. M. Koushiappas, S. E. Koposov, V. Belokurov, G. Torrealba, and N. W. Evans, Phys. Rev. Lett. 115, 081101 (2015b), arXiv:1503.02320 [astro-ph.HE] .
- Drlica-Wagner et al. (2015) A. Drlica-Wagner et al. (Fermi-LAT and DES Collaborations), ApJ 809, L4 (2015), arXiv:1503.02632 [astro-ph.HE] .
- Ackermann et al. (2012) M. Ackermann et al. (Fermi-LAT Collaboration), ApJ. 747, 121 (2012), arXiv:1201.2691 [astro-ph.HE] .
- Belikov et al. (2012) A. V. Belikov, M. R. Buckley, and D. Hooper, Phys. Rev. D 86, 043504 (2012), arXiv:1111.2613 [hep-ph] .
- Berlin and Hooper (2014) A. Berlin and D. Hooper, Phys. Rev. D 89, 016014 (2014), arXiv:1309.0525 [hep-ph] .
- Buckley and Hooper (2010) M. R. Buckley and D. Hooper, Phys. Rev. D 82, 063501 (2010), arXiv:1004.1644 [hep-ph] .
- Ackermann et al. (2010) M. Ackermann et al. (Fermi-LAT Collaboration), JCAP 1005, 025 (2010), arXiv:1002.2239 [astro-ph.CO] .
- Dugger et al. (2010) L. Dugger, T. E. Jeltema, and S. Profumo, JCAP 1012, 015 (2010), arXiv:1009.5988 [astro-ph.HE] .
- Buckley et al. (2015) M. R. Buckley, E. Charles, J. M. Gaskins, A. M. Brooks, A. Drlica-Wagner, P. Martin, and G. Zhao, Phys. Rev. D 91, 102001 (2015), arXiv:1502.01020 [astro-ph.HE] .
- Abazajian (2011) K. N. Abazajian, JCAP 1103, 010 (2011), arXiv:1011.4275 [astro-ph.HE] .
- Wharton et al. (2012) R. Wharton, S. Chatterjee, J. Cordes, J. Deneva, and T. Lazio, ApJ. 753, 108 (2012), arXiv:1111.4216 [astro-ph.HE] .
- Hooper et al. (2013b) D. Hooper, I. Cholis, T. Linden, J. M. Siegal-Gaskins, and T. R. Slatyer, Phys. Rev. D 88, 083009 (2013b), arXiv:1305.0830 [astro-ph.HE] .
- Carlson and Profumo (2014) E. Carlson and S. Profumo, Phys. Rev. D 90, 023015 (2014), arXiv:1405.7685 [astro-ph.HE] .
- Petrovic et al. (2015) J. Petrovic, P. D. Serpico, and G. Zaharijas, JCAP 1502, 023 (2015), arXiv:1411.2980 [astro-ph.HE] .
- Petrovic et al. (2014) J. Petrovic, P. D. Serpico, and G. Zaharijas, JCAP 1410, 052 (2014), arXiv:1405.7928 [astro-ph.HE] .
- Mirabal (2013) N. Mirabal, MNRAS 436, 2461 (2013), arXiv:1309.3428 [astro-ph.HE] .
- Bekki and Stanimirovic (2009) K. Bekki and S. Stanimirovic, MNRAS 395, 342 (2009), arXiv:0807.2102 [astro-ph] .
- Besla et al. (2010) G. Besla et al., ApJ. 721, L97 (2010), arXiv:1008.2210 [astro-ph.GA] .
- Besla et al. (2007) G. Besla et al., ApJ 668, 949 (2007), arXiv:0703196 [astro-ph] .
- Kallivayalil et al. (2013) N. Kallivayalil, R. P. van der Marel, G. Besla, J. Anderson, and C. Alcock, ApJ. 764, 161 (2013), arXiv:1301.0832 [astro-ph.CO] .
- Abdo et al. (2010) A. Abdo et al. (Fermi-LAT Collaboration), A&A 523, A46 (2010), arXiv:1008.2127 .
- Ullio et al. (2002) P. Ullio, L. Bergstrom, J. Edsjo, and C. G. Lacey, Phys. Rev. D 66, 123502 (2002), arXiv:astro-ph/0207125 [astro-ph] .
- Jeltema and Profumo (2008) T. E. Jeltema and S. Profumo, JCAP 0811, 003 (2008), arXiv:0808.2641 [astro-ph] .
- Kachelrieß and Serpico (2007) M. Kachelrieß and P. D. Serpico, Phys. Rev. D 76, 063516 (2007), arXiv:0707.0209 [hep-ph] .
- Berezinsky et al. (2002) V. Berezinsky, M. Kachelrieß, and S. Ostapchenko, Phys. Rev. Lett. 89, 171802 (2002), hep-ph/0205218 .
- Kachelrieß et al. (2009) M. Kachelrieß, P. D. Serpico, and M. A. Solberg, Phys. Rev. D 80, 123533 (2009), arXiv:0911.0001 [hep-ph] .
- Ciafaloni and Urbano (2010) P. Ciafaloni and A. Urbano, Phys. Rev. D 82, 043512 (2010), arXiv:1001.3950 [hep-ph] .
- Ciafaloni et al. (2011) P. Ciafaloni, D. Comelli, A. Riotto, F. Sala, A. Strumia, et al., JCAP 1103, 019 (2011), arXiv:1009.0224 [hep-ph] .
- Cirelli et al. (2011) M. Cirelli, G. Corcella, A. Hektor, G. Hutsi, M. Kadastik, et al., JCAP 1103, 051 (2011), arXiv:1012.4515 [hep-ph] .
- Ackermann et al. (2015b) M. Ackermann et al. (Fermi-LAT Collaboration), JCAP 1509, 008 (2015b), arXiv:1501.05464 [astro-ph.CO] .
- Hernquist (1990) L. Hernquist, ApJ 356, 359 (1990).
- Navarro et al. (1996) J. F. Navarro, C. S. Frenk, and S. D. M. White, ApJ 462, 563 (1996), arXiv:astro-ph/9508025 .
- Zhao (1996) H. Zhao, MNRAS 278, 488 (1996), astro-ph/9509122 .
- Kravtsov et al. (1998) A. V. Kravtsov, A. A. Klypin, J. S. Bullock, and J. R. Primack, ApJ 502, 48 (1998), astro-ph/9708176 .
- Besla et al. (2012) G. Besla et al., MNRAS 421, 2109 (2012), arXiv:1201.1299 [astro-ph.GA] .
- Haschke et al. (2012) R. Haschke, E. K. Grebel, and S. Duffau, AJ 144, 107 (2012), arXiv:1209.3769 [astro-ph.GA] .
- Scowcroft et al. (2015) V. Scowcroft, W. L. Freedman, B. F. Madore, A. Monson, S. E. Persson, J. Rich, M. Seibert, and J. R. Rigby, ArXiv e-prints (2015), arXiv:1502.06995 .
- de Grijs and Bono (2015) R. de Grijs and G. Bono, AJ 149, 179 (2015), arXiv:1504.00417 [astro-ph.SR] .
- Stanimirovic et al. (2004) S. Stanimirovic, L. Staveley-Smith, and P. Jones, ApJ. 604, 176 (2004), arXiv:astro-ph/0312223 [astro-ph] .
- Harris and Zaritsky (2004) J. Harris and D. Zaritsky, AJ 127, 1531 (2004).
- Cintio et al. (2014) A. D. Cintio, C. B. Brook, A. A. Dutton, A. V. Maccio, G. S. Stinson, and A. Knebe, MNRAS 441, 2986 (2014), arXiv:1404.5959 .
- Governato et al. (2012) F. Governato, A. Zolotov, A. Pontzen, C. Christensen, S. H. Oh, A. M. Brooks, T. Quinn, S. Shen, and J. Wadsley, MNRAS 422, 1231 (2012), arXiv:1202.0554 .
- Teyssier et al. (2013) R. Teyssier, A. Pontzen, Y. Dubois, and J. I. Read, MNRAS 429, 3068 (2013), arXiv:1206.4895 .
- Di Cintio et al. (2014) A. Di Cintio et al., MNRAS 437, 415 (2014), arXiv:1306.0898 .
- Penarrubia et al. (2012) J. Penarrubia, A. Pontzen, M. G. Walker, and S. E. Koposov, ApJ. 759, L42 (2012), arXiv:1207.2772 [astro-ph.GA] .
- Behroozi et al. (2013) P. S. Behroozi, R. H. Wechsler, and C. Conroy, ApJ 770, 57 (2013), 1207.6105 .
- Moster et al. (2013) B. P. Moster, T. Naab, and S. D. M. White, MNRAS 428, 3121 (2013).
- Graczyk et al. (2014) D. Graczyk et al., ApJ 780, 59 (2014), arXiv:1311.2340 [astro-ph.CO] .
- Martinez (2015) G. D. Martinez, MNRAS 451, 2524 (2015), arXiv:1309.2641 .
- Geringer-Sameth et al. (2015c) A. Geringer-Sameth, S. M. Koushiappas, and M. Walker, ApJ. 801, 74 (2015c), arXiv:1408.0002 [astro-ph.CO] .
- Atwood et al. (2012) W. Atwood et al. (Fermi-LAT Collaboration), in Proceedings of the Fourth International Fermi Symposium (2012) arXiv:1303.3514 [astro-ph.IM] .
- Acero et al. (2015) F. Acero et al. (Fermi-LAT Collaboration), ApJS 218, 23 (2015), arXiv:1501.02003 [astro-ph.HE] .
- Ackermann et al. (2015c) M. Ackermann et al. (Fermi-LAT Collaboration), A&A accepted (2015c), 10.1051/0004-6361/201526920, arXiv:1509.06903 [astro-ph.HE] .
- Drlica-Wagner et al. (2014) A. Drlica-Wagner, G. A. Gomez-Vargas, J. W. Hewitt, T. Linden, and L. Tibaldo, ApJ. 790, 24 (2014), arXiv:1405.1030 [astro-ph.HE] .
- Chernoff (1954) H. Chernoff, Ann. Math. Statist. 25, 573 (1954).
- Steigman et al. (2012) G. Steigman, B. Dasgupta, and J. F. Beacom, Phys. Rev. D86, 023506 (2012), arXiv:1204.3622 [hep-ph] .
- Albert et al. (2014) A. Albert, G. A. Gómez-Vargas, M. Grefe, C. Muñoz, C. Weniger, E. D. Bloom, E. Charles, M. N. Mazziotta, and A. Morselli, Journal of Cosmology and Astroparticle Physics 2014, 023 (2014).
- Buch et al. (2015) J. Buch, M. Cirelli, G. Giesen, and M. Taoso, JCAP 1509, 037 (2015), arXiv:1505.01049 [hep-ph] .
- Kaplinghat et al. (2015) M. Kaplinghat, T. Linden, and H.-B. Yu, Phys. Rev. Lett. 114, 211303 (2015), arXiv:1501.03507 [hep-ph] .
- Lacroix et al. (2015) T. Lacroix, O. Macias, C. Gordon, P. Panci, C. Boehm, and J. Silk, (2015), arXiv:1512.01846 [astro-ph.HE] .
- Gómez-Vargas et al. (2013) G. A. Gómez-Vargas, M. A. Sánchez-Conde, J.-H. Huh, M. Peiró, F. Prada, A. Morselli, A. Klypin, D. G. Cerde o, Y. Mambrini, and C. Mu oz, JCAP 1310, 029 (2013), arXiv:1308.3515 [astro-ph.HE] .
- Calore et al. (2014) F. Calore, I. Cholis, and C. Weniger, ArXiv e-prints (2014), arXiv:1409.0042 .
- Abazajian and Keeley (2015) K. N. Abazajian and R. E. Keeley, (2015), arXiv:1510.06424 [hep-ph] .
- Perryman et al. (2001) M. A. C. Perryman, K. S. de Boer, G. Gilmore, E. Hog, M. G. Lattanzi, L. Lindegren, X. Luri, F. Mignard, O. Pace, and P. T. de Zeeuw, Astron. Astrophys. 369, 339 (2001), arXiv:astro-ph/0101235 [astro-ph] .