X-ray properties of the Youngest Radio Sources and Their Environments
Abstract
We present the results of the first X-ray study of a sample of 16 young radio sources classified as Compact Symmetric Objects (CSOs). We observed six of them for the first time in X-rays using Chandra, re-observed four with the previous XMM-Newton or Beppo-SAX data, and included six other with the archival data. All the sources are nearby, with the age of their radio structures ( years) derived from the hotspots advance velocity. Our results show heterogeneous nature of the CSOs indicating a complex environment associated with young radio sources. The sample covers a range in X-ray luminosity, – erg s-1, and intrinsic absorbing column density of –1022 cm-2. In particular, we detected extended X-ray emission in 1718649; a hard photon index of in 2021614 and 15110518 consistent with either a Compton thick absorber or non-thermal emission from compact radio lobes, and in 0710439 an ionized iron emission line at keV and EW 1.4 keV, and a decrease by an order of magnitude in the 2-10 keV flux since the 2008 XMM-Newton observation in 160726. We conclude that our pilot study of CSOs provides a variety of exceptional diagnostics and highlights the importance of deep X-ray observations of large samples of young sources. This is necessary in order to constrain theoretical models for the earliest stage of radio source evolution and study the interactions of young radio sources with the interstellar environment of their host galaxies.
Subject headings:
galaxies: active — galaxies: jets — X-rays: galaxies1. Introduction
Theory and simulations predict that radio sources are the most luminous when they start growing within the very central regions of their host galaxies (Scheuer, 1974; Begelman & Cioffi, 1989; Begelman, 1996; Readhead et al., 1996a; Heinz et al., 1998). During this initial expansion a radio source is expected to interact strongly with the interstellar medium (ISM), inducing shocks, accelerating particles, heating the ISM and accelerating gas forming an outflow (Begelman et al., 1984; Begelman & Cioffi, 1989; Bicknell et al., 1997; Silk & Rees, 1998; Reynolds et al., 2001). Empirical evidence for such interactions comes from observations of galactic scale X-ray structures in nearby radio galaxies (e.g. Kraft et al., 2000; Mingo et al., 2011; Siemiginowska et al., 2012; Hardcastle et al., 2012), as well as from correlations between velocities of optical line-emitting gas and the morphology of radio outflows in parsec scale radio sources (Morganti et al., 2003; Holt et al., 2003; Morganti et al., 2013; Tadhunter et al., 2014). Such interactions, leading to energy exchange between a radio source and the ISM, are thought to contribute to feedback that governs the evolution of galaxies over cosmological time scales (e.g. Best et al., 2006; Croton et al., 2006). At present, though, we have only been able to study such interactions in relatively old, yrs, large radio sources, while studies of young compact systems have been limited. Although the youngest sources would only impact the very central regions of their galaxy, they can strongly influence the sites directly responsible for the AGN fuel supply, e.g., by heating and accelerating material away from the central regions (e.g. Bicknell et al., 1997; Holt et al., 2008; Wagner & Bicknell, 2011). Thus, these youngest sources could be critical to our understanding of the feedback processes impacting galaxy evolution.
| # | Source | Size | Velocity | Age | Refs.a | Refs.b | |
|---|---|---|---|---|---|---|---|
| name | [pc] | [] | [yr] | (Age) | (X-ray observations) | ||
| 1. | 1718649c | 0.014 | 2.0 | 0.07 | 91 | (1) | This work/C |
| 2. | 1843356 | 0.763 | 22.3 | 0.39 | 180 | (2) | This work/C |
| 3. | 2021614 | 0.227 | 16.1 | 0.14 | 368 | (2) | This work/C |
| 4. | 0035227 | 0.096 | 21.8 | 0.15 | 450 | (1) | This work/C |
| 5. | 0116319d | 0.059 | 70.1 | 0.45 | 501 | (1) | This work/C |
| 6. | 0710439 | 0.518 | 87.7 | 0.30 | 932 | (2) | This work/C; (6/N) |
| 7. | 1946708 | 0.101 | 39.4 | 0.10 | 1261 | (1) | This work/C; (7/B) |
| 8. | 1943546 | 0.263 | 107.1 | 0.26 | 1308 | (1) | This work/C |
| 9. | 1934638 | 0.183 | 85.1 | 0.17 | 1603 | (1) | This work/C; (7/B) |
| 10. | 160726e | 0.473 | 240 | 0.34 | 2200 | (3) | This work/C; (8/N) |
| 11. | 15110518 | 0.084 | 7.3 | 0.15 | 300 | (4) | (9/C) |
| 12. | 1245676 | 0.107 | 9.6 | 0.16 | 188 | (1) | (10/N) |
| 13. | OQ208f | 0.077 | 7.0 | 0.10 | 219 | (5) | (11/N) |
| 14. | 0108388 | 0.669 | 22.7 | 0.18 | 404 | (1) | (6/N) |
| 15. | 1031567 | 0.460 | 109.0 | 0.19 | 1836 | (2) | (6/N) |
| 16. | 2352495 | 0.238 | 117.3 | 0.12 | 3003 | (2) | (6/N) |
a (1) Giroletti & Polatidis (2009); (2) Polatidis & Conway (2003);
(3) Nagai et al. (2006); (4) An et al. (2012); (5) Luo et al. (2007).
b C: Chandra; N: XMM-Newton; B: BeppoSAX;
(6) Vink et al. (2006); (7) Risaliti et al. (2003); (8) Tengstrand et al. (2009);
(9) Kuraszkiewicz et al. (2009); (10) Watson et al. (2009); (11) Guainazzi et al. (2004).
c NGC 6328; d 4C31.04; e CTD 093; f Mkn 668.
∗
Many different age estimates are given in the literature for each
source, as the measurements depend on radio frequency, radio
components and the number of epochs. Thus, the systematic errors could
be 20%-40% and therefore we only use the age in general discussion
and do not perform any statistical correlations with age.
The existing velocity measurements of radio hot spots and spectral aging studies indicate that Compact Symmetric Objects (CSOs), a subclass of GigaHertz-Peaked Spectrum (GPS) sources, are among the youngest extragalactic radio sources, with ages between 100 and 3000 yrs (Owsianik & Conway, 1998; Taylor et al., 2000; An et al., 2012). Interestingly, there seems to be an excess of CSOs younger than 500 yrs (Gugliucci et al., 2005). This excess together with a large number of compact radio sources ( kpc) in comparison to large size radio galaxies (O’Dea & Baum, 1997) may suggest that the radio jet activity is intermittent (Reynolds & Begelman, 1997; Czerny et al., 2009; Shulevski et al., 2012) or that the compact sources are short-lived (Readhead et al., 1996b; Kunert-Bajraszewska et al., 2010, 2015). In either case the youngest CSOs expand within the central ( pc) regions of the galaxies and contribute to the feedback.
The young age of the CSO sources has been challenged by a frustrated jet scenario in which the presence of a dense medium forces the jets to decelerate rapidly and prevents them from propagating beyond the central parsec scale regions (van Breugel et al., 1984; Gopal-Krishna & Wiita, 1991; De Young, 1993; Carvalho, 1994; De Young, 1997; Perucho, 2015). This would introduce a systematic bias to the kinematic age measurements. However, until now there has been no evidence for a dense enough medium to halt the jets of GPS sources, and this lack of evidence gives further support to the youth scenario (e.g., Morganti 2008; see however, García-Burillo et al. 2007). At the same time, recent broad-band low frequency radio observations reveal inhomogeneous absorber surrounding compact radio lobes in a few CSOs (e.g. Tingay et al., 2015; Callingham et al., 2015) implying that complex interactions between expanding jets and the surrounding medium do take place. X-ray observations of CSOs can potentially resolve this issue by providing evidence in favor or against the presence of dense obscuring matter able to frustrate the jets in the youngest sources.
In general the GPS sources are faint in X-rays and studying them in this waveband became possible only during the last decade, thanks to the Chandra X-ray Observatory (e.g., Siemiginowska et al., 2008; Kunert-Bajraszewska et al., 2014) and XMM-Newton (e.g., Guainazzi et al., 2006; Vink et al., 2006; Tengstrand et al., 2009). The early X-ray results indicate that the GPS X-ray emission could be intrinsically absorbed, although the absorption properties of the GPS sources are similar to those found in general source populations. The intrinsic GPS X-ray radiation could be related to the accretion, to expanding radio lobes, to relativistic jets, or in some cases to the thermal hot medium found in the central regions of the host galaxy (Guainazzi et al., 2006; Stawarz et al., 2008; Ostorero et al., 2010; Migliori et al., 2011; Migliori et al., 2012, 2014).
However, only a few CSO sources with known redshift and measured age has been observed in X-rays (e.g., Guainazzi et al., 2006; Risaliti et al., 2003; Vink et al., 2006). Thus, we initiated our Chandra program to study the CSO sample defined by requiring the availability of kinematic age measurements and (Section 2). Our main goal was to establish the X-ray properties of these CSOs, determine the origin of their X-ray emission, and study the properties of the environment into which they are expanding. We describe our methods of X-ray data analysis in Section 3, and present the X-ray analysis results in Section 4. We discuss the implications of the CSO X-ray properties on the models of the high-energy processes in compact radio sources in Section 5 and conclude our findings in Section 6. We use the most recent constraints on the cosmological parameters to convert the observed fluxes into luminosities (Hinshaw et al. 2013; km Mpc-1, implemented as WMAP9 in the astropy.cosmology package, Astropy Collaboration et al. (2013)).
2. Sample
We compiled from the literature a sample of 16 CSO sources with redshift and expansion velocity of the radio hot spots available at the time of our proposed Chandra project. Table 1 lists these sources and their general radio properties (the linear size, –120 kpc; the expansion velocity, –0.4 ; and the age inferred through the kinematic argument, 100–3000 yrs).
We obtained new Chandra observations of 10 CSOs. We observed the six CSOs with no prior X-ray information (5 ksec exposures). Additionally, we imaged with Chandra the two sources observed previously with BeppoSAX (1946708, 5 ksec; 193463, 20 ksec), or with XMM-Newton (0710439, 38 ksec; 160726, 38 ksec). The goal of the long, 20–40 ksec, exposures was to study in detail the CSO environments through the high-resolution spatial and spectral analysis allowed by the Chandra data. Table 2 contains the log of our Chandra observations. It includes also 15110518 with archival 2 ksec Chandra data.
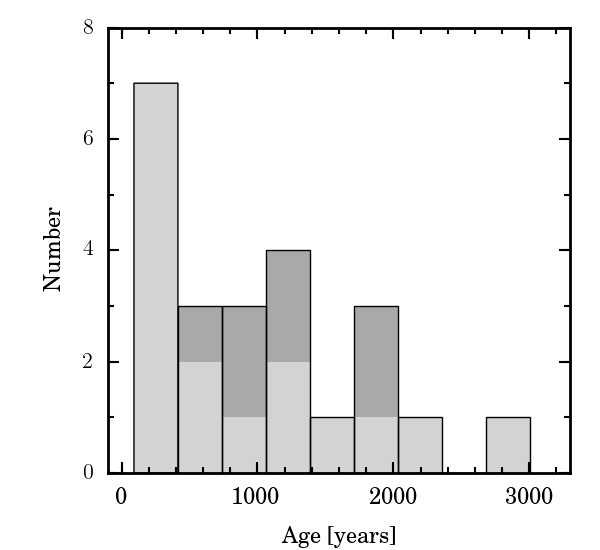
Figure 1 shows the distribution of CSOs kinematic ages for 16 sources in our pilot study and 7 additional sources from An & Baan (2012) with their ages measured after our Chandra program has been completed. The uncertainties on the age measurements are typically within and related to the quality of the radio monitoring data. Note that our X-ray sample contains all the youngest CSOs with the ages years.
3. Chandra X-ray Observations and Data Analysis
| # | Source | RA (J2000) | Dec (J(2000) | Date | Obsid | Exposure | Totala | Neta |
|---|---|---|---|---|---|---|---|---|
| name | [s] | counts | counts | |||||
| 1. | 1718649 | 17 23 41.0 | 65 00 36.6 | 2010-11-09 | 12849 | 4783 | 231 | 224.9 |
| 2. | 1843356 | 18 45 35.1 | 35 41 16.7 | 2010-10-26 | 12850 | 4783 | 11 | 10.8 |
| 3. | 2021614 | 20 22 06.7 | 61 36 58.8 | 2011-04-04 | 12853 | 4784 | 54 | 53.8 |
| 4. | 0035227 | 00 38 08.1 | 23 03 28.4 | 2010-10-13 | 12847 | 4783 | 10 | 9.9 |
| 5. | 0116319 | 01 19 35.0 | 32 10 50.0 | 2010-11-05 | 12848 | 4742 | 3 | |
| 6. | 0710439 | 07 13 38.2 | 43 49 17.2 | 2011-01-18 | 12845 | 37845 | 1679 | 1676.8 |
| 7. | 1946708 | 19 45 53.5 | 70 55 48.7 | 2011-02-07 | 12852 | 4742 | 110 | 109.8 |
| 8. | 1943546 | 19 44 31.5 | 54 48 07.0 | 2011-05-04 | 12851 | 4783 | 12 | 11.9 |
| 9. | 193463 | 19 39 25.0 | 63 42 45.6 | 2010-07-08 | 11504 | 19793 | 362 | 361 |
| 10. | 160726 | 16 09 13.3 | 26 41 29.0 | 2010-12-04 | 12846 | 37845 | 213 | 212.5 |
| secondaryb | 16 09 12.7 | 26 41 17.5 | 2010-12-04 | 12846 | 37845 | 32 | 30.8 | |
| 11. | 15110518c | 15 11 41.2 | 05 18 09.2 | 2003-05-18 | 4047 | 1994 | 49 | 48.8 |
Notes: a Total and background subtracted counts in circle with energies between 0.5 keV and 7 keV; b the secondary X-ray source resolved in our Chandra image. c Chandra archival data.
The Chandra ACIS-S data were collected during the 2010–2011 epoch (see Table 2 for details). All targets were placed at the aim point on the back-illuminated ACIS CCD (S3). The observations were made in VFAINT mode with 1/8 CCD readout to avoid pileup if sources were to be bright. All 10 targets were detected by Chandra with a number of counts between 3 and 1,677.
The X-ray data analysis was performed with the CIAO version 4.6 software (Fruscione et al., 2006) using CALDB version 4.4. We processed the data by running CIAO tool acis-process-events and applied the newest calibration files, filtered VFAINT background events, and ran a sub-pixel event-repositioning algorithm (and set pix_adj=EDSER). This final step provides the highest angular resolution X-ray image data for the most up-to-date ACIS-S calibration. All spectral modeling was done in Sherpa111http://cxc.harvard.edu/sherpa/ (Freeman et al., 2001; Refsdal et al., 2009). We used the Cash and Cstat fitting statistics (Cash, 1979) and the Nelder-Mead optimization method (Nelder & Mead, 1965).
3.1. Image Analysis
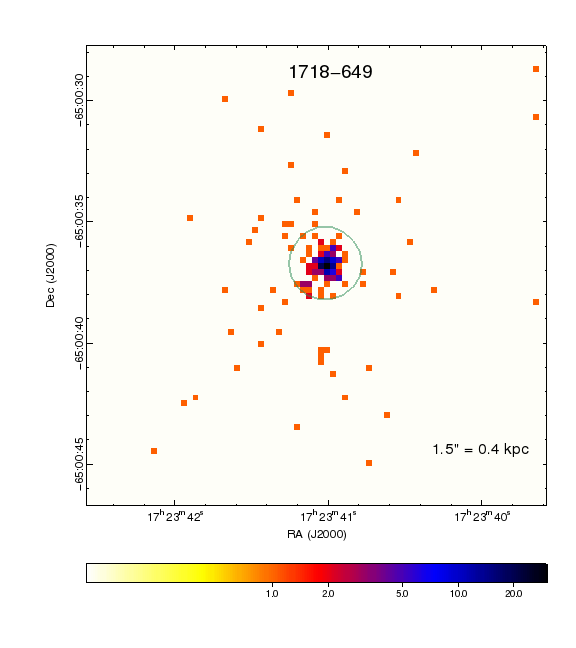
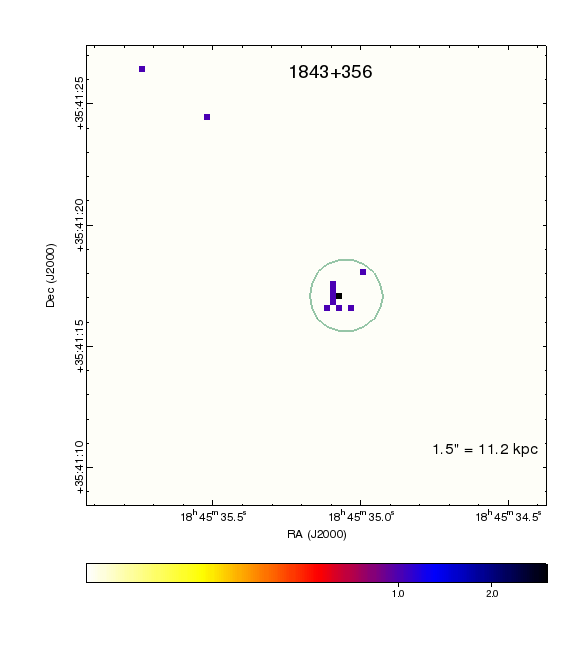
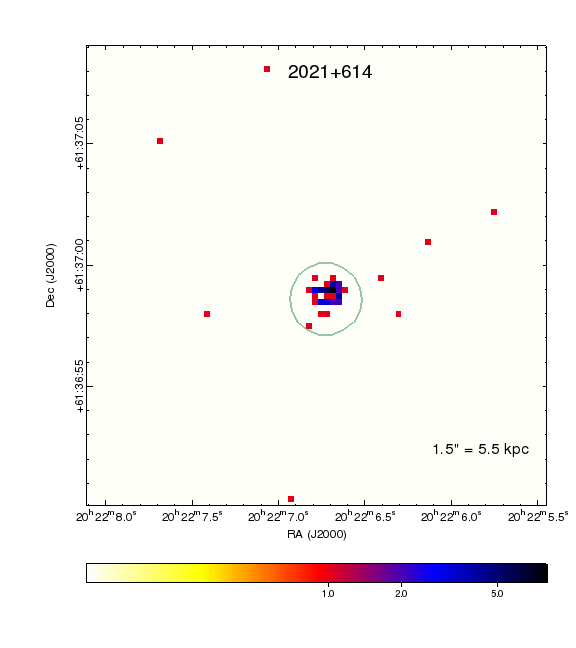
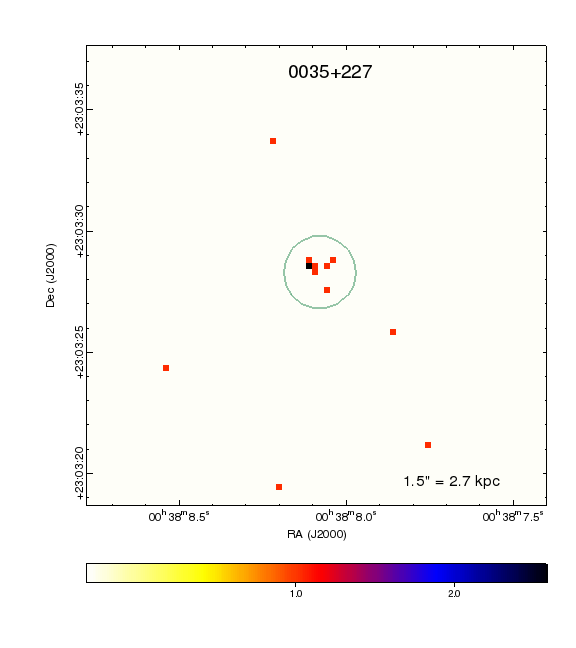
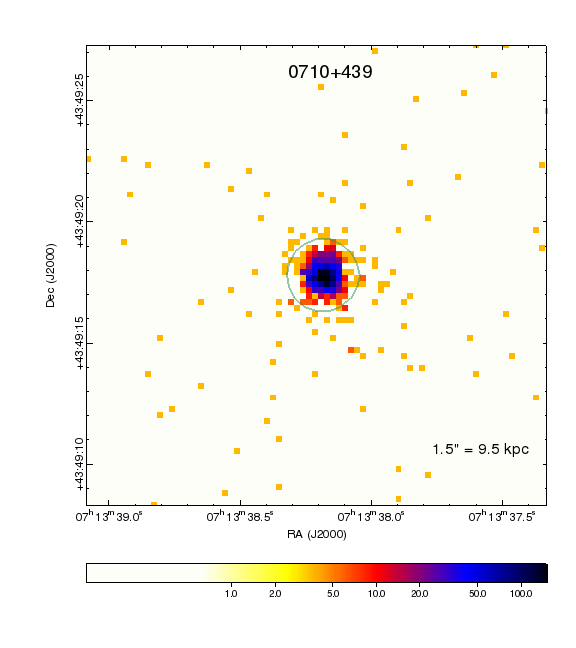
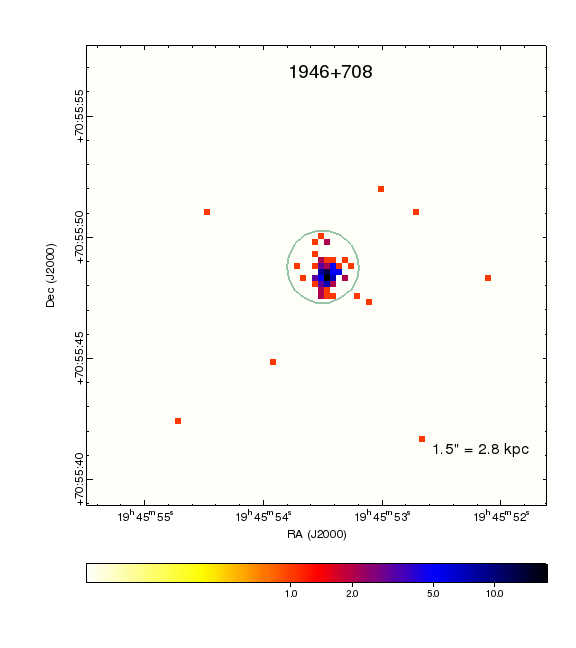
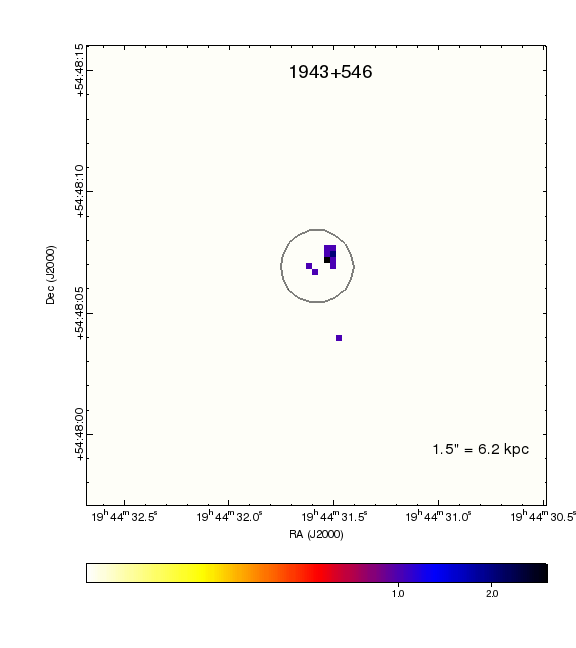
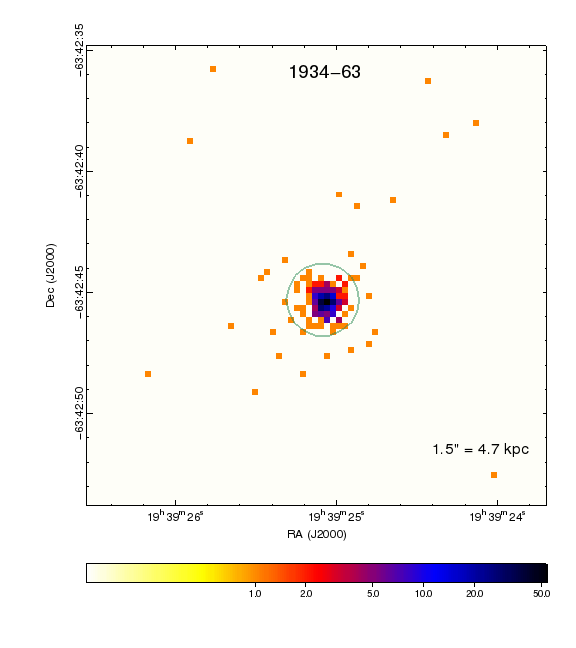
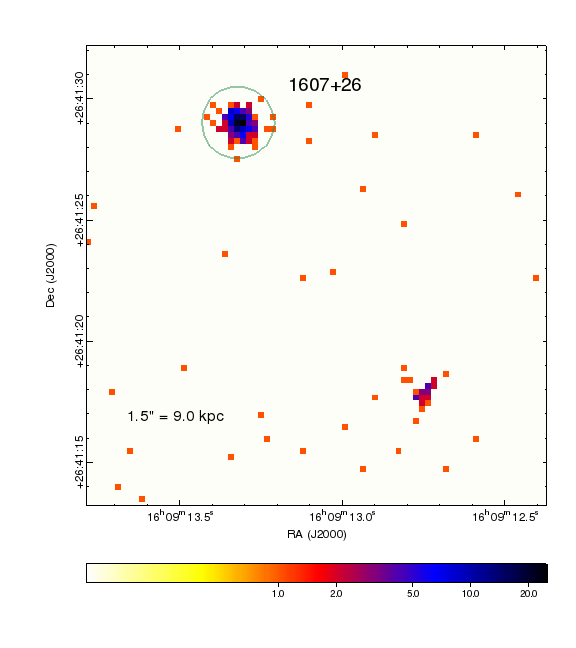
We inspected the Chandra data using ds9 and visually confirmed the location of each source, and also defined the source and background regions for further spectral extractions. Figure 2 displays the ACIS-S images of all the targets (denoted in the panels with green circles), except for which is detected with 3 counts only ()222The is the probability that the observed counts are due to the Poisson background fluctuations. indicates a detection. It is derived via simulations.. The target is the brightest source in the image. We stress that due to the different redshifts of our CSO sources, the Chandra observations probe physical scales that differ by 1.5 orders of magnitude (0.4–11.2 kpc; Figure 2).
Hints of extended X-ray emission in the three sources with the highest number of counts (07100439, 1718649, 1934638), or a secondary X-ray source (in 1607268) could be seen in the images. We investigated the significance of the extended X-ray emission using surface brightness analysis. We compared the observed surface brightness profiles to the CHART333http://cxc.harvard.edu/chart/ simulated PSF profile expected for a point source.
| # | Source | Norm | Flux (soft) | Flux (hard) | Cstat/d.o.f | |||
| name | [ cm-2] | [ cm-2] | [10-6 ph cm-2 s-1] | [ erg cm-2 s-1] | [ erg cm-2 s-1] | |||
| 1. | 1718649 | 7.15 | 0.08 | 1.6 | 80.2 | 18.6 | 35.3 | 334.9/443 |
| 2. | 1843356 | 6.75 | 0.8 | (1.7) | 4.64 | 1.1 | 2.2 | 68.0/444 |
| 3. | 2021614 | 14.01 | 0.8 | 10.6 | 2.7 | 19.3 | 212.2/443 | |
| 4. | 0035227 | 3.37 | 1.4 | (1.7) | 8.2 | 1.8 | 3.6 | 72.8/444 |
| 5. | 0116319a | 5.67 | ||||||
| 6. | 0710439b | 8. | ||||||
| 7. | 1946708 | 8.57 | 1.7 | 1.7 | 105.3 | 24.4 | 36.6 | 296.3/443 |
| 8. | 1943546 | 13.15 | 1.1 | (1.7) | 7.8 | 1.8 | 3.7 | 76.5/444 |
| 9. | 193463 | 6.16 | 0.08 | 1.67 | 29.6 | 5.0 | 12.3 | 330.2/443 |
| 10. | 160726 | 4.1 | 1.4 | 7.03 | 1.6 | 4.8 | 347.1/443 | |
| secondaryc | 4.1 | 1.4 | 1.06 | 0.2 | 0.6 | 143.6/443 | ||
| 11. | 15110518 | 3.29 | 1.0 | 22.8 | 5.6 | 31 | 203.8/443 |
Notes: Unabsorbed flux in the observed energy range (soft: 0.5–2 keV; hard: 2–10 keV, extrapolated from the model fitted over the 0.5–7 keV range); All uncertainties are given as for one interesting parameter; Upper limits are 3 limits; a 3 counts were detected in the source region and no model fitting was performed for this source; We list the 3 flux limit estimated using srcflux tool which performs simulations (Kashyap et al., 2010). b see Table 4; c the secondary X-ray source resolved in our Chandra image with limit at z=0.
3.2. Spectral Analysis
The X-ray spectra and corresponding calibration files (arf and rmf) were extracted with the CIAO script specextract for all the sources. We assumed a circular region with 1.5′′ radius centered on the position of each source for the spectral extraction. A local background was extracted assuming an annulus with inner and outer radii equal to and , respectively. We compared the total number of counts and net counts for each source (Table 2). We assessed that the background was negligible in all cases ( count in the source extraction region for all targets, except for 0710439 with 2.1 counts, e.g. of the source counts), and therefore we ignored it during the spectral analysis (i.e. we modeled only the source spectra).
We applied an absorbed power law model to the spectral data: ph cm-2 s-1 keV-1, where is the normalization at 1 keV, is the photon index of the power law, and and are the equivalent column densities for the two absorption components, Galactic and intrinsic to the source. In the Sherpa nomenclature, this baseline spectral model was defined as xsphabs*xszphabs*powlaw1d and fit to the data in the 0.5–7 keV energy range. The Galactic absorption was always fixed at the respective value, listed for each source in Table 3, while the intrinsic absorption column was allowed to vary. The photon index was fixed to 1.7 (a typical value for unabsorbed cm-2 AGN, Burlon et al. 2011) while modeling the sources with a low number of counts, , in order to obtain a limiting value or detection of the intrinsic absorption. The range of the photon index results in the intrinsic column density consistent to within 1 with the values listed in Table 3. The photon index was a free parameter in sources with a larger number of counts.
4. Results
We detected X-ray emission associated with all the CSOs in our Chandra sample. However, because the majority of our Chandra observations were short, designed for X-ray detections, the detailed analysis were only possible for about half of the sources in the sample. In the short 5 ksec observations the detected source counts ranged from 3 to 231 counts (see Table 2). The background in such a short Chandra observation of a point source is very low and even 3 counts in 0116319 constitute a detection at high significance level (p-). However, we can only provide a limiting flux in this case (see Table 3), while for the other sources we were able to extract Chandra spectrum and apply parametric models.
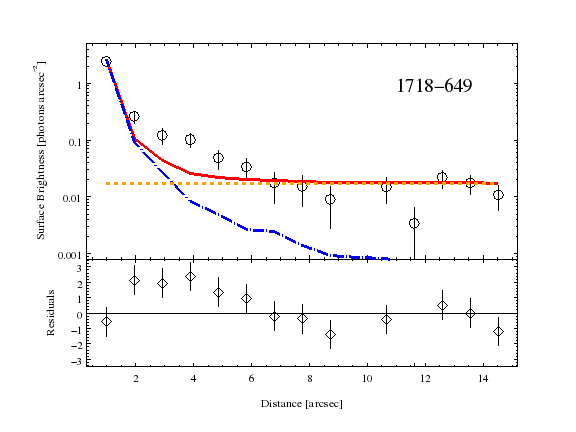
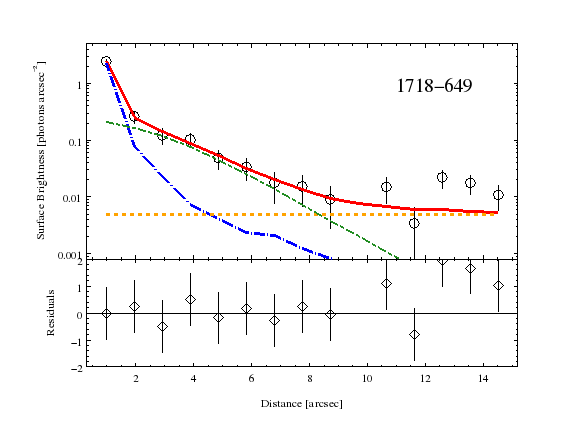
The three longer exposures provided data of high enough sensitivity to explore the CSOs X-ray environment on arcsecond scales. We extracted the X-ray surface brightness profiles assuming the annuli regions centered on the radio source position to quantify the presence of an X-ray emission outside the central point source. In two cases, 07100439 and 1934638, the profiles are consistent with the background level outside a 6′′ radius. The residuals in the innermost circular regions (), slightly deviate from zero suggesting the possibility of an additional emission component. However, the formal significance test gives a p-value of 0.33, which does not allow us to reject the null hypothesis that the source is point-like. We concluded that in these two sources the observed X-ray emission originates in an unresolved region within (corresponding to kpc and kpc for each source, respectively). There is no extended X-ray emission on large scales detected above the background level of 0.0048 cts arcsec-2.
The surface brightness profile for the third object, 1718649, is shown in Figure 3. An excess of the observed emission above the PSF profile is visible at the distances within 2–6′′ ( kpc) from the radio source position indicating an extended X-ray emission present in this source. We add another model component (the standard beta model, beta1d in Sherpa; King 1962) to account for this emission. We obtained a 1 lower limit of in our best fit model. Deep Chandra observations are needed to better constrain the properties of this emission.
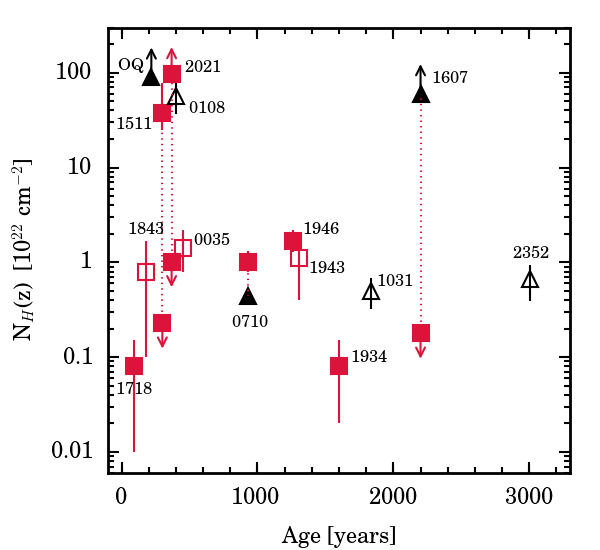
In general, our baseline absorbed power law model provided a good description of the X-ray continua of the CSO sources. The modeling results are given in Table 3 which displays the Galactic and intrinsic absorption columns, photon index, and the unabsorbed flux in the soft (0.5–2 keV) and hard (2–10 keV; extrapolated from the model fitted over the 0.5–7 keV band) X-ray bands. The uncertainties are given as 1 for one interesting parameter. In seven CSOs the photon index was a free parameter and we obtained –1.7, with the exception of 2021614 and 15110518 where . The intrinsic absorption component was required at confidence level in three CSOs (0710439, 1946708, and 0035227; note though that in 0035227 the photon index was fixed at 1.7) with – cm-2. In three other cases we were able to derive only upper limits on the intrinsic column densities (but see Section 4.2). The X-ray spectra of the remaining five sources are suggestive of the presence of an intrinsic absorbing neutral hydrogen column with –1022 cm-2, although at low statistical significance.
Even though we detected an extended X-ray emission in 1718649, the lowest redshift CSO in our sample, we find that the X-ray spectrum of this source is quite well modeled with an absorbed power law. However, our Chandra spectrum has only 224 counts (see Table 3) and any detailed analysis of potential contributions from emission associated with the extended medium would require higher quality X-ray data.
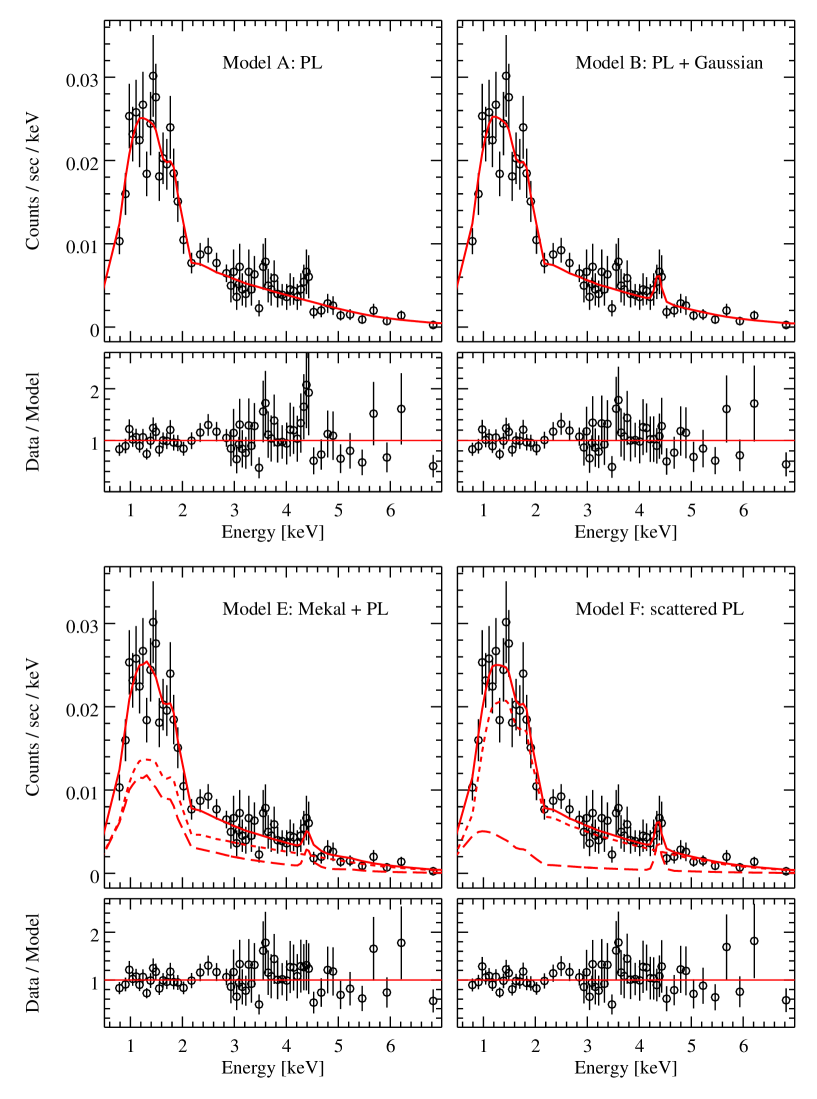
Below we provide a detailed description of the X-ray results for three particular CSOs in our sample: 0710439 has a hard band narrow emission line (Section 4.1); 2021614 and 15110518 have an extremely hard X-ray photon index compared to typical AGN (Section 4.2); and 160726 is accompanied by a secondary X-ray source resolved within the prior XMM-Newton extraction region (Section 4.3). We also comment on 193463 and 1946708 observed previously with Beppo-SAX and revisited with our Chandra program (Section 4.4).
| # | Model | kT | EW | Flux | Flux | Cstat/d.o.f. | ||||
| descriptiona | [ cm-2] | [keV] | [keV] | [eV] | [soft] | [hard] | ||||
| A | PL | 0.58 | 1.59 | 490.3/443 | ||||||
| B | PL and G | 0.61 | 1.64 | 6.62 | 154 | 480.3/441 | ||||
| C | TB and G | 0.49 | 13.6 | 6.63 | 164 | 475.8/441 | ||||
| D | PL and Apec | 0.58 | 1.42 | 5.4 | 485.0/441 | |||||
| E | PL and Mekal | 0.56 | 1.39 | 5.2 | 484.4/441 | |||||
| Fb | scattered PL and G | 1.02 | 1.75 | 0.13 | 6.62 | 1.40 | 477.2/440 |
Notes:
a PL – power law; G – gaussian line; TB – thermal bremsstrahlung;
is the fraction of the intrinsic power law scattered into
our line of sight by a photoionized medium that is also responsible for the Fe XXV iron line emission; Unabsorbed flux in
the soft (0.5–2 keV) and hard (2–10 keV) bands extrapolated
from the model fitted over the 0.5–7 keV range, in units of [ erg cm-2 s-1].
A – phabs * zphabs * powerlaw
B – phabs * zphabs * (powerlaw + zgauss)
C – phabs * zphabs * (zbremss + zgauss)
D – phabs * zphabs * (apec + powerlaw)
E – phabs * zphabs * (mekal + powerlaw)
F – phabs * (zphabs * powerlaw + fsc * powerlaw + zgauss)
All models modified by Galactic absorption with cm-2;
abundances in apec and mekal models fixed at 0.5 Solar value;
mekal density fixed at 1 cm-3; width of the
Fe line fixed at keV.
b EW calculated with respect to the unabsorbed scattered power law, fsc * powerlaw.
4.1. 0710439
The photon index and the amount of intrinsic absorption in our Chandra spectrum of 0710439 agree very well with the earlier XMM-Newton results of Vink et al. (2006). The source did not vary between the XMM-Newton and Chandra observations showing consistent 2–10 keV flux of about erg cm-2 s-1. However, we find clear residuals in the hard X-ray band suggestive of the presence of an emission line (Figure 4, top/left). To account for this feature we added a Gaussian component to the absorbed power-law spectral model (Model B in Table 4; Figure 4, top/right). The line is unresolved ( eV; fixed) with the best fit line energy of keV (rest frame) and the equivalent width eV. Visual inspection of the XMM-Newton modeling presented by Vink et al. (2006) tentatively hints at the presence of an emission line at similar energy also in the XMM-Newton dataset.
Emission lines at the energies within 6.4–6.9 keV due to iron are common in X-ray spectra of accreting black holes (Krolik & Kallman, 1987; George & Fabian, 1991; Zycki & Czerny, 1994), including radio-quiet and non-blazar radio-loud AGN (e.g., Hardcastle et al. 2009, Winter et al. 2010; Fukazawa et al. 2011; Zhou, Zhao & Soria 2011) and Galactic black hole binaries (e.g., Done et al. 2007). In particular, a narrow fluorescent neutral Fe K line at 6.4 keV (rest frame) seems to be omnipresent in the spectra of radiatively efficient AGN (Bianchi et al. 2004; Nandra et al. 2007; Iwasawa et al. 2012; and references therein), and is believed to originate from a cold matter, e.g. a molecular torus, illuminated by hard X-rays.
Narrow 6.6–6.9 keV emission lines from an ionized iron have been observed e.g. in luminous PG quasars, including the radio-loud source Mrk 1383 (Porquet et al. 2004), and in a substantial fraction of Seyfert 1 galaxies (Patrick et al. 2012). These lines could be emitted by a hot ionized region of an accretion disk illuminated by an external X-ray source (e.g., Matt et al., 1993; Różańska et al., 2002); a distant gas, photoionized by the nuclear illumination (e.g., Bianchi & Matt 2002); or a diffuse thermal plasma at keV (Smith et al., 2001)
The best fit parameters of the line detected in 0710439 assuming Model B (see Table 4) are consistent with the first scenario and with the He-like Fe XXV line emission444The line is most probably a blend of not resolved resonance (6.700 keV), intercombination (6.682 keV and 6.668 keV), and forbidden (6.637 keV) lines. in a system with an inclination angle –0.6 and an accretion rate (Matt et al. 1993). However, in order to study the origin of this emission line in more details we also tested four other spectral models of increased complexity that are typically considered for AGN X-ray emission(Table 4). Given the quality of the current data all the models are statistically equivalent, but considering the range of the best fit parameters we can potentially rule out some of them.
First, we parametrized the X-ray continuum with a thermal bremsstrahlung model (zbremss) and kept the Gaussian profile to fit the emission feature (Model C in Table 4). We found a statistically good fit, but with a relatively high temperature, keV. Next, we replaced the bremsstrahlung continuum with a single temperature plasma (mekal) model (metal abundances fixed at 0.5 the Solar value) and found that at this high temperature the strength of the ionized Fe lines was overpredicted, especially at the energy of the fully ionized Fe XXVI, while the data did not provide evidence for the presence of the Fe XXVI line. Similar result was obtained when we used the apec plasma model instead of the mekal model. Hence we concluded that single component thermal models are not likely given the physical properties required by the best fit parameters. Therefore, we tried a two-component model, consisting of a power law and either mekal or apec (Models D and E in Table 4). We obtained the best fit plasma temperature keV, and a hard photon index, –1.5, which are consistent with the prediction of jet/lobe emission.
Finally, we tested a model in which the spectrum is composed of the intrinsically absorbed primary emission (intrinsic emission modeled with a power law) and an unabsorbed fraction of the same emission scattered by a warm medium. The warm medium is also producing the iron emission line (Model F in Table 4). In this scenario the photon index is , the primary continuum is absorbed with a column of cm-2, and the scattering fraction is 13 %. The EW of the line (computed with respect to the scattered continuum) is 1.4 keV, in agreement with the values found by Bianchi & Matt (2002) for column densities of the order of a few cm-2 (see their Figure 4). The best fit parameters of the models A, B, E and F, and the ratio of the data to the models are presented in Figure 4. We conclude that with the present data we are not able to state if the soft X-rays and the He-like iron line in 0710439 are due to scattered nuclear emission (Models B or F) or thermal emission of the ISM heated through interactions with the expanding jet (Models D and E).
The neutral iron K line has been previously reported in CSO sources observed with XMM-Newton (OQ 208, Guainazzi et al. 2004; and 160726, Tengstrand et al. 2009), while Risaliti et al. (2003) detected neutral and highly ionized ( keV) iron emission lines in 1934638 and 1946708 (respectively) using Beppo-SAX. These two emission lines are not present in the low counts Chandra spectra555p-values of 0.9 for 193463 and 0.4 for 1946708 when testing for the line with the null hypothesis of the power law model, and using the simulations as described in Protassov et al. (2002) (plot_pvalue in Sherpa). of 160726 (see Sec. 4.3) and of the two Beppo-SAX sources (see Sec. 4.4).
Müller et al. (2015) detected a narrow emission line in a CSO candidate (PMN J16034904), and derived the redshift of the source assuming that the most likely rest frame energy of the line is 6.4 keV. The presence of a mildly ionized Fe line in the spectrum of 0710439 indicates that there might be a systematic error in the redshift derivation of PMN J16034904 because of a range of ionization states of iron producing the emission lines in the CSO sources.
Lastly, we note that 0710439 has the highest number of counts (1,679) among the sources in our sample. The remaining CSOs were detected with 3–362 counts. A higher number of counts in Chandra spectra are needed for detecting narrow spectral features.
4.2. 2021614 and 15110518
The absorbed power-law model applied to two CSOs, 2021614 and 15110518, resulted in an unusually hard photon index of and respectively. Typically, such a low value indicates a strong nuclear obscuration able to cover completely the source of the primary X-ray radiation. The observed spectrum is then dominated by a Compton reflection hump (and an accompanying neutral iron line) from a distant material, presumably a molecular torus, resulting in an artificially low photon index. AGN with these properties are called ‘Compton thick’, and the amount of the hydrogen absorbing column required to distort the X-ray spectrum in this manner is (e.g., Comastri, 2004). The first radio-loud Compton thick AGN was found in OQ 208, a CSO source observed with XMM-Newton by Guainazzi et al. (2004). Tengstrand et al. (2009) speculated that 160726 is also a Compton thick CSO. They based their argument on the photon index obtained when an absorbed power-law model was applied to the XMM-Newton data of this source. By analogy with OQ 208 and 160726, it is likely that 2021614 and 15110518 are Compton thick CSO candidates. Our result on the intrinsic absorption in these sources would then be significantly underestimated because in our fit we do not account for the column density that would be needed to absorb the primary continuum. Indeed, when we fit the data of 2021614 with the sum of an intrinsically absorbed power law and unabsorbed reflection (pexrav) component we obtain Cstat/d.o.f. = 209/442, cm-2. The resulting photon index of the underlying power law would be, however, very soft, , and the unabsorbed intrinsic 2–10 keV luminosity would increase by an order of magnitude making 2021614 the second CSO in our sample (in addition to 0710439) to exceed erg s-1 (comparable to the Eddington luminosity of a 106 M⊙ black hole).
In 15110518 the Compton thick model results in Cstat/d.o.f. = 198.2/443, cm-2, and erg s-1.
On the other hand, we do not see any evidence for the presence of a neutral iron line in the spectra of 2021614 and 15110518. The line is unconstrained in 15110518. In 2021614 we can only derive an upper limit on the EW of this line, keV, inconsistent with the expected range derived by Matt et al. (1996; –2.7 keV). Thus, it is interesting to note that the low X-ray photon index and the low intrinsic absorption can be understood in the context of a non-thermal X-ray lobe emission model for the GPS/CSO sources (Stawarz et al., 2008; Ostorero et al., 2010).
Unfortunately, the quality of our present Chandra data is not sufficient to discriminate between the Compton thick absorption and X-ray lobe emission scenarios for X-ray emission in 2021614 and 15110518 (only 54 and 49 counts collected in 5 ksec and 2 ksec Chandra observations, respectively). Deeper X-ray observations with Chandra or XMM-Newton accompanied with the hard keV band exposures (NuSTAR) would be needed in order to resolve this issue.
4.3. 160726
Owing to the superior spatial resolution of Chandra we resolve the source region of 160726 observed with XMM-Newton by Tengstrand et al. (2009) into two point-like X-ray sources (see Figure 2). The location of 160726 matches the position of the upper left source visible in Figure 2 with the detected 213 counts. The secondary source separated by 13.5′′ (lower right corner in Figure 2) has 32 counts and its spectrum could be modeled with an absorbed power law (assuming only Galactic absorption since the redshift to the source is unknown) with a photon index (see Table 3). This means that the XMM-Newton spectrum obtained by Tengstrand et al. (2009) represents a combination of emission from 160726 and from the secondary source. We detect an order of magnitude decrease between the hard X-ray fluxes of XMM-Newton ( erg s-1 cm-2) and Chandra ( erg s-1 cm-2). This change is larger than the sum of the fluxes from the two sources, and it is larger than the absolute calibration uncertainties between the Chandra and XMM-Newton satellites (Tsujimoto et al., 2011). Therefore, we concluded that the X-ray flux of one or both of the sources decreased during the years interval between the two observations.
We searched the SDSS, 2MASS and FIRST catalogs to check the identification of the secondary X-ray source, but did not find any corresponding emission. If the source were associated with 160726 then it would be located 80 kpc away along the axis of the CSO radio structure, on the extension of its radio jet (see Nagai et al. (2006) for a discussion of the CSO radio morphology). It is interesting to speculate that the observed secondary X-ray source might be a hot spot due to the past radio activity in the framework of the intermittent scenario for the GPS sources. However, assuming the expansion velocity of (Table 1) the age of this feature would be 1 Myr, while the terminal hot spots are expected to die very quickly, on timescales Myr once the jet switches off (Carilli et al., 1988). Therefore, the nature and the association of this secondary source with 160726 remains unclear.
Contrary to Tengstrand et al. (2009) who reported in 160726, we find , an X-ray photon index that is fairly common in a population of nearby radio-quiet and radio-loud AGN (e.g. Winter et al. 2009, Fukazawa et al. 2011). We do not detect any evidence of the neutral iron K line in the spectrum. This line was, however, required by the XMM-Newton data of Tengstrand et al. (2009) as part of their Compton reflection dominated model for this source.
One explanation of this result could be that 160726 is a transitional Compton thick/thin AGN. Transitions between the Compton thick and thin regimes have been previously reported in the so-called ‘changing look’ AGN (see, e.g., Matt et al. (2003); Risaliti et al. 2005; 2010; 2011; and references therein). The Compton thick/thin switches are thought to be due to an X-ray absorber made of clouds with –1024 cm-2 crossing our line of sight on timescales between hours and weeks.
If the flux from the secondary source were constant between the two exposures, then 160726 would have been times brighter in the reflection dominated state recorded with XMM-Newton than in our observation. This clearly contradicts the ‘changing look’ AGN scenario. To reconcile the hard X-ray flux variability with the ’changing look’ hypothesis, 160726 could not have contributed more than 200 cts to the XMM-Newton data, meaning that, the secondary X-ray source would have to be times brighter than 160726 in the XMM-Newton observation. This would imply that the X-rays detected and modeled by Tengstrand et al. (2009; including the iron line) originated from the secondary source rather than from 160726, eliminating any spectral information about the state of 160726 during the XMM-Newton observation. It would also indicate that the photon index of the secondary source changed from to , its iron line disappeared, and the hard flux increased by a factor of between the two exposures. These spectral properties would be very difficult to explain, especially with no radio, optical and -ray identification available at present for the secondary source. Thus, we reject the possibility that X-ray variability observed in 160726 is due to the Compton thick/thin switches.
The alternative explanations include fading of the nuclear and reflected 160726 emission, or a heavy obscuration with a column density cm-2, as a result of which Chandra would observed thermal emission of the ISM. Finally, in the non-thermal scenario of Stawarz et al. (2008) and Ostorero et al. (2010) any potential intrinsic variability of the X-ray continuum is expected to take place on timescales much too long to account for the results of the Chandra observations of 160726.
Clearly, future X-ray monitoring of this young radio source is needed in order to determine its nature and X-ray variability properties.
4.4. 193463 and 1946708
Risaliti et al. (2003) reported that 193463 and 1946708 showed Beppo-SAX spectra typical of the Compton-thick sources with cm-2, strong Fe K line, and the reflection hump. They also considered Compton-thin absorbers as a secondary explanation of the data. We have revisited both sources with Chandra. We could only obtain a 3 upper limit on the line equivalent width of keV in 193463 and of keV in 1946708, assuming that the lines are unresolved ( eV) and located at the rest energies, 6.3 keV and 6.9 keV, respectively (as in Risaliti et al. 2003). Future more sensitive X-ray observations are needed to constrain the parameters of these lines.
We measure a relatively low intrinsic absorption column density in both sources ( cm-2) and do not confirm their Compton-thick nature (see Table 3). We conclude that either the BeppoSAX spectra have been contaminated by other X-ray sources in the field, given the 2 arcmin source extraction regions in the BeppoSAX observations, or the Compton-thin model is more appropriate explanation of the data, or that these sources belong to the AGN class that switches between the Compton thick and thin states.
5. Discussion
We have investigated properties of the X-ray emission in a sample of 16 young radio sources with known redshift and kinematic age measurements of their radio structures. All sources in our sample have symmetric radio morphology, have been classified as CSOs and have been associated with radio galaxies. They do not display strong AGN emission in the optical band because they either do not contain an optical-UV bump characteristic of the AGN, or because the optical emission has been absorbed by a dense medium in the central region of the host galaxy. We detected six of the sources in our sample for the first time in X-rays.
5.1. Models for CSO X-ray emission
The angular sizes of the CSO radio emission are of the order of milliarcseconds (e.g. Readhead et al., 1996b), and as such are too small to be resolved with Chandra. As a result, X-ray emission associated with any compact radio jets, lobes, or bow shocks potentially present around the lobes is integrated within the 1.5′′ radius of the circular source extraction region, corresponding to 0.4–11 kpc in our sources, depending on redshift. Consequently, the CSOs X-ray emission contains information on both the circumnuclear region (on sub-pc and pc scale), and the surrounding ISM (kpc scale). Different physical processes may, thus, contribute to the observed X-ray emission (see, e.g. Siemiginowska, 2009, for a review). The CSOs X-ray emission could arise from the AGN nucleus (X-ray corona) indicating the nature of the nucleus and its accretion state (Guainazzi et al., 2004; Vink et al., 2006; Siemiginowska et al., 2008; Tengstrand et al., 2009). However, if the absorption column is larger than 1024 cm-2, the nucleus could be hidden and the observed X-rays would be dominated by the thermal emission of the hot ISM from shocks driven by the expanding jet (Heinz et al., 1998; O’Dea et al., 2000), or by a reprocessed nuclear emission due to the reflection and/or scattering effects (e.g. Guainazzi et al., 2006). On the other hand X-rays can also be emitted by compact radio lobes through inverse-Comptonization of local radiation fields (Stawarz et al., 2008; Ostorero et al., 2010; Migliori et al., 2012). These models result in different predictions on the X-ray photon index, amount of intrinsic X-ray absorption, and the luminosity and could be tested with deep observations.
The CSOs in our sample are rapidly expanding, as demonstrated by their measured hot spot expansion velocities spanning the 0.07–0.4 range (Table 1, and references therein). Based on these velocities, the CSOs kinematic age estimates range between 100 and 3000 yrs. These are, thus, the youngest radio sources which can provide information about the accretion state of supermassive black holes shortly after the onset of the jet formation, as well as about the properties of the environment into which the newly born jets are evolving, and with which they are interacting.
5.2. Environment of CSO
Jets and lobes in young radio sources, confined to the central parts ( kpc) of their host galaxies, should interact with a denser and less homogeneous medium than their evolved ( kpc-long) analogs. Indeed, our results support this idea. We detected multi-phase galactic environments consisting of diverse gaseous components co-spatial with the young expanding CSO radio structures: (1) the extended thermal component in 1718649 (Section 3.1, Figure 3); (2) possibly an ionized diffuse plasma giving rise to the He-like Fe emission line in 0710439 (Section 4.1, Figure 4); (3) neutral hydrogen with moderate column density, –1022 cm-2, in the majority of the sources (Table 3, Figure 1, middle); (4) possibly a dense Compton-thick absorber in 2021614 and 15110518 (Section 4.2).
Recent multi-wavelength studies also provide evidence that CSO radio sources are embedded in complex gaseous environments. In the IR band the Spitzer data show a variety of the IR line properties indicating an enhanced star formation rates in host galaxies of compact radio sources (Willett et al., 2010; Guillard et al., 2012; Dicken et al., 2012). One explanation could be a jet-induced star formation in CSOs (Labiano et al., 2008), suggestive of the interactions between the jet and dense environment. Tadhunter et al. (2011) points to a possible selection bias in flux limited radio samples that impacts general conclusions about the epoch of star formation and triggering the radio source. However, these IR results are consistent with the CSO source being embedded in a dense environment.
In the radio band, Geréb et al. (2014, 2015) show that the properties of the HI absorption line in the spectra of GPS and compact steep spectrum sources (CSS; a more evolved stage compared to the GPS sources) differ substantially from those of the extended radio sources. Based on the correlation between the amount of HI absorption and the type of a radio source (55% HI detection rate, and optical depths higher in the compact sources than in the extended sources) the authors argued that the compact radio sources are embedded in a medium that is rich in atomic gas. Moreover, the HI kinematics in the GPS/CSS sources (broader and more asymmetric, blue-shifted profiles) suggested that the gas is unsettled and may form outflows. They concluded that the evidence of interactions between the radio sources and rich ambient environment is more frequent in the young/compact sources than in the extended sources.
Finally, studies of the relationship between the X-ray and radio absorbing columns reveal a correlation between the and absorption in GPS/CSO sources (Ostorero et al., 2016), suggesting that the X-ray and radio absorbers are co-spatial. This is an important constraint, given the latest radio results from the low frequency radio observations (Callingham et al., 2015). They seem to rule out the synchrotron self absorption process and favor the free-free absorption as the origin of the radio obscuration in the GPS source, PKS B000842. This again points to a rich, multi-phase environment impacting the evolution of CSOs.
It is, thus, interesting to interpret our findings on the CSOs intrinsic neutral hydrogen column density in the context of the absorption properties of an unbiased population of AGN. We compare our results with those obtained by Burlon et al. (2011) for their subsample of Sy1.8–2 galaxies from the hard X-ray Swift/BAT survey (note that CSOs are observed at large inclinations to the jet axis, and as such should be compared with type 2 AGN). In the sample of CSOs presented in Table 1 (see Figure 5 top) we observe that 2 of 15 (13%) CSOs show evidence for Compton-thick absorption with cm-2 (33% if we include 2021614, 15110518 and 160726 proposed to be Compton-thick candidates in this work and in Tengstrand et al. 2009), respectively, as compared to 20% in Sy1.8-2 galaxies in Burlon et al. (2011). Conversely, 9 of 15 (60%) sources have cm-2 (40% if we exclude 2021614, 15110518 and 160726). Instead, only 7% of the Sy1.8–2 galaxies have column densities in this range. While the fraction of Compton-thick CSOs seems to be in a relatively good agreement with that found in a Sy1.8–2 population of Burlon et al. (2011), especially given the small size of our CSOs sample, the overabundance of sources with only moderate intrinsic obscuration seems puzzling. Hardcastle et al. (2009) pointed out that the Narrow Line Radio Galaxies (NLRG), considered to be the more evolved analogues of CSO, have cm-2 associated with the absorption of the nuclear emission by a molecular torus. Consequently, the large fraction of CSOs with hydrogen column densities lower than those typically found in NLRGs, may indicate — echoing the conclusions of Ostorero et al. (2016) — that the CSO X-ray obscuration is caused by the gas located on much larger scales than molecular tori.
5.3. X-ray continuum of CSO
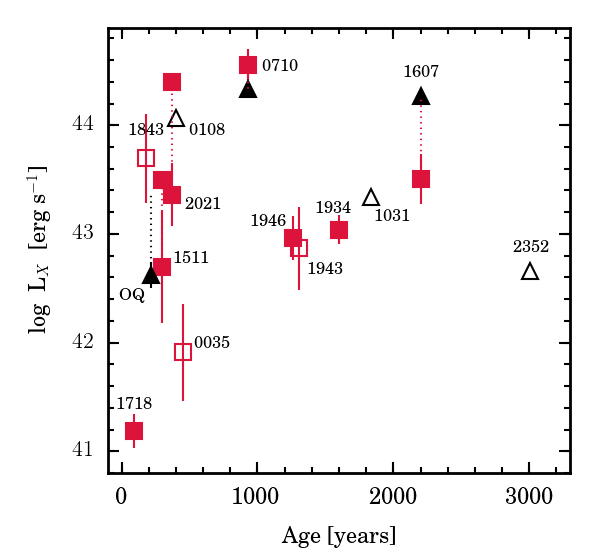
The 2–10 keV X-ray luminosities of our sources cover 3 orders of magnitude (Figure 5 bottom), – erg s-1, typical for the AGN (e.g Akylas et al., 2006; Winter et al., 2009; Fukazawa et al., 2011; Jia et al., 2013; Aird et al., 2015). Interestingly, we observed that the oldest CSOs ( years) tend to be relatively bright in X-rays, with luminosities erg s-1, while the youngest CSOs can be found at any X-ray luminosity covered by the sample.
We found hard X-ray spectra with a photon index –1.7 in five (out of seven) sources, where we were able to model the photon index. Among non-blazar AGN, this range of photon indices is often seen in radio-quiet AGN, although it appears to be the most compatible with the average photon index of the non-blazar radio-loud AGN (Reeves & Turner 2000; Kelly et al. 2008; Sobolewska et al. 2009, 2011 but see Young et al. 2009). The difference between the average X-ray spectral slopes in radio-loud and radio-quiet AGN populations may result from either a dilution of the X-ray coronal emission, or a non-negligible contribution from the non-thermal emission of jets (Belsole et al., 2006). It is, thus, likely that in the particular case of CSOs the X-ray jets and/or lobes contribute to the observed X-ray radiation, as suggested by Stawarz et al. (2008) and Ostorero et al. (2010). The photon indices we observed would then be consistent with a non-thermal scenario in which low-energy photons are inverse Compton upscattered to X-ray energies by electrons with a power-law spectral energy distribution with a rather standard spectral index, .
Thus, the shape of the absorbed power law X-ray continuum that we derived for the CSOs in our sample is consistent with either the nuclear (X-ray corona) emission absorbed on the torus scale ( pc), or an extended (X-ray jets/lobes) emission absorbed on the host galaxy ( kpc) scale. We note that the results described in Section 5.2, along with that of Ostorero et al. (2016), favor the latter possibility. Instead, high intrinsic luminosities, exceeding 1044 erg s-1, derived for several CSOs (Figure 5, bottom panel), together with the likely detection of the reprocessed/scattered nuclear light in 2021614, 15110518 (Section 4.2) and 0710439 (Section 4.1) may indicate the dominant AGN contribution to the observed X-ray emission of young radio sources.
Our results do not appear to favor thermal emission of the diffuse ISM plasma as the origin of the CSO X-ray continuum, unless the soft X-rays and the He-like iron emission in 0710439 are interpreted as a sole example in which the ISM is heated by the expanding radio structure (Section 4.1, Figure 4, Model E).
6. Summary and Conclusions
We examined the X-ray properties of 16 young radio sources with Chandra and observed variety of interesting characteristics, which we summarize below.
-
•
We found that our CSO sample covers a wide range in X-ray luminosity, – erg s-1 and that the majority of sources contains a modest amount of the intrinsic absorption (–1022 cm-2).
-
•
We obtained the highest quality X-ray spectrum of the CSO source to date in our long Chandra observation of 0710439 and found an ionized iron emission line, keV. However, we were not able to determine the origin of the line, as it could be related to the emission from the hot ionized accretion disk illuminated by an external source, from a distant photoionized medium, or from a diffuse hot thermal plasma within the nuclear region. Depending on the model, we derived EW of the line ranging from eV (Model B) to keV (Model F).
-
•
We found a hard photon index of in 2021614 and in 15110518 consistent with either a Compton thick absorber or non-thermal emission from compact radio lobes.
-
•
We discovered that the 2–10 keV X-ray flux decreased by an order of magnitude since the 2008 XMM-Newton observation of 160726. Future monitoring of this source is needed in order to characterize and understand the nature of the variability.
-
•
We examined the highest angular resolution X-ray images of the CSOs and detected extended X-ray emission in 1718649 which needs to be studied with the deeper X-ray observations in the future.
We found that short 5 ksec X-ray observations with have proven to be effective in detecting the CSOs sources and deriving their basic X-ray properties. With our Chandra program, we observed six CSOs for the first time in X-rays, and we increased the size of the known CSOs sample with measured redshift, kinematic age, and X-ray information by 68%. The CSO X-ray population can be further extended through snapshot Chandra and/or XMM-Newton observations of seven sources whose kinematic ages have been recently derived (An & Baan 2012, Figure 1). However, it is apparent that deeper exposures are needed in order to study details of the CSOs environment (e.g., the amount of intrinsic absorption, the gaseous media co-spatial with the radio sources) and the origin of the CSOs intrinsic X-ray emission (diffused thermal vs. nuclear emission, evidence for reprocessing of the nuclear X-rays by a circumnuclear matter, thermal vs. non-thermal electron population generating the high-energy CSOs spectra, long term X-ray variability). Deep X-ray observations are also necessary in order to place critical constraints on current theoretical models for the earliest stage of radio source evolution.
Acknowledgments
We thank the anonymous referee for detailed comments. This research is funded in part by National Aeronautics and Space Administration contract NAS8-03060. Partial support for this work was provided by the NASA grants GO1-12145X, GO4-15099X, NNX10AO60G. G.M. acknowledges the financial support from the UnivEarthS Labex program of Sorbonne Paris Cité (ANR10LABX0023 and ANR11IDEX000502) L.O. acknowledges support from the INFN grant INDARK, the grant PRIN 2012 “Fisica Astroparticellare Teorica” of the Italian Ministry of University and Research, and the “Strategic Research Grant: Origin and Detection of Galactic and Extragalactic Cosmic Rays” funded by the University of Torino and Compagnia di San Paolo. Ł.S. was supported by Polish NSC grant DEC-2012/04/A/ST9/00083. This research has made use of data obtained by the Chandra X-ray Observatory, and software provided byChandra X-ray Center (CXC) in the application packages CIAO, ChIPS, and Sherpa.
References
- Astropy Collaboration et al. (2013) Astropy Collaboration, Robitaille, T. P., Tollerud, E. J., et al. 2013, A&A, 558, A33
- Aird et al. (2015) Aird, J., Coil, A. L., Georgakakis, A., et al. 2015, MNRAS, 451, 1892
- Akylas et al. (2006) Akylas, A., Georgantopoulos, I., Georgakakis, A., Kitsionas, S., & Hatziminaoglou, E. 2006, A&A, 459, 693
- An & Baan (2012) An, T., & Baan, W. A. 2012, ApJ, 760, 77
- An et al. (2012) An, T., Wu, F., Yang, J., et al. 2012, ApJS, 198, 5
- Begelman et al. (1984) Begelman, M. C., Blandford, R. D., & Rees, M. J. 1984, Reviews of Modern Physics, 56, 255
- Begelman & Cioffi (1989) Begelman, M. C., & Cioffi, D. F. 1989, ApJ, 345, L21
- Begelman (1996) Begelman, M. C. 1996, Cygnus A – Study of a Radio Galaxy, 209
- Belsole et al. (2006) Belsole, E., Worrall, D. M., & Hardcastle, M. J. 2006, MNRAS, 366, 339
- Best et al. (2006) Best, P. N., Kaiser, C. R., Heckman, T. M., & Kauffmann, G. 2006, MNRAS, 368, L67
- Bianchi & Matt (2002) Bianchi, S., & Matt, G. 2002, A&A, 387, 76
- Bianchi et al. (2004) Bianchi, S., Matt, G., Balestra, I., Guainazzi, M., & Perola, G. C. 2004, A&A, 422, 65
- Bicknell et al. (1997) Bicknell, G. V., Dopita, M. A., & O’Dea, C. P. O. 1997, ApJ, 485, 112
- Burlon et al. (2011) Burlon, D., Ajello, M., Greiner, J., et al. 2011, ApJ, 728, 58
- Callingham et al. (2015) Callingham, J. R., Gaensler, B. M., Ekers, R. D., et al. 2015, ApJ, 809, 168
- Carilli et al. (1988) Carilli, C. L., Perley, R. A., & Dreher, J. H. 1988, ApJ, 334, L73
- Carvalho (1994) Carvalho, J. C. 1994, A&A, 292, 392
- Cash (1979) Cash, W. 1979, ApJ, 228, 939
- Comastri (2004) Comastri, A. 2004, Supermassive Black Holes in the Distant Universe, 308, 245
- Czerny et al. (2009) Czerny, B., Siemiginowska, A., Janiuk, A., Nikiel-Wroczyński, B., & Stawarz, Ł. 2009, ApJ, 698, 840
- Croton et al. (2006) Croton, D. J., Springel, V., White, S. D. M., et al. 2006, MNRAS, 365, 11
- De Young (1993) De Young, D. S. 1993, ApJ, 402, 95
- De Young (1997) De Young, D. S. 1997, ApJ, 490, L55
- Dicken et al. (2012) Dicken, D., Tadhunter, C., Axon, D., et al. 2012, ApJ, 745, 172
- Done et al. (2007) Done, C., Sobolewska, M. A., Gierliński, M., & Schurch, N. J. 2007, MNRAS, 374, L15
- Dutson et al. (2014) Dutson, K. L., Edge, A. C., Hinton, J. A., et al. 2014, MNRAS, 442, 2048
- Fanti et al. (1995) Fanti, C., Fanti, R., Dallacasa, D., et al. 1995, A&A, 302, 317
- Freeman et al. (2001) Freeman, P., Doe, S., & Siemiginowska, A. 2001, Proc. SPIE, 4477, 76
- Fruscione et al. (2006) Fruscione, A., et al. 2006, Proc. SPIE, 6270, 60
- Fukazawa et al. (2011) Fukazawa, Y., Hiragi, K., Mizuno, M., et al. 2011, ApJ, 727, 19
- García-Burillo et al. (2007) García-Burillo, S., Combes, F., Neri, R., et al. 2007, A&A, 468, L71
- George & Fabian (1991) George, I. M., & Fabian, A. C. 1991, MNRAS, 249, 352
- Geréb et al. (2014) Geréb, K., Morganti, R., & Oosterloo, T. A. 2014, A&A, 569, A35
- Geréb et al. (2015) Geréb, K., Maccagni, F. M., Morganti, R., & Oosterloo, T. A. 2015, A&A, 575, A44
- Giroletti & Polatidis (2009) Giroletti, M., & Polatidis, A. 2009, Astronomische Nachrichten, 330, 193
- Gopal-Krishna & Wiita (1991) Gopal-Krishna, & Wiita, P. J. 1991, ApJ, 373, 325
- Guainazzi et al. (2004) Guainazzi, M., Siemiginowska, A., Rodriguez-Pascual, P., & Stanghellini, C. 2004, A&A, 421, 461
- Guainazzi et al. (2006) Guainazzi, M., Siemiginowska, A., Stanghellini, C., et al. 2006, A&A, 446, 87
- Gugliucci et al. (2005) Gugliucci, N. E., Taylor, G. B., Peck, A. B., & Giroletti, M. 2005, ApJ, 622, 136
- Guillard et al. (2012) Guillard, P., Ogle, P. M., Emonts, B. H. C., et al. 2012, ApJ, 747, 95
- Hardcastle et al. (2009) Hardcastle, M. J., Evans, D. A., & Croston, J. H. 2009, MNRAS, 396, 1929
- Hardcastle et al. (2012) Hardcastle, M. J., Massaro, F., Harris, D. E., et al. 2012, MNRAS, 424, 1774
- Heinz et al. (1998) Heinz, S., Reynolds, C. S., & Begelman, M. C. 1998, ApJ, 501, 126
- Holt et al. (2003) Holt, J., Tadhunter, C., & Morganti, R. 2003, New Astronomy Reviews, 47, 261
- Holt et al. (2008) Holt, J., Tadhunter, C. N., & Morganti, R. 2008, MNRAS, 387, 639
- Iwasawa et al. (2012) Iwasawa, K., Mainieri, V., Brusa, M., et al. 2012, A&A, 537, A86
- Jia et al. (2013) Jia, J., Ptak, A., Heckman, T., & Zakamska, N. L. 2013, ApJ, 777, 27
- Jiang et al. (1996) Jiang, D. R., Dallacasa, D., Schilizzi, R. T., et al. 1996, A&A, 312, 380
- Kashyap et al. (2010) Kashyap, V. L., van Dyk, D. A., Connors, A., et al. 2010, ApJ, 719, 900
- Kataoka et al. (2010) Kataoka, J., Stawarz, Ł., Cheung, C. C., et al. 2010, ApJ, 715, 554
- Kelly et al. (2008) Kelly, B. C., Bechtold, J., Trump, J. R., Vestergaard, M., & Siemiginowska, A. 2008, ApJS, 176, 355
- King (1962) King, I. 1962, AJ, 67, 471
- Krolik & Kallman (1987) Krolik, J. H., & Kallman, T. R. 1987, ApJ, 320, L5
- Kunert-Bajraszewska et al. (2010) Kunert-Bajraszewska, M., Gawroński, M. P., Labiano, A., & Siemiginowska, A. 2010, MNRAS, 408, 2261
- Kunert-Bajraszewska et al. (2014) Kunert-Bajraszewska, M., Labiano, A., Siemiginowska, A., & Guainazzi, M. 2014, MNRAS, 437, 3063
- Kunert-Bajraszewska et al. (2015) Kunert-Bajraszewska, M., Labiano, A., Siemiginowska, A., Guainazzi, M., & Gawroński, M. 2015, IAU Symposium, 313, 242
- Kuraszkiewicz et al. (2009) Kuraszkiewicz, J., Wilkes, B. J., Schmidt, G., et al. 2009, ApJ, 692, 1143
- Kraft et al. (2000) Kraft, R. P., Forman, W., Jones, C., et al. 2000, ApJ, 531, L9
- Labiano et al. (2008) Labiano, A., O’Dea, C. P., Barthel, P. D., de Vries, W. H., & Baum, S. A. 2008, A&A, 477, 491
- Luo et al. (2007) Luo, W.-F., Yang, J., Cui, L., Liu, X., & Shen, Z.-Q. 2007, ChJAA, 7, 611
- Matt et al. (1993) Matt, G., Fabian, A. C., & Ross, R. R. 1993, MNRAS, 262, 179
- Matt et al. (2003) Matt, G., Guainazzi, M., & Maiolino, R. 2003, MNRAS, 342, 422
- Müller et al. (2014) Müller, C., Kadler, M., Ojha, R., et al. 2014, A&A, 562, A4
- Migliori et al. (2011) Migliori, G., Grandi, P., Torresi, E., et al. 2011, A&A, 533, A72
- Migliori et al. (2012) Migliori, G., Siemiginowska, A., & Celotti, A. 2012, ApJ, 749, 107
- Migliori et al. (2014) Migliori, G., Siemiginowska, A., Kelly, B. C., et al. 2014, ApJ, 780, 165
- Mingo et al. (2011) Mingo, B., Hardcastle, M. J., Croston, J. H., et al. 2011, ApJ, 731, 21
- Morganti et al. (2013) Morganti, R., Fogasy, J., Paragi, Z., Oosterloo, T., & Orienti, M. 2013, Science, 341, 1082
- Morganti (2008) Morganti, R. 2008, Extragalactic Jets: Theory and Observation from Radio to Gamma Ray, 386, 210
- Morganti et al. (2003) Morganti, R., Tadhunter, C. N., Oosterloo, T. A., et al. 2003, PASA, 20, 129
- Müller et al. (2015) Müller, C., Krauß, F., Dauser, T., et al. 2015, A&A, 574, A117
- Nagai et al. (2006) Nagai, H., Inoue, M., Asada, K., Kameno, S., & Doi, A. 2006, ApJ, 648, 148
- Nandra et al. (2007) Nandra, K., O’Neill, P. M., George, I. M., & Reeves, J. N. 2007, MNRAS, 382, 194
- Nelder & Mead (1965) Nelder, J. A. & Mead, R. 1965, Computer Journal, vol7, pp.308-313
- O’Dea & Baum (1997) O’Dea, C. P., & Baum, S. A. 1997, AJ, 113, 148
- O’Dea (1998) O’Dea, C. P. 1998, PASP, 110, 493
- O’Dea et al. (2000) O’Dea, C. P., De Vries, W. H., Worrall, D. M., Baum, S. A., & Koekemoer, A. 2000, AJ, 119, 478
- Ostorero et al. (2010) Ostorero, L., Moderski, R., Stawarz, Ł., et al. 2010, ApJ, 715, 1071
- Ostorero et al. (2016) Ostorero, L., Morganti, R., Diaferio, A., et al. 2016, Astronomische Nachrichten, 337, 148
- Owsianik & Conway (1998) Owsianik, I., & Conway, J. E. 1998, A&A, 337, 69
- Patrick et al. (2012) Patrick, A. R., Reeves, J. N., Porquet, D., et al. 2012, MNRAS, 426, 2522
- Perucho (2015) Perucho, M. 2015, arXiv:1507.03355
- Polatidis & Conway (2003) Polatidis, A. G., & Conway, J. E. 2003, PASA, 20, 69
- Porquet et al. (2004) Porquet, D., Reeves, J. N., O’Brien, P., & Brinkmann, W. 2004, A&A, 422, 85
- Protassov et al. (2002) Protassov, R., van Dyk, D. A., Connors, A., Kashyap, V. L., & Siemiginowska, A. 2002, ApJ, 571, 545
- Readhead et al. (1996a) Readhead, A. C. S., Taylor, G. B., Pearson, T. J., & Wilkinson, P. N. 1996, ApJ, 460, 634
- Readhead et al. (1996b) Readhead, A. C. S., Taylor, G. B., Xu, W., et al. 1996b, ApJ, 460, 612
- Refsdal et al. (2009) Refsdal, B. et al. 2009, in Proceedings of the 8th Python in Science conference (SciPy 2009), G Varoquaux, S van der Walt, J Millman (Eds.), pp. 51-57 http://conference.scipy.org/proceedings/SciPy2009/paper_8
- Reynolds & Begelman (1997) Reynolds, C. S., & Begelman, M. C. 1997, ApJ, 487, L135
- Reynolds et al. (2001) Reynolds, C. S., Heinz, S., & Begelman, M. C. 2001, ApJ, 549, L179
- Reeves & Turner (2000) Reeves, J. N., & Turner, M. J. L. 2000, MNRAS, 316, 234
- Risaliti et al. (2003) Risaliti, G., Woltjer, L., & Salvati, M. 2003, A&A, 401, 895
- Risaliti et al. (2005) Risaliti, G., Elvis, M., Fabbiano, G., Baldi, A., & Zezas, A. 2005, ApJ, 623, L93
- Risaliti et al. (2010) Risaliti, G., Elvis, M., Bianchi, S., & Matt, G. 2010, MNRAS, 406, L20
- Risaliti et al. (2011) Risaliti, G., Nardini, E., Salvati, M., et al. 2011, MNRAS, 410, 1027
- Różańska et al. (2002) Różańska, A., Dumont, A.-M., Czerny, B., & Collin, S. 2002, MNRAS, 332, 799
- Scheuer (1974) Scheuer, P. A. G. 1974, MNRAS, 166, 513
- Scheuer (1982) Scheuer, P. A. G. 1982, Extragalactic Radio Sources, 97, 163
- Shulevski et al. (2012) Shulevski, A., Morganti, R., Oosterloo, T., & Struve, C. 2012, A&A, 545, A91
- Siemiginowska et al. (2008) Siemiginowska, A., LaMassa, S., Aldcroft, T. L., Bechtold, J., & Elvis, M. 2008, ApJ, 684, 811
- Siemiginowska (2009) Siemiginowska, A. 2009, Astronomische Nachrichten, 330, 264
- Siemiginowska et al. (2012) Siemiginowska, A., Stawarz, Ł., Cheung, C. C., et al. 2012, ApJ, 750, 124
- Silk & Rees (1998) Silk, J., & Rees, M. J. 1998, A&A, 331, L1
- Smith et al. (2001) Smith, R. K., Brickhouse, N. S., Liedahl, D. A., & Raymond, J. C. 2001, ApJ, 556, L91
- Sobolewska et al. (2009) Sobolewska, M. A., Gierliński, M., & Siemiginowska, A. 2009, MNRAS, 394, 1640
- Sobolewska et al. (2011) Sobolewska, M. A., Siemiginowska, A., & Gierliński, M. 2011, MNRAS, 413, 2259
- Stawarz et al. (2008) Stawarz, Ł., Ostorero, L., Begelman, M. C., et al. 2008, ApJ, 680, 911
- Tadhunter et al. (2011) Tadhunter, C., Holt, J., González Delgado, R., et al. 2011, MNRAS, 412, 960
- Tadhunter et al. (2014) Tadhunter, C., Morganti, R., Rose, M., Oonk, J. B. R., & Oosterloo, T. 2014, Nature, 511, 440
- Taylor et al. (2000) Taylor, G. B., Marr, J. M., Pearson, T. J., & Readhead, A. C. S. 2000, ApJ, 541, 112
- Tengstrand et al. (2009) Tengstrand, O., Guainazzi, M., Siemiginowska, A., et al. 2009, A&A, 501, 89
- Tingay et al. (2015) Tingay, S. J., Macquart, J.-P., Collier, J. D., et al. 2015, AJ, 149, 74
- Tsujimoto et al. (2011) Tsujimoto, M., Guainazzi, M., Plucinsky, P. P., et al. 2011, A&A, 525, A25
- van Breugel et al. (1984) van Breugel, W., Miley, G., & Heckman, T. 1984, AJ, 89, 5
- Vink et al. (2006) Vink, J., Snellen, I., Mack, K.-H., & Schilizzi, R. 2006, MNRAS, 367, 928
- Wagner & Bicknell (2011) Wagner, A. Y., & Bicknell, G. V. 2011, ApJ, 728, 29
- Watson et al. (2009) Watson, M. G., Schröder, A. C., Fyfe, D., et al. 2009, A&A, 493, 339
- Willett et al. (2010) Willett, K. W., Stocke, J. T., Darling, J., & Perlman, E. S. 2010, ApJ, 713, 1393
- Winter et al. (2009) Winter, L. M., Mushotzky, R. F., Reynolds, C. S., & Tueller, J. 2009, ApJ, 690, 1322
- Young et al. (2009) Young, M., Elvis, M., & Risaliti, G. 2009, ApJS, 183, 17
- Zhou et al. (2011) Zhou, X. L., Zhao, Y. H., & Soria, R. 2011, MNRAS, 413, L61
- Zycki & Czerny (1994) Zycki, P. T., & Czerny, B. 1994, MNRAS, 266, 653