An OH(1720 MHz) Maser and a Nonthermal Radio Source in
Sgr B2(M): A SNR–Molecular Cloud Interaction Site?
Abstract
Sgr B2 is a well-known star forming molecular cloud complex in the Galactic center region showing evidence of high energy activity as traced by the K neutral FeI line at 6.4 keV, as well as GeV and TeV -ray emission. Here we present VLA and GMRT observations with respective resolutions of and 25 and report the detection of an OH(1720 MHz) maser, with no accompanying OH 1665, 1667 and 1612 MHz maser emission. The maser coincides with a 150 MHz nonthermal radio source in Sgr B2(M). This rare class of OH(1720 MHz) masers or the so-called supernova remnant (SNR) masers, with no main line transitions, trace shocked gas and signal the interaction of an expanding SNR with a molecular cloud. We interpret the 150 MHz radio source as either the site of a SNR – molecular gas interaction or a wind-wind collision in a massive binary system. The interaction of the molecular cloud and the nonthermal source enhances the cosmic-ray ionization rate, allows the diffusion of cosmic rays into the cloud and produces the variable 6.4 keV line, GeV and TeV -ray emission from Sgr B2(M). The cosmic ray electron interaction with the gas in the Galactic center can not only explain the measured high values of cosmic ray ionization and heating rates but also contribute to nonthermal bremsstrahlung continuum emission, all of which are consistent with observations.
1 Introduction
Interaction between a supernova remnant and a molecular cloud is traced by bright spots of 1720 MHz OH maser emission (Frail, Goss & Slysh 1994; Wardle & Yusef-Zadeh 2002). About 24 known supernova remnants are associated with this rare class of masers (Frail et al. 1996; Green et al. 1997; Yusef-Zadeh et al. 1996, 2003a,b; Green et al. 1997; Koralesky et al. 1998; Hewitt & Yusef-Zadeh 2009; Brogan et al. 2013). These OH(1720 MHz) masers are collisionally pumped in molecular gas at temperatures and density range 50-200 K and cm-3, respectively (Lockett, Gauthier & Elitzur 1999). The enhanced column of OH at the interaction site requires X-rays or cosmic rays from the SNR to irradiate the water-rich gas behind a C-type shock wave (Wardle, Yusef-Zadeh & Geballe 1999; Wardle 1999). SNRs interacting with molecular clouds have also shown a correlation between -ray and X-ray emission as well as SNR masers (Yusef-Zadeh et al. 2003a; Hewitt, Yusef-Zadeh and Wardle 2009), thus consistent with an enhanced cosmic ray flux or X-rays.
One site that might be suitable to study molecular shocks and high energy emission in the Galaxy is Sgr B2, a spectacular star forming region in the Galactic center. Sgr B2 is associated with a massive molecular cloud and contains 41 UC HII regions; (e.g., Lis & Goldsmith 1989; De Pree et al. 2014). Recent monitoring of UC HII regions indicate significant radio continuum flux variation over the last 20 years (De Pree et al. 2014). Sgr B2 is also a prominent site of high energy activity, being a a source of hard X-rays, GeV and TeV -rays. It also displays variable fluorescent emission in the neutral iron K line at 6.4 keV (Revnivtstev et al. 2004; Terrier et al. 2010) either due to irradiation by a burst of X-rays from Sgr A* (e.g., Zhang et al. 2015) or a variable low energy cosmic-ray electron flux (Yusef-Zadeh et al. 2007a). In fact, a radio source was identified toward Sgr B2 at 255 and 327 MHz, suggesting that it is a nonthermal source embedded in the cloud and that the origin of the FeI K line emission is tied to a high cosmic ray ionization rate in the cloud (Yusef-Zadeh et al. 2007b).
To search for sites of interaction between SNRs and molecular gas, we carried out a sensitivity–limited OH survey of the region between Sgr C (G0.5-0.0) and Sgr B2 (G0.67–0.05) of the Galactic center. We find only two clouds from which OH(1720 MHz) masers are detected. One is associated with the Sgr A East SNR (G0.0+0.0) interacting with the 50 km s-1 molecular cloud (e.g., Wardle, Yusef-Zadeh & Geballe 1999; Yusef-Zadeh et al. 1996; Sjouwerman & Philström 2008). The other is the detection of an OH(1720 MHz) maser coincident with Sgr B2(M) with no accompanying 1665/67 MHz emission. Here we focus on the relationship between the OH(1720 MHz) maser and a 150 MHz nonthermal source found in Sgr B2(M).
2 Observation and Data Reduction: VLA & GMRT
A survey of the Galactic center was carried out with the Jansky Very Large Array (VLA) searching for all four ground state transitions of OH (1612, 1665, 1667 and 1720 MHz). Details of these observations, which covered the inner () using 11 pointings along the inner Galactic plane, will be given elsewhere (Cotton & Yusef-Zadeh 2016, in preparation). Briefly, the L-band observations were centered on the rest frequency of the OH satellite (1.612231, 1.72053 GHz) and main (1.66540184, 1.667359 GHz) lines and were made on May 31, 2014 using the VLA in “A” configuration. The velocity range covered was to +235 km s-1 with a spectral and spatial resolution of 0.73 km s-1 and 1.2”, respectively. Each pointing was observed for 2 minutes in three scans separated by about 45 minutes. Calibration followed the procedure given in Cotton & Yusef-Zadeh (2016).
The 1.7 GHz data were imaged using faceting to cover the primary beam. Continuum imaging was done after phase self-calibration on each pointing using all four subbands out to a radius of 30′ and was CLEANed. In the quieter fields, the off source RMS in the continuum images was 1 mJy beam-1 although with much variation and many artifacts from the strong, almost completely resolved emission. Spectral line channels were imaged to a radius of 13.6′. Typical RMSes in line free channels are 50 mJy beam-1.
Archival data from a 150 MHz GMRT sky survey (TGSS) were obtained from the GMRT archive, and processed with a fully automated pipeline (Intema et al. 2009, 2014), which includes direction-dependent calibration, modeling and imaging of ionospheric phase delay. A full survey of the radio sky at 150 MHz as visible from the GMRT (Swarup et al. 1991) was performed between 2010 and early 2012, covering the full declination range of to degrees. The survey consists of more than 5000 pointings on an approximate hexagonal grid. Data were recorded in half polarization (RR,LL) every 2 seconds, in 256 frequency channels across 16 MHz of bandwidth (140–156 MHz). Each pointing was observed for about 15 minutes, split over 3 or more scans spaced out in time to improve UV-coverage.
3 Results
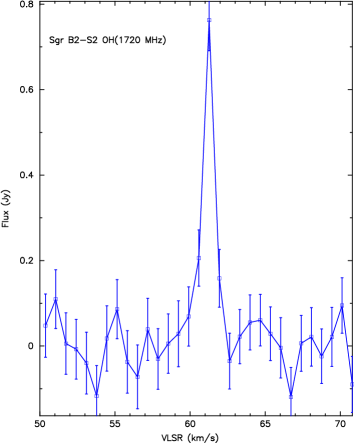
Apart from the known OH(1720 MHz) masers associated with the Sgr A East SNR (Yusef-Zadeh et al. 1996; Sjouwerman & Philström 2008), the surveyed region uncovers only one additional OH(1720 MHz) source, G0.6647-0.0358, in Sgr B2(M). Figure 1 shows the spectrum of OH(1720 MHz) emission toward this source in Sgr B2. A list of fitted parameters of OH(1720 MHz) emission is given in Table 1. Entries in columns 1 to 9 give the source name, RA, Dec coordinates, Galactic l, b coordinates, peak flux density, radial velocity, the linewidth and the lower limit to the brightness temperature value, respectively. The velocity of the OH(1720 MHz) maser is km s-1 corresponding to the systematic velocity of the cloud. G0.6647-0.0358 is a maser because of its narrow linewidths km s-1 and a lower limit to the brightness temperature T K assuming a source size of . We also searched for OH emission at 1665, 1667 and 1720 MHz from the position of G0.6647-0.0358 and found a 1 RMS noise of , 100 and 35 mJy beam-1 at 1665, 1667 and 1612 MHz, respectively (Cotton and Yusef-Zadeh 2016).
A number of past studies have detected strong OH maser emission from G0.6647-0.0358 in Sgr B2(M) (e.g., Caswell & Haynes 1983; Gaume & Mutel 1987; Argon, Reid & Menten 2000 (ARM)). A sensitive OH survey of the sky with the VLA with a spectral resolution of 0.14 km s-1, spatial resolution of 2.6 and RMS sensitivity of 90 mJy channel-1 detected two OH (1720 MHz) masers within 1 positional error of G0.6647-0.0358 (ARM). Both masers, which are detected in two studies, are highly polarized and have flux densities ranging between 1.6 and 14 Jy with linewidths between 0.38 and 0.46 km s-1 (ARM; Gaume & Mutel 1987) Given our poorer sensitivity and spectral resolution, it is most likely that the two masers are spectrally not resolved in our low-resolution data and/or are variable. ARM found no 1612/1665/1667 MHz counterparts to the OH(1720 MHz) masers in Sgr B2(M) whereas Gaume & Mutel (1987) find a OH(1665 MHz) LCP counterpart with a flux density of 0.4 Jy. The OH(1720 MHz) maser G0.6647-0.0358 is displaced from star forming OH masers in Sgr B2(M) by about and is likely to be a member of a rare class of OH masers related to SNR masers. However, there is a compact HII region Sgr B2 D that is identified at 1.3cm within 0.5′′ of the OH(1720 MHz) maser (De Pree et al. 1996), thus we can not rule out the possibility that the OH(1720 MHz) masers are associated with Sgr B2 D.
| Name | RA (J2000) | Dec (J2000) | G. long | G. lat | Flux Density | Vel | Width | Tb |
|---|---|---|---|---|---|---|---|---|
| mJy | km s-1 | km s-1 | ∘K | |||||
| G0.6647-0.0358 | 20 | 0.6647 | –0.0358 | 749 | 61.3 | 0.7 | 4.8E04 |
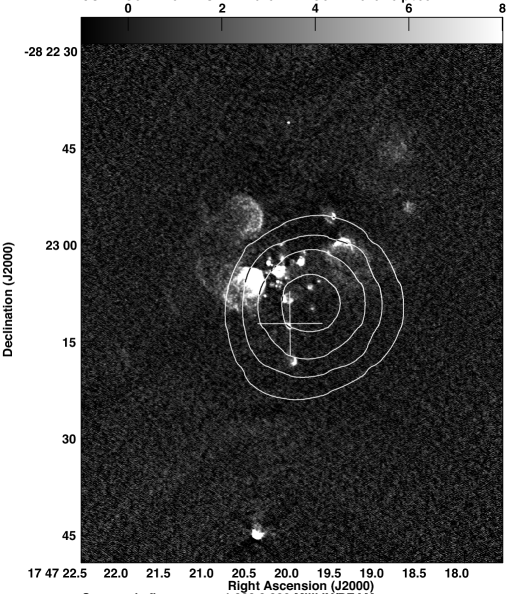
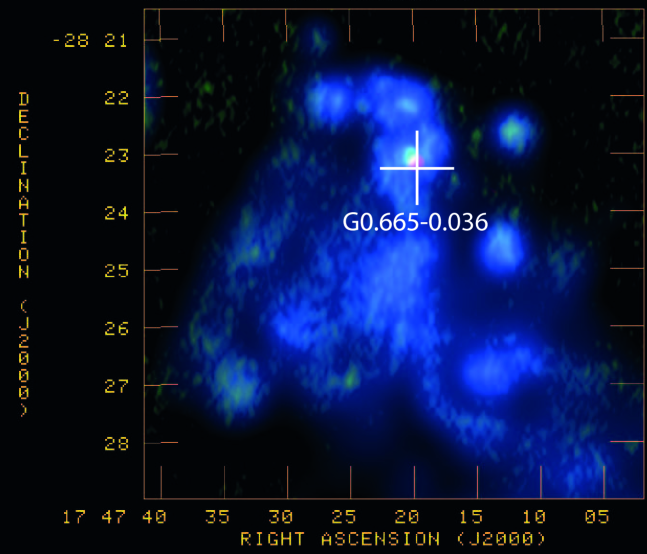
Figure 2a shows contours of 150 MHz emission with a resolution of 25 superimposed on a grayscale image at 23 GHz with a resolution of (PA) (De Pree et al. 2005). The 150 MHz source also coincides with a 255 and 327 MHz source within resolutions of and , respectively (Yusef-Zadeh, Wardle & Roy 2007). Figure 2b shows contours of 327 MHz from Sgr B2(M) based on VLA observations (Nord et al. 2004). The cross drawn on these figures coincides with the position of the OH(1720 MHz) maser G0.6647-0.0358 at the velocity of 62 km s-1. The concentration of compact and UC HII regions traced at 23 GHz lie to the NE of the 327 and 150 MHz peak emission. This is because the emission from these HII regions become opaque at low frequencies. The offset between 327 and 150 MHz peak emission, noted by comparing contours of emission in Figure 2a and 2b, is explained by the contribution of thermal emission to the nonthermal source at 327 MHz. The color image in Figure 3a shows the composite image at 150 MHz, 327 MHz and 1.4 GHz. The extended feature (blue) traces the emission from HII regions at high frequency. A close-up of the region where low frequency emission dominates, is shown in Figure 3b. The emission at 255 and 327 MHz shows weak extended emission from thermal HII regions whereas there is no evidence of weak HII emission at 150 MHz.
We estimate the contribution of HII regions to the flux density at six different frequencies within a 25′′ beam at the position of the remnant, with emitted flux densities from the remnant, and , from compact and UC HII regions within the beam, respectively. Here is the optical depth of the extended ionized screen lying in front of the Galactic center, which has (Roy 2013). The remnant is assumed to have a non-thermal spectrum . Additional support for nonthermal emission from Sgr B2 comes from GBT observations (Hollis et al. 2007; Crocker et al. 2007 but see Lang, Palmer & Goss 2008). The flux densities from the HII regions are written where is the beam filling factor, is the beam solid angle, is the Planck function, and is the optical depth and is the turnover frequency.
A formal fitting of this model to the data has not been made because there is correlation amongst the parameters. Instead, we show an example in Figure 4, obtained by setting , , and adjusting the remaining parameters to obtain a reasonable match to the observed spectrum, finding Jy, , GHz, , and GHz. Note that the 1.4 and 4.8 GHz flux densities constrain the flux density and turnover frequency of the compact HII region component but the parameters for the UC HII region component are less constrained, as the beam filling factor and turnover frequency can be traded off to yield the observed 23 GHz flux density.
The spectral index of the SNR is poorly constrained because of the uncertain magnitude of the absorption by the foreground screen. For example, a similar fit to the low-frequency data can be obtained adopting a flat SNR spectrum () and setting . Nevertheless, in this case Jy and we conclude that the remnant’s intrinsic flux density is Jy at 150 MHz even though its spectral index is poorly constrained.
4 Discussion
The most interesting result of our observations is the evidence for OH(1720 MHz) masers coincident with a low frequency nonthermal radio source in Sgr B2(M). The detection of a 150 MHz source and an OH(1720 MHz) maser at the radial velocity of Sgr B2 provide compelling evidence for shocked molecular gas resulting from the interaction of a nonthermal radio source and the Sgr B2(M) molecular cloud. This rare class of OH masers is different than star forming OH masers where all four transitions of OH are observed as masers and the 1665/67 OH masers are strongest. A number of star formation OH masers are detected in the Sgr B2(M) but there is no OH(1720 MHz) detected within 3′′ of G0.6647-0.0358 (see Fig. 4 of ARM). The characteristics of the OH(1720 MHz) maser in Sgr B2 are similar to those observed in the Galaxy where SNRs expand into a molecular cloud, interact with the gas, increase the cosmic ray ionization rate at the site of the interaction. The nonthermal source with an OH(1702 MHz) counterpart is likely to be the site of an interaction of an expanding remnant with the Sgr B2 cloud. It is possible that remnant is extended beyond G0.6647-0.0358 with low surface brightness, thus is not detectable with present 150 MHz sensitivity.
Given the large number of UC HII region excited by young O stars in Sgr B2, the progenitor to the nonthermal source is likely to be an O star that exploded as a supernova, and we are witnessing a shock from an expanding SNR driving into the parent molecular cloud. Another possibility is that the nonthermal emission is produced in a massive binary system (e.g. Chapman et al. 1999; Eichler & Usov 1993), though to date all the known OH(1720 MHz) masers are found in interacting SNRs.
4.1 High Energy Emission from Sgr B2(M)
The evidence for a compact SNR interacting with the molecular gas has a number of important implications. First, population inversion and significant amplification in the 1720 MHz line requires densities cm-3, temperatures in the range 30–125 K, an OH column density in the range – and an absence of a strong FIR continuum (Lockett, Gauthier & Elitzur 1999). In this picture, the interacting region must be self-shielded against FIR radiation; the UV radiation from young massive stars is absorbed by dust grains and reradiated in the FIR. Second, the synchrotron source injects relativistic particles into the molecular cloud at the interaction site. In particular, low energy cosmic rays must contribute to the ionization and heating of molecular gas potentially producing the FeI 6.4 keV line and hard X-ray emission, whereas high energy cosmic ray particles interact with the dense gas, yielding -ray emission.
We use the observed 150 MHz flux density to estimate the likely magnitude of these effects. Unfortunately the spectral index is poorly determined, so we consider E-2 or E-3 relativistic electron spectra, which would yield or synchrotron spectra, respectively. We assume that the electron spectrum extends between 1 MeV and 1 GeV, that the proton to electron ratio is 100 and adopt a spherical source with radius 1 pc. Then we find an equipartition magnetic field of 0.26 or 0.6 mG for E-2 or E-3, respectively. This implies an energy density of relativistic electrons 17 or 88 eV cm-3. The total energy in relativistic electrons is or erg. This implies that cosmic ray electrons ionization rate is or s-1 (see equation 3 of Yusef-Zadeh et al. 2013). This estimate is consistent with a number of recent measurements indicating a vast amount of diffuse H, OH+, H2O+ and H3O+ distributed in Sgr B2 and the Galactic center, implying a cosmic ray ionization rate in the Galactic center region is one to two orders of magnitude higher than in the Galactic disk (Oka et al. 2005; Geballe & Oka 2010; van der Tak et al. 2006; Indriolo et al. 2015; Le Petit et al. 2016).
The Sgr B2 cloud is the most massive cloud of the Galactic center region with hydrogen column density N toward Sgr B2(M) (Lis & Goldsmith 1989; Etxaluze et al. 2013). The interaction of relativistic electrons and their secondaries with the molecular gas also produces Fe K line emission and a nonthermal bremsstrahlung continuum extending from X-rays to -rays. To estimate the K line emission, we note that each ionization is associated with the loss of 40eV of energy by relativistic electrons and that the efficiency of K photon production is 200 photons for each erg of energy lost (Yusef-Zadeh et al 2013). Using the values of the cosmic ray ionization rate and the column density, the intensity of K line emission at 6.4 keV is estimated or photons s-1 cm-2 arcmin-2, assuming a metalicity of 3 (see equation 6 of Yusef-Zadeh et al. 2013).
The interaction of cosmic ray electrons with the gas in the Galactic center can not only explain the measured high values of cosmic ray ionization and heating rates but also contribute to nonthermal bremsstrahlung continuum emission. Assuming the number density of hydrogen nuclei in atomic or molecular form, nH = n(HI) + 2n(H2) cm-3, the expected -ray flux at 1 GeV and 1 TeV are and , respectively, for or and , for , respectively.
Sgr B2(M) is representative of a population of molecular clouds in the Galactic center that display steady and variable components of K line emission as well as GeV and TeV -rays. Sunyaev et al. (1993) suggested that the K and nonthermal continuum emission from Galactic center molecular clouds is a result of an echo from an X-ray flare from Sgr A*. The variability analysis of some clouds showed superluminal motion and supported the photo-ionization model of K emission (Koyama et al. 1996; Terrier et al. 2010). The high column density of 1025 cm-2 in Sgr B2(M) requires a special geometry in order to explain the X-ray echo model in Sgr B2(M). The presence of a nonthermal radio source interacting with dense molecular gas in Sgr B2(M), suggests that a nonthermal radio source interacting with molecular gas can also produce the 6.4 keV line emission with the assumption that the metalicity in Sgr B2(M) is three times higher than the solar value. Thus, it is not clear which mechanism dominates the K line emission from Galactic center clouds. There are, however, independent measurements favoring the cosmic ray picture, as described below.
One is the critical role that low energy cosmic ray electrons play in explaining the enhanced H absorption implying high cosmic ray ionization rate (Oka et al. 2005). Second, the high energy -ray emission provides a strong constraint on the interaction of high energy cosmic ray particles with Galactic center molecular clouds. The Galactic center is now recognized to have excess -ray emission at energies between 20 MeV to TeV implying a high cosmic ray density (Aharonian et al. 2006; Abdo et al. 2009). Third, cosmic rays can naturally heat the gas and explain the elevated gas temperature relative to the dust temperature in Galactic center molecular clouds (Yusef-Zadeh et al. 2007). Fourth, there is strong diffuse nonthermal radio emission from the Galactic center as well as a large number of magnetized radio filaments (Nord et al. 2004; Yusef-Zadeh et al. 2007a). In particular, 74 MHz radio emission shows a spatial correlation with Galactic center molecular clouds suggesting that cosmic ray electrons are diffusing through the molecular gas (Yusef-Zadeh et al. 2013). Fifth, the enhanced abundance of SiO and methanol as well as the unusual abundance ratios found throughout Galactic center molecular clouds suggests that cosmic rays drive the chemistry of the gas (Yusef-Zadeh et al. 2013). Lastly, the variable radio emission observed on a 20-year time scale in Sgr B2(M) (De Pree et al. 2014) may be due to the variable nonthermal radio source which is embedded within Sgr B2(M). Future monitoring of low frequency radio and high energy emission will determine the contribution of cosmic rays in explaining the observed features in this complex region of the Galaxy.
In summary, the detection of OH(1720 MHz) maser emission adjacent to a nonthermal source suggests that a source of particle acceleration, most likely a SNR is physically interacting with the dense gas in Sgr B2(M). These measurements have important implications for the nature of 6.4 keV and -ray emission in the Galactic center, supporting a scenario in which cosmic rays are responsible for the production of high energy radiation in Sgr B2(M).
Acknowledgments: This work is partially supported by the grant AST-1517246 from the NSF. The National Radio Astronomy Observatory is a facility of the National Science Foundation operated under cooperative agreement by Associated Universities, Inc. We thank the staff of the GMRT that made these observations possible. GMRT is run by the National Center for Radio Astrophysics of the Tata Institute of Fundamental Research.
References
- Abdo et al. (2009) Abdo, A. A., Ackermann, M., Ajello, M., et al. 2009, ApJS, 183, 46
- Aharonian et al. (2006) Aharonian, F., Akhperjanian, A. G., Bazer-Bachi, A. R., et al. 2006, Nature, 439, 695
- Argon et al. (2000) Argon, A. L., Reid, M. J., & Menten, K. M. 2000, ApJS, 129, 159
- Brogan et al. (2013) Brogan, C. L., Goss, W. M., Hunter, T. R., et al. 2013, ApJ, 771, 91
- Caswell & Haynes (1983) Caswell, J. L., & Haynes, R. F. 1983, Australian Journal of Physics, 36, 361
- Chapman et al. (1999) Chapman, J. M., Leitherer, C., Koribalski, B., Bouter, R., & Storey, M. 1999, ApJ, 518, 890
- Crocker et al. (2007) Crocker, R. M., Jones, D., Protheroe, R. J., et al. 2007, ApJ, 666, 934
- De Pree et al. (2014) De Pree, C. G., Peters, T., Mac Low, M.-M., et al. 2014, ApJ, 781, L36
- De Pree et al. (2005) De Pree, C. G., Wilner, D. J., Deblasio, J., Mercer, A. J., & Davis, L. E. 2005, ApJ, 624, L101
- de Pree et al. (1996) De Pree, C. G., Gaume, R. A., Goss, W. M., & Claussen, M. J. 1996, ApJ, 464, 788
- Etxaluze et al. (2013) Etxaluze, M., Goicoechea, J. R., Cernicharo, J., et al. 2013, A&A, 556, A137
- Eichler & Usov (1993) Eichler, D., & Usov, V. 1993, ApJ, 402, 271
- Frail et al. (1996) Frail, D. A., Goss, W. M., Reynoso, E. M., et al. 1996, AJ, 111, 1651
- Frail et al. (1994) Frail, D. A., Goss, W. M., & Slysh, V. I. 1994, ApJ, 424, L111
- Gaume & Mutel (1987) Gaume, R. A., & Mutel, R. L. 1987, ApJS, 65, 193
- Geballe & Oka (2010) Geballe, T. R., & Oka, T. 2010, ApJ, 709, L70
- Green et al. (1997) Green, A. J., Frail, D. A., Goss, W. M., & Otrupcek, R. 1997, AJ, 114, 2058
- Hewitt et al. (2009) Hewitt, J. W., Yusef-Zadeh, F., & Wardle, M. 2009, ApJ, 706, L270
- Hewitt & Yusef-Zadeh (2009) Hewitt, J. W., & Yusef-Zadeh, F. 2009, ApJ, 694, L16
- Hollis et al. (2007) Hollis, J. M., Jewell, P. R., Remijan, A. J., & Lovas, F. J. 2007, ApJ, 660, L125
- Indriolo et al. (2015) Indriolo, N., Neufeld, D. A., Gerin, M., et al. 2015, ApJ, 800, 40
- Intema (2014) Intema, H. T. 2014, arXiv:1402.4889
- Intema et al. (2009) Intema, H. T., van der Tol, S., Cotton, W. D., et al. 2009, A&A, 501, 1185
- Koralesky et al. (1998) Koralesky, B., Frail, D. A., Goss, W. M., Claussen, M. J., & Green, A. J. 1998, AJ, 116, 1323
- Koyama et al. (1996) Koyama, K., Maeda, Y., Sonobe, T., et al. 1996, PASJ, 48, 249
- Lang et al. (2008) Lang, C. C., Palmer, P., & Goss, W. M. 2008, arXiv:0801.2168
- Le Petit et al. (2016) Le Petit, F., Ruaud, M., Bron, E., et al. 2016, A&A, 585, A105
- Lis & Goldsmith (1989) Lis, D. C., & Goldsmith, P. F. 1989, ApJ, 337, 704
- Lockett et al. (1999) Lockett, P., Gauthier, E., & Elitzur, M. 1999, ApJ, 511, 235
- Nord et al. (2004) Nord, M. E., Lazio, T. J. W., Kassim, N. E., et al. 2004, AJ, 128, 1646
- Oka et al. (2005) Oka, T., Geballe, T. R., Goto, M., Usuda, T., & McCall, B. J. 2005, ApJ, 632, 882
- Revnivtsev et al. (2004) Revnivtsev, M. G., Churazov, E. M., Sazonov, S. Y., et al. 2004, A&A, 425, L49
- Roy (2013) Roy, S. 2013, ApJ, 773, 67
- Sjouwerman & Pihlström (2008) Sjouwerman, L. O., & Pihlström, Y. M. 2008, ApJ, 681, 1287
- Sunyaev et al. (1993) Sunyaev, R. A., Markevitch, M., & Pavlinsky, M. 1993, ApJ, 407, 606
- Swarup et al. (1991) Swarup, G., Ananthakrishnan, S., Kapahi, V. K., et al. 1991, Current Science, Vol. 60, NO.2/JAN25, P. 95, 1991, 60, 95
- Terrier et al. (2010) Terrier, R., Ponti, G., Bélanger, G., et al. 2010, ApJ, 719, 143
- van der Tak et al. (2006) van der Tak, F. F. S., Belloche, A., Schilke, P., et al. 2006, A&A, 454, L99
- Wardle (1999) Wardle, M. 1999, ApJ, 525, L101
- Wardle et al. (1999) Wardle, M., Yusef-Zadeh, F., & Geballe, T. R. 1999, The Central Parsecs of the Galaxy, 186, 432
- Wardle & Yusef-Zadeh (2002) Wardle, M., & Yusef-Zadeh, F. 2002, Science, 296, 2350
- Yusef-Zadeh et al. (2003) Yusef-Zadeh, F., Wardle, M., Rho, J., & Sakano, M. 2003a, ApJ, 585, 319
- Yusef-Zadeh et al. (2003) Yusef-Zadeh, F., Wardle, M., & Roberts, D. A. 2003b, ApJ, 583, 267
- Yusef-Zadeh et al. (2013) Yusef-Zadeh, F., Hewitt, J. W., Wardle, M., et al. 2013, ApJ, 762, 33
- Yusef-Zadeh et al. (1996) Yusef-Zadeh, F., Roberts, D. A., Goss, W. M., Frail, D. A., & Green, A. J. 1996, ApJ, 466, L25
- Yusef-Zadeh et al. (2007) Yusef-Zadeh, F., Muno, M., Wardle, M., & Lis, D. C. 2007a, ApJ, 656, 847
- Yusef-Zadeh et al. (2007) Yusef-Zadeh, F., Wardle, M., & Roy, S. 2007, ApJ, 665, L123
- Zhang et al. (2015) Zhang, S., Hailey, C. J., Mori, K., et al. 2015, ApJ, 815, 132
![[Uncaptioned image]](/html/1603.00883/assets/x3.png)
![[Uncaptioned image]](/html/1603.00883/assets/x5.png)
