Proto-cooperation: Group hunting sailfish improve hunting success by alternating attacks on grouping prey
James E. Herbert-Read1,2,‡,∗, Pawel Romanczuk3,4,5,‡,
Stefan Krause6,
Daniel Strömbom1,7, Pierre Couillaud8,
Paolo Domenici9, Ralf H.J. M. Kurvers3,10,
Stefano Marras9,
John F. Steffensen11,
Alexander D.M. Wilson12,13,
Jens Krause3,4
1 Department of Mathematics, Uppsala University, 75106, Uppsala, Sweden,
2 Department of Zoology, Stockholm University, 10691, Stockholm, Sweden,
3 Leibniz-Institute of Freshwater Ecology and Inland Fisheries, M ggelseedamm 310, Berlin, Germany
4 Faculty of Life Sciences, Humboldt-Universität zu Berlin, 10115 Berlin, Germany,
5 Department of Ecology and Evolutionary Biology, Princeton University, Princeton, 08544 New Jersey, USA,
6 Department of Electrical Engineering and Computer Science, Lübeck University of Applied Sciences, 23562 Lübeck, Germany,
7 Department of Biology, Lafayette College, Easton, 18042, Pennsylvania, USA,
8 Département de la Licence Sciences et Technologies, Université Pierre et Marie Curie, 75005 Paris, France,
9 IAMC-CNR, Istituto per l’Ambiente Marino Costiero, Consiglio Nazionale delle Ricerche, Località Sa Mardini, 09170 Torregrande, Oristano, Italy,
10 Center for Adaptive Rationality, Max Planck Institute for Human Development, 14195, Berlin, Germany,
11 Marine Biological Section, University of Copenhagen, Helsingor, 3000, Denmark,
12 School of Life and Environmental Sciences, University of Sydney, Sydney, NSW, Australia 2006
13 School of Life and Environmental Sciences, Deakin University, Waurn Ponds, Victoria, 3216, Australia,
These authors contributed equally to this study,
E-mail: Corresponding author james.herbert.read@gmail.com
Abstract
We present evidence of a novel form of group hunting. Individual sailfish (Istiophorus platypterus) alternate attacks with other group members on their schooling prey (Sardinella aurita). While only 24% of attacks result in prey capture, multiple prey are injured in 95% of attacks, resulting in an increase of injured fish in the school with the number of attacks. How quickly prey are captured is positively correlated with the level of injury of the school, suggesting that hunters can benefit from other conspecifics’ attacks on the prey. To explore this, we built a mathematical model capturing the dynamics of the hunt. We show that group hunting provides major efficiency gains (prey caught per unit time) for individuals in groups of up to 70 members. We also demonstrate that a free riding strategy, where some individuals wait until the prey are sufficiently injured before attacking, is only beneficial if the cost of attacking is high, and only then when waiting times are short. Our findings provide evidence that cooperative benefits can be realised through the facilitative effects of individuals’ hunting actions without spatial coordination of attacks. Such ‘proto-cooperation’ may be the pre-cursor to more complex group-hunting strategies.
Introduction
Group hunting is a fascinating example of social behaviour that can be observed in taxonomic groups including arthropods [1, 2, 3], fishes [4, 5, 6, 7, 8], birds [9, 10] and mammals [11, 12]. The level of coordination between individuals during hunts, both within and between these taxa, varies considerably. In its simplest form, group hunting involves hunters attacking prey together with little or no coordination of attacks while the most complex form, collaborative hunting, involves individuals adopting specific hunting roles to herd and catch their prey [13, 14, 15].
Explaining the origins and maintenance of group hunting, however, remains unresolved. Despite group hunting allowing some species to catch considerably larger prey [16, 13, 17] as well as increasing the likelihood of making a kill [16], individuals do not necessarily increase the amount of prey they consume when hunting together (compared to when hunting alone). For example, food intake per individual wolf (Canis lupus) can be lower in larger packs compared to smaller hunting groups or lone individuals [18], and lions (Panthera leo) do not always hunt in group sizes that optimise the amount of prey they consume [19]. Other reasons, therefore, may explain the existence of group hunting in some taxa. For example, individuals in groups may be better at limiting the access of kleptoparasites to the kill, may travel less distance, and may have a reduced likelihood of being injured during group hunts, compared to when hunting alone [16, 20, 21].
When hunters attack smaller grouping prey, the reasons for group hunting appear clearer. In some cases, group hunters use their superior speed and coordinated attacks to disrupt and fragment prey groups [22, 23, 4]. Groups of piscivorous fish, for example, have a higher probability of breaking up prey schools and capture more prey than single attackers [22]. Groups of humpback whales (Megaptera novaeangliae) employ bubble-nets to capture schooling fish [24, 25] and various dolphin species have been described to use cooperative hunting strategies [26, 17]. Raptors have similarly been observed to use spatially-coordinated attacks to hunt flocking passerines [9, 10]. Spatially coordinated attacks appear to break down the collective defences of grouping prey, thereby increasing consumption rates for group hunters. But how did these more complex coordinated attacks evolve from simpler forms of group hunting?
In their simplest form, apparent group hunts may simply be a byproduct of clumped prey distribution, when hunters join others by eavesdropping on the cues produced from hunters finding ephemeral food patches [11]. Cattle egrets (Bubulcus ibis), for example, aggregate where prey are highly abundant, with feeding rates and prey density being closely linked [27]. In these cases, it is unclear whether the presence of other hunters benefits individuals’ hunting success. In other cases, the presence of other hunters can increase hunting success, even though hunters’ attacks are not coordinated in space. Lionfish (Dendrochirus zebra) alternate attacks on schooling prey and catch more prey when hunting in pairs than when alone [5]. Group hunting in a weakly electric fish (Mormyrops anguilloides) does not appear to be spatially coordinated, and instead hunters may benefit from prey fleeing in their direction when prey escape another hunter’s failed attack [28]. Black headed-gulls (Larus ridibundus) capture twice as many fish when hunting in groups of six than when hunting alone, even though attacks are uncoordinated [29]. If individuals can benefit from the hunting actions of others without spatial coordination of attacks, then these group hunts could explain the origins of more complex group hunting strategies. But the mechanisms allowing increased capture rates for individuals with uncoordinated attacks remain unclear. One possibility is that the alternation of attacks gives hunters the opportunity to save energy, whilst others exhaust and injure the prey. This could allow individuals to benefit from increased capture success during later attacks if it is easier to catch tired, injured prey. Here we investigate whether such a ’proto-cooperative’ strategy could benefit individual hunters in groups. We investigated group hunting sailfish (Istiophorus platypterus) that alternate their attacks on schooling sardine prey (Sardinella aurita) [30, 31]. Attacks by sailfish appear to be uncoordinated in space, and one sailfish will abandon its attack if another individual attacks the school at the same time.
We first used behavioural observations and image analysis to systematically quantify the group hunting strategies of sailfish, which can only be done in the wild. This puts strong constraints on the type and quantity of data we could record. Therefore, to complement our empirical work, we used a mathematical model to test whether the attack-alternation strategy we observed could be effective at allowing predators to increase their capture success beyond that possible for a solitary sailfish. We hypothesised that group hunting would allow individuals to capture more sardines per unit time using this strategy compared to if they hunted alone. Further, we evaluate the predator group sizes where this attack-alternation strategy is beneficial over solo hunting under different hunting conditions. We also investigate whether this form of group hunting is likely to be exploited by free riders, i.e. individuals that wait until the school is sufficiently injured before attacking.
Empirical Materials and Methods
Research was conducted 30-70 km offshore Cancun in the Gulf of Mexico (N21 28.3 -41.15 W86 38.41 -41.30). We observed group hunting sailfish separating smaller schools of sardines from larger ones containing thousands of fish. The sailfish then herded these smaller schools to the surface where the last stage of the hunt occurred. Under snorkel, we used Casio EX-FH100 cameras (operating at 240 fps) to record these smaller sardine schools that were being attacked by the sailfish. We visited this site once a year for 5 years to record the hunting behaviour of sailfish. However, we could only perform the school injury analyses (see below) in videos when sky conditions were overcast (because we required the light to be evenly distributed across the schools). This restricted the amount of data we could use. In total, our analyses are based on 63 minutes of video from 2012 documenting these interactions. Since we did not observe some of the behaviours and could not calculate some of the measures for all schools (n = 8 in total), we report the number of schools used in each analysis below. All research was conducted in line with the laws and legislation of Secretar a de Medio Ambiente y Recursos Naturales, Mexico.
Attack and capture rates
During an attack, sailfish use their rostra to facilitate prey capture by slashing or tapping the sardines [30]. From the videos, we recorded the number of these attack events (n = 210 attacks across all schools) as well as the number of successful prey capture events (n = 51 across all videos). By dividing the total number of captures by the length of the video recordings we had recorded of particular schools, we determined a capture rate for each school (n = 7 schools; note, we did not observe any attacks on one of the schools we recorded). We recorded the number of sardines that the bill hit during these attacks (taps or slashes). This represents the minimum number of fish hit during these attacks because some hits may not have been visible from the camera angle. In 52 out of the 210 attacks, we could not see how many fish were hit and these events were excluded from analysis. We also determined whether we could see if some of the sardines’ scales were removed during the attacks. Scale removal indicates injury to the sardines (Movie 1). Sometimes it was not clear whether scales were removed or not during an attack (due to subsequent obstruction by other fish), and therefore these ambiguous events (n = 61 attacks out of 210) were not included when calculating the proportion of fish that were injured during an attack.
Proportion of the school that was injured
We investigated what proportion of each school had injuries. We selected 39 video stills where light contrast across the schools was minimal. For this analysis, we only selected multiple images from the same video if there was at least 1 minute between the two frames of interest (see Table S1 for the number of images used for each school). The marks on the sardines caused by injuries from the bill have a distinctive white/pinkish appearance, different from other parts of the fish’s bodies or surrounding water (Fig. 1a). This allowed us to use image analysis to determine how injured the fish were in the school. To perform this analysis, we marked a polygon around the edge of the school, and then cleared all pixels from outside the marked polygon (setting their grey-scale intensity to 255). We then adjusted the brightness and contrast of each image so that only the injury marks on the fish became pronounced. By adjusting the brightness and contrast for each image appropriately (Fig. 1b), we could then binary threshold the images to reveal the pixels in each image where the injuries had occurred (Fig. 1c). Note that because the average intensity of each image differed, we had to adjust the brightness and contrasts of each image manually. We imported the binary converted images into MATLAB (2012b). Each image was represented by a matrix where cells equal to zero (black pixels) were injured parts of the school, and cells equal to 255 (white pixels) were uninjured parts of the school. By counting the number of values in the matrix equal to zero, and then by dividing this total by the area of the school calculated by the polygon in ImageJ, we determined the proportion of pixels in the school depicting injuries. We determined the mean proportion of injuries of a school if that school had been measured in multiple images (see Table S1). We note that this semi-automated analysis provides information on a general level of injury, which combines both the frequency and severity of injury into one variable.
Empirical Results
Sailfish Group Hunting Behaviour
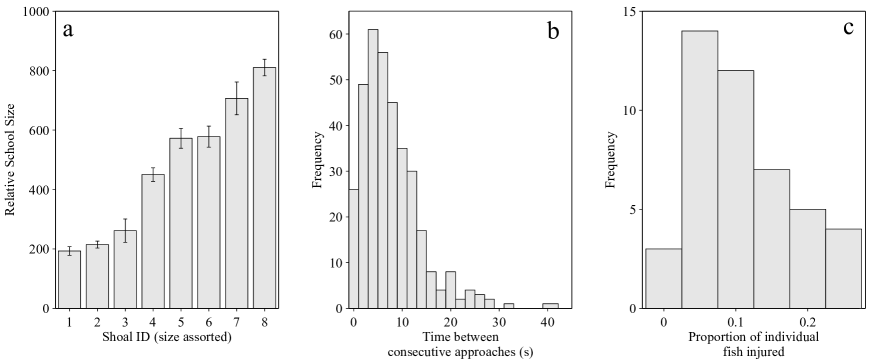
Sailfish were observed in groups of 6 - 40 individuals hunting sardine schools (n = 8) that differed in number from approximately 25 to 100 - 150 fish (Fig. S1a; see Supplementary section 1.1). Due to observational limitations, we could not determine the exact number of sailfish that were hunting each sardine school. Different sailfish alternated their attacks on the sardine schools (Movie S2). Individual identification of all sailfish was not possible, and therefore we could not determine the order in which individual sailfish attacked the prey school. The median time between consecutive approaches by different sailfish was 6.5 seconds (Fig. S1b; see Supplementary section 1.2). There was no relationship between the time between approaches and the sardine school size (Spearman Correlation; = 0.11, n = 7, P = 0.84). The median length of individuals’ attacks was 2.6 seconds, but again, this was not related to school size (Spearman Correlation; = -0.21, n = 7, P = 0.66). A sailfish’s attack was interrupted by another sailfish 19% of the time, after which either one or both sailfish would abandon their attack.
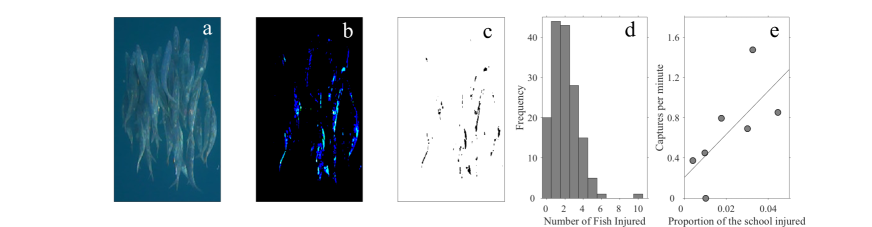
During attacks, sailfish used their bills to ‘tap’ or ‘slash’ at the sardines in an attempt to capture individual fish (Movie 1)[30]. Only 24% of these attacks resulted in a successful capture and we never observed a sailfish to handle or ingest two or more fish at once. However, both the mean and the median number of sardines that were hit with a sailfish’s bill during an attack was 2.0 (Fig. 1d). Whilst the attacks with the bill were very rarely observed to kill the sardines outright, sardines’ scales were removed when contact was made between the sailfish’s bills and the sardines’ bodies in 95% of cases. Because more fish were injured per attack than were caught, this led to many sardines in the schools having pronounced injuries on their bodies, accumulated from past attacks (Fig. 1a). The most heavily damaged fish had over 20% of their body covered in injuries (Fig. S1c and Supplementary section 1.3).
We observed successful captures (n = 51) on six of the eight sardine schools we recorded. Sailfish caught individual sardines at an average rate (across all the schools) of 0.66 0.17 SE sardines per minute. By quantifying the proportion of the school that was injured (Fig. 1 b&c), we found a positive correlation between the school’s injury level and the capture rate (Spearman Correlation; = 0.82, n = 7, P = 0.03; Fig. 1e); sardines in more injured schools were captured more quickly. Given the observational constraints, we could not determine whether it was the most injured fish in the shoal that were captured next, however, we often observed injured sardines breaking off from the prey schools that presumably could not keep pace with the school. These individuals were quickly captured by the sailfish (Movie S3). There were non-significant negative correlations between capture success rates and school size (Spearman Correlation; = -0.54, P = 0.24, n = 7), and between the proportion of the school that was injured and school size (Spearman Correlation; = -0.69, P = 0.07, n = 8; see the Supplementary sections 1.4 and 1.5 for a discussion of these results).
Group Hunting Model
From the empirical information above, it appears that sailfish increase their capture rates as prey become progressively injured from previous attacks. But this does not explain why they hunt in groups, as a solitary hunter could get these benefits by hunting on its own. To better understand why sailfish hunt in groups, therefore, we built a simple mathematical model to capture the dynamics of the hunt. We chose to model group hunting using a non-spatial, individual-based model. On the one hand, this model effectively accounts for the fundamental temporal “mechanics” of the hunt observed in the field, and on the other hand is open to a full analytical investigation of its dynamics. Our model allows us to systematically investigate the rates at which sailfish catch sardines in different predator group sizes. It also allows us to explore potential differences in the strategies predators could use during the hunt. A general advantage of an individual-based approach is that our model can be easily extended to incorporate more additional features, such as agent heterogeneity or stochastic effects.
We consider a group of predators (sailfish), hunting a group of initially prey (sardines). The number of sailfish observed hunting in groups was , however, group sizes exceeding individuals have been previously reported. Therefore in our model we studied a range of group sizes from solitary hunters up to a group size . The prey schools from our empirical observations ranged from sardines. However, we have no information about the number of sardines that were initially separated from the school containing thousands of fish during the initial stages of the hunt. In our model calculations, therefore, we set the initial number of sardines to be larger, but in the same order of magnitude, as the largest groups observed: .
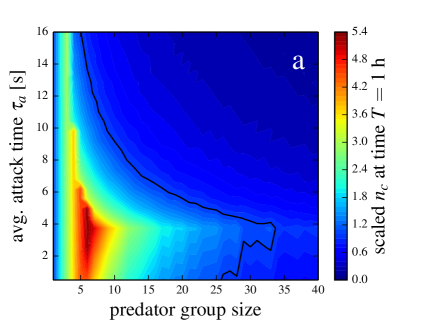
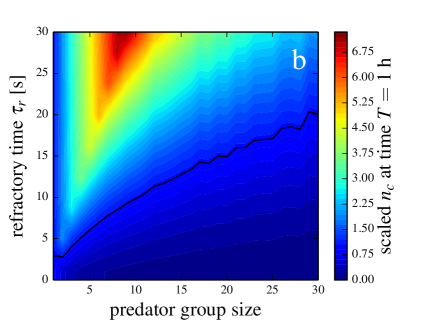
Basic biomechanics predict that small prey (sardine average body length is 19 cm [30]) are more manoeuvrable than larger predators [32, 33] (sailfish are 200 - 250 cm). If the sardines can perform one or more sharp turns, removing a sailfish’s potential for attack, then a sailfish is likely to abandon its attack due to its lower manoeuvrability. Meanwhile, this gives another sailfish an opportunity to initiate its attack sequence. In our model, therefore, each predator needs a finite time to perform an attack, , and after an attack it requires a finite time, , to be ready for the next attack. represents the time where an individual sailfish “monopolises” the prey school by performing its approach, manoeuvre and attack. Here, we set it to the median attack time observed for hunting sailfish; . describes the average time required by an individual hunter to prepare for the next attack sequence, i.e. for the sailfish to assume a suitable position at the rear of the prey school. This time is not available from our observations, as it requires repeated observations of a solitary sailfish hunting a sardine school. However, a reasonable time scale can be estimated from qualitative observations of the hunting process and other time scales, as well as from the assumed cooperative benefits of the hunt. Here we reasonably assume that is larger than , and significantly shorter than min. Therefore, we use as a default parameter . Note that whilst the attack and preparation times may vary, only their average values, and , determine the conditions where group hunting is beneficial (see Fig. S2 for an exploration of how and determine these conditions).
A single predator requires the time for a full attack cycle: “perform attack” () and “prepare for next attack” (). Thus it attacks on average only once during this time interval and the number of attacks scales linearly with time . If we have more than one predator, the average time interval between two attacks by a focal individual depends on the number of predators , whereby two cases have to be distinguished: (i) If is small, then on average all other hunters can perform their attacks within the time required by the focal individual to prepare for the next attack, and the average time interval between initiation of subsequent attacks for the focal individual is simply . (ii) If is larger than , then the focal individual will typically have to wait until other, better prepared individuals have performed their attacks. If we assume that at any time the individual with the longest waiting time will attack next, then typically all other hunters will perform their attacks between two subsequent attacks of the focal individual and the corresponding time interval becomes . In summary, therefore, the average waiting time between two attacks for an individual predator can be expressed as:
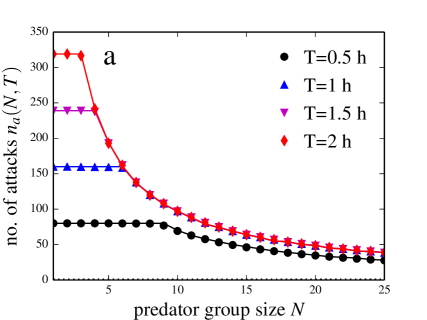
Using this we can calculate the average number of attacks an individual predator performs until time in a group of size (Fig. S3). Note that, , can be interpreted simply as the time available for hunting, and is different from the actual time required to hunt down a school of sardines, (see Fig. S4 for an exploration of how changes depending on the hunters’ group size). The average number of attacks performed by single hunter at time in a group of is given by:
Here indicates the floor function as ;
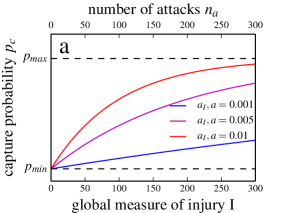
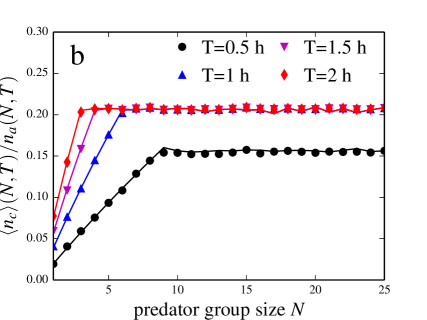
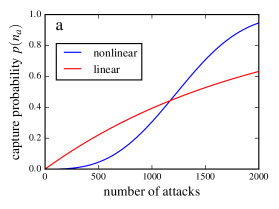
An attacking predator has the probability to catch a single prey. During each attack, there is also a chance that prey are injured. Since it is unclear how the injuries are distributed among individuals, we introduce a global measure of injury in the prey school . In the empirical data, we found a correlation between the level of injury of a school and the capture success rate (see Results). This suggests that the capture probability is a monotonically increasing function of the injury level in the prey school, (Fig. 2a). The capture probability can never exceed 1, thus it has to approach for . Using this, and assuming that the global injury level increases linearly with the number of attacks, we may rewrite the probability of capture as a function of the number of attacks : (see Fig 2a, and Supplementary section 2.1). We have also checked that a nonlinear dependence of on does not qualitatively affect our findings (see Supplementary section 2.2).
During the full cycle of the focal individual (“attack sequence”+“preparation/waiting time”) on average attacks take place, which increases the injury of the prey and therefore the capture probability. The number of attacks performed by all hunters can thus be expressed as , with being the number of the attacks by a focal individual and being the group size. We can calculate the expected number of prey captured by a focal predator at time by summing over all the capture probabilities during its subsequent attacks . Here we have to take into account that the total school size imposes an upper limit on the possible number of fish caught, which is simply the average number of prey per predator . Thus the expected number of prey captured per predator is:
| (1) |
with being the number of attacks performed by the focal individual in a group of hunters, up to (the time available for hunting). We have explored the model’s behaviour with different parameters, and whereas quantitative results might differ, the overall results appear surprisingly robust and the qualitative predictions remain unchanged.
Group Hunt Simulations
In order to test our theoretical predictions, we performed numerical simulations of a simple individual-based model. hunters perform subsequent attacks on a school of sardines, with the initial school size being . The attack sequence of each hunter has a fixed duration . The attack may lead to a successful capture of a single prey with probability , which is a function of the number of all previous attacks on the school according to Eq. S2 in the Supplementary. A simulation run is terminated when all prey are captured . The preparation time for the next attack for each hunter is . The initial attack order is set randomly. As time progresses, the next attack is performed by the individual with the longest waiting time. For a fixed attack duration and preparation time , the initial attack order of the hunters remains unchanged. All results are obtained by averaging independent simulation runs. We confirmed that our results are robust with respect to random attacks and preparation times, which introduces additional stochasticity and randomises the order of the hunters within a single run (see Supplementary section 2.3 for details).
Are there benefits for free riders?
This form of group hunting immediately raises questions surrounding the existence of producers and free riders in groups. Producers (hunters that begin attacking from the start of the hunt) generate a public good where higher levels of prey injury leads to higher capture success rates. There is the potential, therefore, for free riders (individuals that delay their attacks for some time until the school is sufficiently injured) to avoid paying the costs of attacking at the beginning of the hunt where the initial capture probability is low, and profit from the higher capture probability at later stages of the hunt.
In order to explore possible fitness trade-offs in terms of the energy expenditure versus energy uptake, we combined the stochastic individual based model with an energetic balance equation (See Supplementary section 2.4). We consider an “optimal” situation of being a single free rider hunting with producers. The free rider refrains from attacking prey at the beginning of the hunt for a time (attack delay time). Using the energy payoffs an individual receives during the hunt, , we can calculate the relative energy payoff of an individual within a population:
| (2) |
which scales between for minimal energy payoff and for maximal energy payoff. Here, is a function of a sailfish’s base energy expenditure (the energy needed to simply remain with the prey school), the energy required to perform attacks, and the energy received by the captures it makes during a hunt (See Supplementary section 2.4).
In order to assess possible energy benefits of free riders, we calculated the difference between the average relative energy payoff of free riders and producers
| (3) |
Positive values indicate an advantage for the free riding strategy, whereas negative values indicate on average higher energy pay-offs for the producers. All results discussed were obtained by simulating independent runs for each group size and attack delay time .
Modelling Results
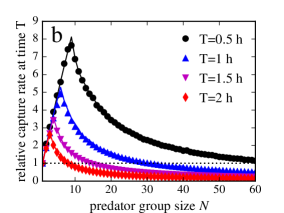
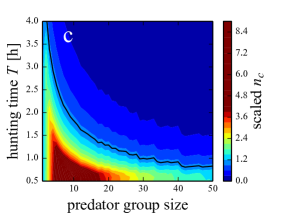
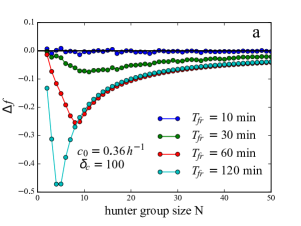
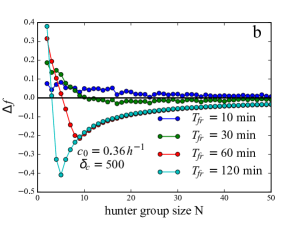
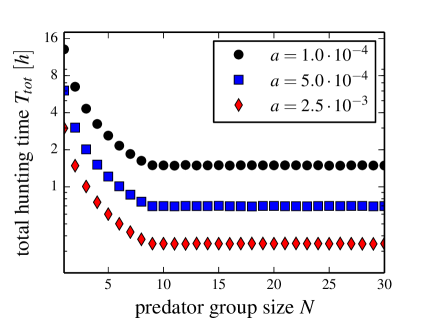
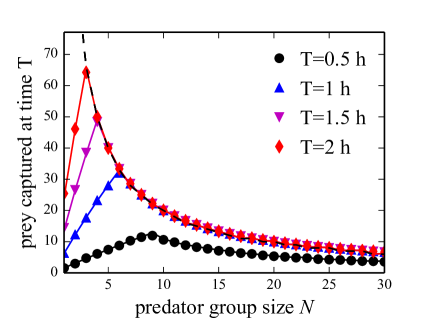
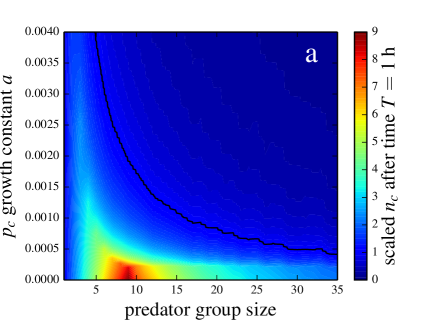
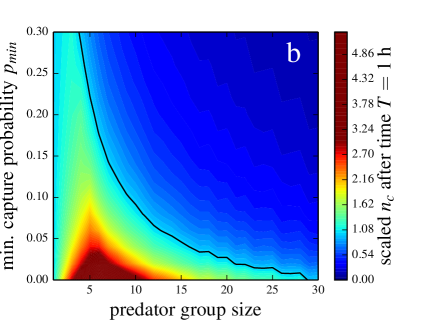
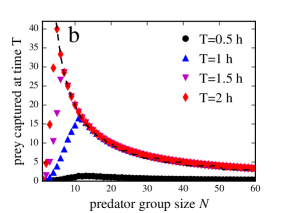
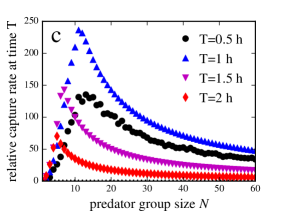
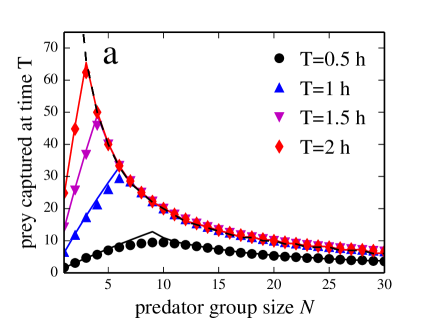
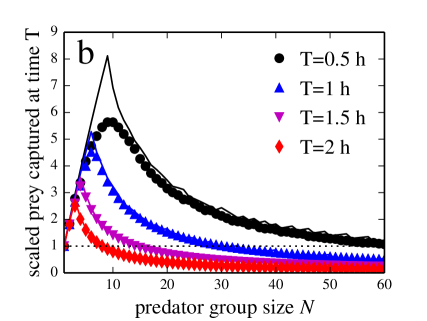
If the time available for hunting , the expected number of sardines caught is always equal to , and always has a maximum at . Hence if time is not a limiting factor, then it is always better for a predator to hunt alone because it would not have to share prey with conspecifics. However, predators may attempt to maximise how many prey they catch per unit time (i.e. the capture rate), and not just the absolute amount of prey they catch (see Supplementary section 1.6). Under this scenario, it may not be beneficial to hunt alone. By performing numerical simulations of the model we determined the conditions where group hunting can improve capture rates for individual sailfish. Figures 2b and c show the number of fish captured per predator as a function of group size , scaled by the number of prey a solitary hunter () would have caught at that time (see Fig. S5 for unscaled values). In this way we can identify the maximum group size , where each individual outperforms a solitary hunter. This depends strongly on the available hunting time. Whilst the optimal group sizes that maximise prey intake rates per hunter are small (10 when hunting times are short () to 3 when hunting times are long ()), the group sizes where group hunting outweighs hunting alone are typically much larger. For we observe , which then quickly decreases to for and for . Eventually, for , will always converge to 1 due to the finite size of the school. At short times , is always larger than , which is the group size at which the individual hunters start to pay temporal costs of group hunting (Fig. S3). We checked how changing the initial number of sardines in the prey school, , affected the conditions under which group hunting was beneficial. Smaller (or larger) initial prey group sizes shifted the hunting times so that shorter (or longer) times made group hunters outperform solitary hunters.
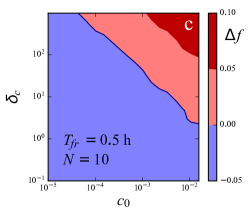
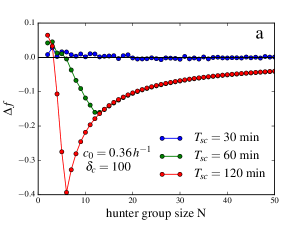
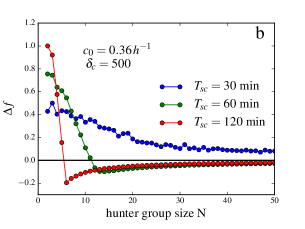
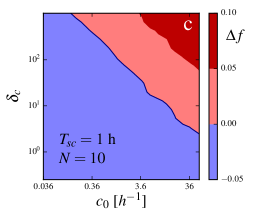
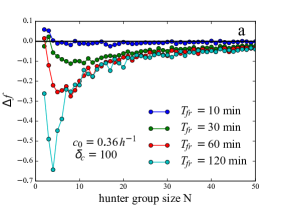
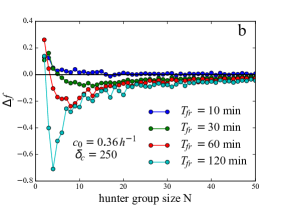
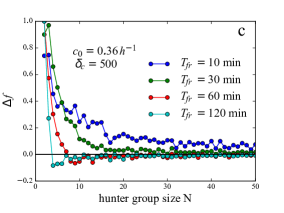
We also investigated whether a free riding strategy could be beneficial for some individuals in groups. One key parameter, , predominantly controls whether there is an advantage for the free riding strategy with respect to energy payoffs (see Supplementary section 2.4 for details). is a dimensionless number that represents the effective increase of the energy expenditure during an attack relative to the base energy expenditure. A value of , would correspond to a doubling of the energy consumption rate during an attack sequence. An advantage for the free riding strategy can only be observed for very large values of (Fig. 3a&b). Even then, this advantage only becomes significant for small hunter group sizes or small attack delay times (Fig. 3b). Decreasing values of and the base energy consumption rate, , make free riding increasingly unlikely for a given group size and hunting time (Fig. 3c). Free riding remains disadvantageous for large regions of parameter space if we allow for nonlinear dependence of the injury level on the number of attacks (Supplementary section 2.2), or if their is the potential for the hunt to be interrupted (see Supplementary section 2.5).
Discussion
We have proposed a simple mechanism that can explain why sailfish hunt in groups. During a sailfish’s attack, more fish are injured than are caught. Injuries can simply result as a byproduct of the sailfish attempting to catch sardines, and we do not suggest the sailfish are attempting to injure but not catch the sardines during attacks. Sailfish bills are covered in small denticles or micro-teeth [34, 30], which likely facilitates this injury. Because more fish are injured than caught per attack, this necessarily leads to more injured fish in the school as the number of attacks increases. We found a positive correlation between the injury level of a school and the rate at which prey in that school were caught. Our modelling approach demonstrated that individuals using an attack alternation strategy whilst hunting in groups can achieve increased per capita capture rates compared to if hunting alone. This strategy does not require spatial coordination of attacks between hunters. Simply hunting in a group can improve capture success rates, even though individuals do not need to change how they attack prey whether alone, or in groups.
Like other systems [28, 29], sailfish do not appear to spatially coordinate their attacks. In fact, sailfish predominantly attack the prey schools when no other individual is doing so (presumably to reduce the risk of individuals injuring themselves during attacks). This suggests that sailfish time their attacks to generally take place after another hunter has departed the prey school. Indeed, temporally coordinated attacks have been observed in other species that hunt grouping prey and have been shown to improve capture success rates [5, 35]. Modelling studies have also indicated that temporally coordinated attacks act to improve capture success rates for group hunters [36]. Whilst temporal, and not spatial coordination occurs during individuals’ attacks, spatial coordination may occur in other aspects of the hunt. Sailfish herd and chase their prey, which may involve individuals moving to positions around the prey school that are dependent on the positions of other hunters. Alternatively, this herding behaviour may simply be a byproduct of predators occupying empty space around the prey school, without direct coordination between predators’ movements, unlike other group hunting species [26]. Fine resolution sonar data will be needed to investigate these herding dynamics further. In any case, we have demonstrated that group hunting can benefit individual sailfish without spatially coordinated attacks or individuals adopting specific hunting roles. Our results also highlight that temporal, rather than spatial coordination of attacks, may allow for simpler forms of cooperative behaviour to evolve.
We found a correlation between the level of injury of the prey school and the capture success rates of sailfish. Whilst we interpret this as a causal link, there are other explanations which could lead to this correlation. For example, if some groups of predators are more efficient at catching prey (and as a byproduct injure more sardines in the school) than other predator groups, this may lead to higher capture rates on more injured schools. Little is known about the social organisation of group-hunting marine fish [37]. The traditional assumption has been that these predators live in fission-fusion systems with little social cohesion [38]. However, novel tracking technology and interest in social networks have provided a fresh methodological and conceptual approach to this topic, producing some evidence for significant co-occurrence of particular individuals [39, 40, 41]. Understanding the social organisation of sailfish groups, perhaps by identifying individuals using unique markings or sail patterns would greatly improve our understanding of this system.
More work is needed to determine the causal mechanism between increased capture success and prey injury level. Whilst we observed injured fish breaking off from the shoal that were quickly captured, it may not always be the most injured fish in groups that are captured next. Injured fish may have reduced ability to transfer directional information about a predators’ location, which in turn could affect the school’s escape manoeuvres [42, 43]. This may lead to non-injured fish being at greater risk in injured, versus non-injured prey schools. It is also likely that multiple attacks can have internal physiological effects on prey behaviour. For example, attacks over time are likely to reduce the energy stores in prey, reducing their ability to perform escape manoeuvres or sustain high escape speeds through fatigue. Hence sustained attacks, even without predators actively injuring their prey, could lead to increased capture success rates for group hunters [44, 45]. This may explain why in other systems, prey intake rate increases as a function of group size, without predators coordinating their attacks [29]. Indeed, the attack and success rates of other marine predators that attack schooling prey are in the same order of magnitude as our study [46, 47]. In theory, our model can be applied to any system where the likelihood of capturing prey increases as a function of the number of attacks of previous predators.
Cooperation through turn-taking strategies has been described in other systems, for example, in predator-inspection behaviour in fish [48, 49]. But the exploration of turn-taking has usually been assessed in dyads and the role of turn-taking is not well understood in larger groups. Indeed, turn-taking strategies in larger groups raise interesting questions regarding the potential for cheating [50]. It has previously been proposed that when hunters attack small grouping prey that cannot be shared, there is no temptation to cheat, as not participating in the hunt returns no pay-offs [51]. However, this approach did not consider that it may be easier to catch prey over time as they receive injuries or become exhausted. The increase in injured prey over time can be interpreted as a public good [52], which may be susceptible to exploitation by cheaters that delay the onset of their attacks. In microbial communities with diffusing public goods, the partial monopolization of resources due to spatial localization, may promote cooperation by denying non-producers access to resources [53, 54]. While such an explicit spatial effect is likely to be absent in the highly dynamic turn-taking hunting process of sailfish, a direct analogy can be drawn via the intrinsic coupling of the production of the public good and the capture of individual prey. Producers (attackers) have access to the prey school from the onset of the hunt, albeit with low initial capture probabilities. Our investigation of the potential energetic trade-offs during the hunt suggests that individuals that delay their onset of attacks (free riders) would only benefit from such a strategy if the cost of attacking was 10 times higher than simply remaining with the prey school. Future work, with observations on the behaviour of individually identifiable predators, will be needed to determine if this strategy exists. Nevertheless, opportunistic access to the prey school, combined with the byproduct of injuring prey during attempted captures, can promote individual hunting success in groups. We regard this form of group hunting, which does not require explicit cooperation, as ‘proto-cooperation’.
Our results demonstrate that individuals can benefit from group-hunting without specific hunting roles (as in collaborative hunting), higher social-organisation or complex cognition. Whilst hunting in groups potentially reduces the total amount of prey an individual predator is likely to catch, sailfish can offset this by collectively catching more prey per unit time when hunting together. This facilitative hunting method raises new questions surrounding the evolution of cooperative behaviour in group living animals.
Competing Interests
We have no competing interests.
Author Contributions
All authors except PR, DS and SK collected field data. JH-R and DS analysed the empirical data and performed statistical analyses. PR designed the modelling component of the paper. All authors wrote the paper. All authors gave final approval for publication.
Data Availability
All data accompanying this paper are available at DataDryad.com doi:10.5061/dryad.t9m6c
Acknowledgments
We thank Rodrigo Friscione Wyssmann and the staff of Solo Buceo for their help in the field. We thank two anonymous referees, B. Taborsky, I.D. Couzin, D.J.T Sumpter, C.E. Tarnita and M. Wolf for helpful comments or discussions on the manuscript.
Funding
JK and PR acknowledge funding from Leibniz-Institute of Freshwater Ecology and Inland Fisheries. PR acknowledges the funding via the P.R.I.M.E. Fellowship by the German Academic Exchange Service. JH-R was supported by a Knut and Alice Wallenberg Foundation Grant awarded to D.J.T Sumpter.
Supplementary Material: Proto-cooperation: Group hunting sailfish improve hunting success by alternating attacks on grouping prey
Proceedings of the Royal Society B: Biological Sciences, DOI: 10.1098/rspb.2016.1671
James E. Herbert-Read1,2,‡,∗, Pawel Romanczuk3,4,5,‡,
Stefan Krause6,
Daniel Strömbom1,7, Pierre Couillaud8,
Paolo Domenici9, Ralf H.J. M. Kurvers3,10,
Stefano Marras9,
John F. Steffensen11,
Alexander D.M. Wilson12,13,
Jens Krause3,4
1 Department of Mathematics, Uppsala University, 75106, Uppsala, Sweden,
2 Department of Zoology, Stockholm University, 10691, Stockholm, Sweden,
3 Leibniz-Institute of Freshwater Ecology and Inland Fisheries, M ggelseedamm 310, Berlin, Germany
4 Faculty of Life Sciences, Humboldt-Universität zu Berlin, 10115 Berlin, Germany,
5 Department of Ecology and Evolutionary Biology, Princeton University, Princeton, 08544 New Jersey, USA,
6 Department of Electrical Engineering and Computer Science, Lübeck University of Applied Sciences, 23562 Lübeck, Germany,
7 Department of Biology, Lafayette College, Easton, 18042, Pennsylvania, USA,
8 Département de la Licence Sciences et Technologies, Université Pierre et Marie Curie, 75005 Paris, France,
9 IAMC-CNR, Istituto per l’Ambiente Marino Costiero, Consiglio Nazionale delle Ricerche, Località Sa Mardini, 09170 Torregrande, Oristano, Italy,
10 Center for Adaptive Rationality, Max Planck Institute for Human Development, 14195, Berlin, Germany,
11 Marine Biological Section, University of Copenhagen, Helsingor, 3000, Denmark,
12 School of Life and Environmental Sciences, University of Sydney, Sydney, NSW, Australia 2006
13 School of Life and Environmental Sciences, Deakin University, Waurn Ponds, Victoria, 3216, Australia, These authors contributed equally to this study,
E-mail: Corresponding author james.herbert.read@gmail.com
1 Empirical Observations
1.1 School size analysis
From the videos, we selected single frames of the sardine schools (n = 123 frames; 8 different schools; see Table S1 for number of images per school) to be analysed and exported them using VirtualDub (v 1.9.11). We imported the images into ImageJ (v 1.36b) and measured the lengths of five haphazardly selected fish in each image (in pixels) using ImageJ’s internal measure function. We marked a polygon around the edge of the school’s members and calculated the internal area of this polygon, again using the measure function. Dividing the area of this polygon (in pixels) by the average length of the five selected fish gave us a proxy for the relative size of each school (Fig. S1a). Sardine length is generally uniform across these schools [30].
1.2 Approach frequency
We recorded the time between consecutive approaches by different sailfish towards the sardine schools (n = 7 schools) (Fig. S1b). The time of approach was determined as the time when a sailfish was within one sailfish body length of the sardine school with its dorsal fin raised. This behaviour is typically observed before an imminent attack [30, 31]. If a sailfish was already approaching the sardine school at the very start of the video, we recorded the time of approach as zero. We also recorded the time at which this sailfish departed the school, which was defined as when the sailfish swam away from the school. The time between the approach and the departure was measured as the ‘attack length’. We also determined the time between one sailfish departing and another sailfish approaching. On 19% of occasions, one sailfish approached the school before another sailfish had departed it. In these cases, one or both sailfish always abandoned their attack.
1.3 Injuries on individual fish
We investigated the extent to which individual sardines were injured. We sampled images from the videos where unobstructed individual injured fish could be seen. In each image, we selected 1- 2 individuals that were visibly the most injured (n = 45). We only selected a fish if another fish obstructed less than 10% of its body surface. Like in the school injury analysis, but now based only on single individuals, we drew a polygon around the outline of the focal fish, calculated the area of the polygon and cleared all pixels from outside this polygon (making their intensity = 255). We then adjusted the brightness and contrast of each image before binary thresholding, and then imported these binary images into MATLAB. We then summed the number of pixels indicating injures (values equal to zero) and divided this total by the area of the polygon measured in ImageJ to determine the proportion of the body of a sardine that was injured.
1.4 Group size effects
Whilst we concentrated on how the sailfish progressively injured prey over time, and how capture rates were correlated with the level of injury in the prey school, there was also a weaker correlation between capture rates and school size (Spearman Correlation; = -0.54, P = 0.24, n = 7). If indeed capture rates do increase as school size decreases (and we could not detect this effect due to limited sample size), then our model could be more broadly applied to other systems. The confusion effect decreases as group size decreases, sometimes making it easier to catch prey in smaller group sizes [55, 56]. If individual hunters progressively decrease the size of the prey group over time, then this could allow hunters in the future to increase capture rates in subsequent attacks. Hence this model may not only apply when prey are injured or fatigued, but also when prey group size decreases over time.
1.5 Injury in the school
There was a negative trend between injury level and school size (Spearman Correlation; = -0.69, P = 0.07, n = 8). Whilst again, the non-significant trend could be due to limited sample size, it may also be due to the dynamics of the hunt. Sailfish break off smaller schools from larger schools numbering into the hundreds of thousands of fish. If a small school was isolated relatively recently, it could in theory have a very low injury level compared to a larger group that had been under attack for a long time. Presumably our observed schools had variable initial sizes and attack durations that could introduce confounding variation into the levels of injury. We also note that our measure of the proportion of the school that was injured combines both the severity of injuries on individual fish, and the spread of injuries across different fish. Both the severity of injuries and spread of injuries across individuals are likely to be important in this system. We sometimes observed very injured sardines breaking off from the school, and these individuals were quickly consumed by the sailfish. Hence the level of injuries on singular fish are likely to be important for improving capture success rates as well as the general injury level of the school.
1.6 Why capture rates are likely to be important for group hunting sailfish
We identified that increased capture rates per unit time was a key benefit for individual hunters in groups. But why might these rates be important to increase, and why might hunting time be restricted? On two occasions we observed spotted dolphins, (Stenella attenuata), arriving at the sardine school that were under attack by sailfish. On arrival at the sardine school, the dolphins used their tails to stun and disperse the whole school. Sailfish that have potentially invested hours into injuring and exhausting their prey can thus lose their fish to the kleptoparasitic dolphins in a few seconds. The number of daylight hours is also likely to put an upper limit on available hunting time. Studies on tagged sailfish show that their time spent near the surface increases during the day (compared to the night) [57], which suggests that hunting primarily takes place at the surface during daytime periods. Hunting time is also likely to be constrained because once the targeted school has been consumed, the sailfish have to find another larger school, separate off a smaller school, and begin hunting again. Reducing the time between these events is presumably important in a time limited system. Further, because individual prey items are not shared, prey caught per unit time may be a particularly important measure of success during these hunts.
2 Modelling Group Hunting
2.1 Mathematical model - capture probability
We assume that the capture probability is a monotonically increasing function of the global injury level , and is bounded by , : . There are infinitely many functions that fulfil these requirements, and based on our empirical observations, we have no a priori arguments to choose a particular one. However, the qualitative results will be independent on the particular choice of . Here we choose
| (S4) |
which increases linearly with for small injury levels and approaches asymptotically for (see Fig. 2a, main text). This function naturally fulfils the monotonic increase in injury level with a necessary saturation level. We have also checked whether a nonlinear dependence of on affects our qualitative findings (see below, Sec 2.2). It is impossible to obtain a reliable value for the initial probability to catch a prey during a full attack sequence (approach to departure), but it appears to be very small. For simplicity we set . Therefore, if not otherwise stated, we use and as default parameters. We have checked that this simplification does not affect the qualitative results. Note that we cannot measure the global injury level directly, and the fraction of prey school covered by injuries is only a visual proxy for . Therefore it is advantageous to express as a function of total number of attacks on the prey .
The increment in the injury level per attack may in principle be an arbitrary function of the global injury itself: . This in general implies a nonlinear dependence of on the number of attacks : . However, if we assume that the increment in the level of injury per attack is constant , then is simply proportional to (). In this case we can set, without loss of generality, , rescale to a new constant , and replace by . The probability can then be directly expressed as a function of the number of attacks as:
| (S5) |
We have explored how the rate of increase of the capture probability, , and affects whether group hunting is beneficial for individuals in groups (Fig. S6). The main observation is a decrease of the maximal beneficial hunter group size with increasing . The choice of will strongly affect the overall time of the hunt before all prey individuals are captured and the average capture efficiency during the hunt (no. prey captured / no. attacks). Large values of yield high average capture efficiencies already after a of hunting () and as a consequence very short hunts () for reasonable prey school sizes. On the other hand extremely low values lead to very low initial capture efficiencies () and eventually result in very long hunting times (see Fig. S4). In combination with other parameters used, a choice of yields total hunting times which appear consistent with our observations: for predator groups .
2.2 Nonlinear dependence of injuries on number of attacks
In the main text, we assumed that the injury increment per attack is independent of the number of previous attacks, which implies a linear relationship between the number of attacks and the prey injury level . Here, we demonstrate that the qualitative results of our model remain unchanged for a nonlinear dependence of the injury level on . We assume with . A direct consequence of such a nonlinear dependence is a sigmoid shape of , where the function changes from convex to concave (change in sign of the second derivative) at a finite number of attacks. The factor controls the location of the midpoint of the sigmoid (), wheras the exponent determines the steepness of the sigmoid. In order to be able to compare results obtained for the linear and nonlinear model variants, we choose the additional nonlinear parameters so that the cumulative capture probability for attacks is approximately the same for both the nonlinear and linear model variant (see Fig. S7a).
In general, the nonlinear injury dependence results in a lower capture probability at low number of attacks in comparison to the linear case. This situation reverses for large as increases strongly in the vicinity of the sigmoid midpoint before asymptotically approaching (Fig. S7a). As a consequence we expect in general lower capture rates at short times for all group sizes, as well as larger potential benefits from free riding at short hunting times. This is confirmed by the corresponding simulation results: First, we observe a very low capture success for small hunting group sizes and short hunting times (low accumulated number of attacks) as shown in Fig. S7b. In particular, this has a strong effect on the relative capture rate, normalised by the rate of solitary hunters. We observe a strong increase in the effective capture rates at short hunting times for group hunting, with respect to the number of prey a solitary hunter would have caught under the same conditions (Fig. S7c). Second, in the nonlinear case (see main text and Supplementary section 2.4 & 2.5), we observe an increased fitness benefit for free riders. This becomes particularly prominent at short hunting times (Figs. S8a,b) and yields a larger region in the energetic parameter space where free riding appears beneficial (Fig. S8c). However, our model predicts that also in the nonlinear case, free riding is unlikely to give fitness benefits for reasonable energetic parameters (in particular ).
2.3 Stochastic model with random attack and preparation times
In the main text we assume fixed, constant attack and preparation times. This yields perfect turn-taking of individuals with the order of attacking individuals set by the initial condition, which are randomised for each hunt. However, a perfect turn-taking behaviour may be questioned from a biological point of view. Furthermore, in general, deterministic temporal sequences may lead to pathological behaviour of mathematical models for certain parameter combinations (“resonances”). In order to confirm that our results are robust and independent on the turn-taking behaviour, we extended the simple model discussed in the main text, to random attack and preparation durations: Instead of fixed duration, we model the attack and preparation times as random variables and drawn from an exponential distribution with averages and , respectively. The initial order of attacking hunters is again random as in the main text, but now the order of the hunters within a single run does not persist but changes randomly due to the stochasticity of the attack and preparation durations. Figure S9 shows the comparison between the simulation results for the (scaled) number of prey captured for this modified model with our theoretical predictions (compare to main text, Fig. 2b and Fig. S5). All simulation results were obtained by averaging over 100 independent simulations. In particular for longer hunts ( large), only the average waiting times are relevant and the results of the fully stochastic model strongly match our theoretical predictions. For short times , the additional stochasticity of the hunting process leads to smoothening of the maximum number of prey captured, but the position of the maximum and the maximal group size beneficial for hunting remain essentially unchanged.
2.4 Energy Balance Equation
As the detailed metabolic costs of swimming and attacking in sailfish are not documented, we considered a simple, yet generic model, where different energetic costs and benefits are summarised in a few key parameters. We assume that each hunter has a base rate of energy expenditure , which includes all metabolic costs of swimming required to stay with the prey school, but excludes any additional energetic investment required to perform an actual attack sequence. For simplicity, we assume that attacks and captures are instantaneous events, which happen at discrete points in time and . This is a reasonable approximation as in general the average attack time will be much shorter than the total hunt time . Prey capture is only possible during an attack, thus capture points are always a subset of the attack points . The additional costs of attack are included into the model as a constant energy decrement due to an increased energy consumption rate during an attack . The energy benefit from each captured prey is given by a constant increment . Thus the total energy for an individual hunter during a hunt evolves according to the following balance equation:
| (S6) | ||||
| (S7) |
with being the Dirac delta function. Without loss of generality, we rescale all terms by the energy increment due to prey capture , thus we measure the energy in units of the average energy content of a single prey item. The rescaled equation reads:
| (S8) |
with , .
By integrating over the entire time of the hunt , we obtain the overall energy payoff per individual as:
| (S9) |
with and being the number of attacks and the number of prey captured by the focal individual.
Finally we rewrite the energy payoffs by pulling out the base rate to obtain:
| (S10) |
Here the dimensionless number represents the effective increase of the energy consumption during an attack relative to the base consumption rate. A value of , would correspond to doubling of the energy consumption rate during an attack sequence. We discuss only biologically relevant parameter values and , where the average energy pay-offs are positive . All other model parameters are the same as in the main text.
Because the routine metabolic rate of adult sailfish in unknown, we estimated a conservative value of based on the routine metabolic rate (RMR) of Blue-fin tuna (Thunnus orientalis). The RMR of a 8.1 kg tuna is 280 mg O2 at 25 oC [58]. The length:weight relationship of adult sailfish is given by: Log W = where W is the mass and L is the length of a sailfish [59]. A sailfish 240 cm in length, therefore, has a mass of 51.8 kg. We can scale the RMR of tuna according to the mass of the sailfish by the following scaling factor: [60, 61]. This gives a RMR for a sailfish as 193.2 mg O2 . This equates to a sailfish requiring 240 g O2 per day. Given the oxycalorific coefficient is 13.59 [62], this equates to a sailfish requiring 3263 kJ of energy per day to maintain RMR. Domenici et al. (2014) found that the average length of sardines found in a sailfish’s stomach was 19 cm [30]. This gives a mass of 57 g per sardine, based on their length:weight relationship [63]. The energy content of similar species (Sardinops melanostictus and Clupea harengus pallasi) is 6 - 9.6 kJ g-1 [64, 65]. An individual sardine, therefore, may provide 342 - 547 kJ of energy to a sailfish. Combining this information together, we estimate that a sailfish would require between 6 - 9.5 sardines per day to maintain RMR. This equates to 0.25 - 0.4 sardines per hour. Here we choose a value of = 0.0001, meaning that a sailfish would need to eat 1 sardine every 10000 seconds (2.8 hours, or 0.35 sardines per hour) to balance energy intake and expenditure. We note that with decreasing values of , the free riding strategy becomes increasingly unlikely.
Another key question is; what is the realistic range of values for ? Our earlier observations indicate that the speed of approach towards the prey school during an attack sequence is similar to the continuous swimming of non-attacking individuals [31, 30]. However, sailfish sometimes initiate rapid swimming bursts when the school attempts to escape into the depths or when chasing single prey that have left the school. Thus significant additional energetic costs of an attack sequence can only originate from these burst swims, the slashing motion of the bill, turning, and prey handling, which are likely to only take-up a small fraction of the entire attack sequence. Even in the case of extremely high costs of slashing/capture, the relative increase in costs of an attack are most likely of the order of the base rate energy consumption (). It seems unlikely, therefore, that a free riding strategy could yield benefits to individuals.
2.5 Free riding during interrupted hunts
We also take into account the possibility of the hunt being interrupted due to external influences, for example, the arrival of other predators (e.g. dolphins). This is modelled by a constant probability of the hunt being terminated. For , no interruption takes place and the hunt continues until all prey are captured. For finite the hunt is interrupted randomly, and times available for hunting are exponentially distributed with the average time .
The qualitative findings do not depend on this model extension, and a significant energetic advantage of free riding can be observed only for very large values (Fig. S10). Interestingly, in these extreme cases with the finite probability of interruption of the hunt, the free rider advantage becomes more pronounced. This can be understood from the high energetic costs and negligible payoffs for producers in cases where the hunt was interrupted at an early stage.
3 Supplementary Figures
4 Supplementary Movies
Movie S1: One sailfish approaches and attacks a school of approximately 25 sardines.
When the sailfish’s bill makes contact with the sardines, the sardines’
scales are removed. Note the injury marks on the sardines’ bodies. The video is played at 1/8 of real time.
Movie S2: Sequence demonstrating that sailfish alternate attacks on their prey. Notice not all approaches results in attacks. Multiple prey are injured in the attack at 12 seconds, while only one sardine is caught. Not all attacks result in prey capture, for example, see attack at 27 seconds. Not all attacks result in prey being injured (attempted slash at 33 seconds). Also notice that sailfish tend to abandon attacks if they get out of position, or if another sailfish approaches the school at the same time. Video is played in real time.
Movie S3: An injured sardine break aways from the school and is quickly captured by a sailfish. The video is played at 1/8 of real time.
5 Supplementary Tables
| School | #Images: School Size | #Images: Proportion of injuries |
|---|---|---|
| 1 | 12 | 1 |
| 2 | 18 | 14 |
| 3 | 11 | 4 |
| 4 | 10 | 1 |
| 5 | 9 | 1 |
| 6 | 13 | 1 |
| 7 | 10 | 8 |
| 8 | 40 | 9 |
| Symbol | Description |
|---|---|
| Base Model | |
| number of predators | |
| initial number of prey | |
| average time required to perform an attack sequence | |
| average time required to prepare for an attack sequence | |
| capture probability at zero injury | |
| maximal possible capture probability | |
| growth rate of injury/capture probability with each attack | |
| Model Extensions | |
| metabolic base rate measured in number or prey items per unit time | |
| increase of the energy consumption during an attack relative to the base rate | |
| constant probability per unit time of the hunt being interrupted | |
| nonlinearity exponent for the dependence of injury levels on the number of attacks | |
| nonlinearity factor | |
References
- 1. Wilson EO (1958) The beginnings of nomadic and group-predatory behavior in the ponerine ants. Evolution 12.
- 2. Duncan FD, Crewe RM (1994) Group hunting in a ponerine ant, Leptogenys nitida Smith. Oecologia 97:118–123.
- 3. Harwood G, Avilés L (2013) Differences in group size and the extent of individual participation in group hunting may contribute to differential prey-size use among social spiders. Biol. Lett. 9:20130621.
- 4. Handegard NO, et al. (2012) The dynamics of coordinated group hunting and collective information transfer among schooling prey. Curr. Biol. 22:1213–1217.
- 5. Lönnstedt OM, Ferrari MC, Chivers DP (2014) Lionfish predators use flared fin displays to initiate cooperative hunting. Biol. Lett. 10:20140281.
- 6. Strübin C, Steinegger M, Bshary R (2011) On group living and collaborative hunting in the yellow saddle goatfish (Parupeneus cyclostomus) 1. Ethol. 117:961–969.
- 7. Vail AL, Manica A, Bshary R (2013) Referential gestures in fish collaborative hunting. Nat. Comm. 4:1765.
- 8. Vail AL, Manica A, Bshary R (2014) Fish choose appropriately when and with whom to collaborate. Curr. Biol. 24:R791–R793.
- 9. Hector DP (1986) Cooperative hunting and its relationship to foraging success and prey size in an avian predator. Ethol. 73:247–257.
- 10. Ellis DH, Bednarz JC, Smith DG, Flemming SP (1993) Social foraging classes in raptorial birds. Bioscience 43:14–20.
- 11. Dechmann DK, et al. (2009) Experimental evidence for group hunting via eavesdropping in echolocating bats. Proc. Roy. Soc. B: Biol. Sci. 276:2721–2728.
- 12. Scheel D, Packer C (1991) Group hunting behaviour of lions: a search for cooperation. Anim. Behav. 41:697–709.
- 13. Bailey I, Myatt JP, Wilson AM (2013) Group hunting within the carnivora: physiological, cognitive and environmental influences on strategy and cooperation. Behav. Ecol. Sociobiol. 67:1–17.
- 14. Gazda SK, Connor RC, Edgar RK, Cox F (2005) A division of labour with role specialization in group-hunting bottlenose dolphins (Tursiops truncatus) off Cedar Key, Florida. P. Roy. Soc. B: Biol. Sci. 272:135–140.
- 15. Stander PE (1992) Cooperative hunting in lions: the role of the individual. Behav. Ecol. Sociobiol. 29:445–454.
- 16. Creel S, Creel NM (1995) Communal hunting and pack size in african wild dogs, Lycaon pictus. Anim. Behav. 50:1325–1339.
- 17. Anderson C, Franks NR (2003) in Advances in the study of behavior, Vol 33, Advances in the study of behavior., eds Slater PJB, Rosenblatt JS, Snowdon CT, Roper TJ (Elsevier Academic Press, San Diego, CA, US), pp 1–48.
- 18. Schmidt PA, Mech LD (1997) Wolf pack size and food acquisition. Am. Nat. 150:513–517.
- 19. Packer C, Scheel D, Pusey AE (1990) Why lions form groups: food is not enough. Am. Nat. 136:1–19.
- 20. Vucetich JA, Peterson RO, Waite TA (2004) Raven scavenging favours group foraging in wolves. Anim. Behav. 67:1117–1126.
- 21. Carbone C, Du Toit J, Gordon I (1997) Feeding success in african wild dogs: does kleptoparasitism by spotted hyenas influence hunting group size? J. Anim. Ecol. 66:318–326.
- 22. Major PF (1978) Predator-prey interactions in two schooling fishes, Caranx ignobilis and Stolephorus purpureus. Anim. Behav. 26:760–777.
- 23. Eklöv P, Diehl S (1994) Piscivore efficiency and refuging prey: the importance of predator search mode. Oecologia 98:344–353.
- 24. Clapham PJ (2000) in Cetacean Societies, field studies of dolphins and whales., eds Mann J, Connor R, Tyack P, Whitehead H (University of Chicago Press, Chicago.), pp 173–196.
- 25. Leighton TG, Richards SD, White PR (2004) Trapped within a wall of sound. Acoust Bull 29:24–29.
- 26. Würsig B (1986) in Dolphin cognition and behavior: A comparative approach, eds Schusterman R, Thomas JA, Wood FG (Lawrence Erlbaum, Hillsdale, New Jersey), pp 347–359.
- 27. Scott D (1984) The feeding success of cattle egrets in flocks. Anim. Behav. 32:1089–1100.
- 28. Arnegard ME, Carlson BA (2005) Electric organ discharge patterns during group hunting by a mormyrid fish. P. Roy. Soc. B: Biol. Sci. 272:1305–1314.
- 29. Götmark F, Winkler DW, Andersson M (1986) Flock-feeding on fish schools increases individual success in gulls. Nature 319:589–591.
- 30. Domenici P, et al. (2014) How sailfish use their bills to capture schooling prey. Proc. Roy. Soc. B 281:20140444.
- 31. Marras S, et al. (2015) Not so fast: Swimming behavior of sailfish during predator–prey interactions using high-speed video and accelerometry. Integr. Comp. Biol. 55:719–727.
- 32. Webb PW, De Buffrénil V (1990) Locomotion in the biology of large aquatic vertebrates. Trans. Amer. Fish Soc. 119:629–641.
- 33. Domenici P (2001) The scaling of locomotor performance in predator–prey encounters: from fish to killer whales. Comp. Biochem. Phys. A 131:169–182.
- 34. Fierstine HL, Voigt NL (1996) Use of Rostral Characters for Identifying Adult Billfishes (Teleostei: Perciformes: Istiophoridae and Xiphiidae). Copeia 1996:148–161.
- 35. Thiebault A, Semeria M, Lett C, Tremblay Y (2016) How to capture fish in a school? effect of successive predator attacks on seabird feeding success. J. Anim. Ecol. 85:157–167.
- 36. Lett C, Semeria M, Thiebault A, Tremblay Y (2014) Effects of successive predator attacks on prey aggregations. Theor. Ecol. 7:239–252.
- 37. Fréon P, Dagorn L (2000) Review of fish associative behaviour: toward a generalisation of the meeting point hypothesis. Rev. Fish. Biol. Fisher. 10:183–207.
- 38. Krause J, Butlin RK, Peuhkuri N, Pritchard VL (2000) The social organization of fish shoals: a test of the predictive power of laboratory experiments for the field. Biol. Rev. 75:477–501.
- 39. Wilson ADM, Croft DP, Krause J (2014) Social networks in elasmobranchs and teleost fishes. Fish. Fisher. 15:676–689.
- 40. Bayliff WH (1988) Integrity of schools of skipjack tuna, Katsuwonus pelamis, in the eastern pacific ocean, as determined from tagging data. Fish. B-NOAA 86:631–643.
- 41. Klimley AP, Holloway CF (1999) School fidelity and homing synchronicity of yellowfin tuna, thunnus albacares. Mar. Biol. 133:307–317.
- 42. Gerlotto F, Bertrand S, Bez N, Gutierrez M (2006) Waves of agitation inside anchovy schools observed with multibeam sonar: a way to transmit information in response to predation. ICES Journal of Marine Science: Journal du Conseil 63:1405–1417.
- 43. Nøttestad L, Axelsen BE (1999) Herring schooling manoeuvres in response to killer whale attacks. Can. J. Zool. 77:1540–1546.
- 44. Domenici P, Batty R, Similä T (2000) Spacing of wild schooling herring while encircled by killer whales. J. Fish Biol. 57:831–836.
- 45. Guinet C, Domenici P, De Stephanis R, Ford LBLJ, et al. (2007) Killer whale predation on bluefin tuna: exploring the hypothesis of the endurance-exhaustion technique. Mar. Ecol. Prog. Ser. pp 111–119.
- 46. Parrish JK (1992) Levels of diurnal predation on a school of flat-iron herring, Harengula thrissina. Envi Biol Fishes 34:257–263.
- 47. Parrish JK, Strand SW, Lott JL (1989) Predation on a school of flat-iron herring, Harengula thrissina. Copeia 1989:1089–1091.
- 48. Dugatkin LA (1997) Cooperation Among Animals: An Evolutionary Perspective (Oxford University Press, New York).
- 49. Milinski M (1987) Tit for tat in sticklebacks and the evolution of cooperation. Nature 325:433–435.
- 50. Dugatkin LA (1997) The evolution of cooperation. Bioscience 47:355–362.
- 51. Packer C, Ruttan L (1988) The evolution of cooperative hunting. Am. Nat. 132:159–198.
- 52. Levin SA (2014) Public goods in relation to competition, cooperation, and spite. Proc. Natl. Acad. Sci. 111:10838–10845.
- 53. Allen B, Gore J, Nowak MA (2013) Spatial dilemmas of diffusible public goods. Elife 2:e01169.
- 54. Drescher K, Nadell CD, Stone HA, Wingreen NS, Bassler BL (2014) Solutions to the public goods dilemma in bacterial biofilms. Curr. Biol. 24:50–55.
- 55. Landeau L, Terborgh J (1986) Oddity and the confusion effect in predation. Anim. Behav. 34:1372–1380.
- 56. Ioannou C, Tosh C, Neville L, Krause J (2008) The confusion effect - from neural networks to reduced predation risk. Behav. Ecol. 19:126–130.
- 57. Hoolihan JP (2005) Horizontal and vertical movements of sailfish (Istiophorus platypterus) in the Arabian Gulf, determined by ultrasonic and pop-up satellite tagging. Mar. Biol. 146:1015–1029.
- 58. Blank JM, et al. (2007) Temperature effects on metabolic rate of juvenile pacific bluefin tuna Thunnus orientalis. J. Exp. Biol. 210:4254–4261.
- 59. Velayudham R, Veeramuthu S, Kesavan K (2012) Length-weight relationship and morphometrics of the sailfish, Istiophorus platypterus (Shaw & Nodder) from Parangipettai, Southeast coast of India. Asian Pac. J. of Trop. Biomed. 2:373–376.
- 60. Schurmann H, Steffensen J (1997) Effects of temperature, hypoxia and activity on the metabolism of juvenile atlantic cod. J. Fish Biol. 50:1166–1180.
- 61. Edwards R, Finlayson D, Steele J (1972) An experimental study of the oxygen consumption, growth, and metabolism of the cod (Gadus morhua L.). J. Exp. Mar. Biol. Ecol. 8:299–309.
- 62. Brett J, Groves T (1979) Physiological energetics. Fish Physio. 8:279–352.
- 63. FishBase (Accessed Jan 2016) Length-weight parameters for Sardinella aurita. http://www.fishbase.se/PopDyn/LWRelationshipList.php?ID= 1043&GenusName=Sardinella&SpeciesName=aurita&fc=43.
- 64. Benoit-Bird K (2004) Prey caloric value and predator energy needs: foraging predictions for wild spinner dolphins. Mar. Biol. 145:435–444.
- 65. Anthony J, Roby D, Turco K (2000) Lipid content and energy density of forage fishes from the northern gulf of alaska. J. Exp. Mar. Biol. Ecol. 248:53–78.