Granular matter
\corresPatricio Cordero
Phil. Trans. R. Soc
Effect of the vibration profile on shallow granular systems
Abstract
We describe the collective behavior of a system of many inelastic spherical particles inside a box which is being periodically vibrated. The box is shallow, with large horizontal dimensions, while the height is less than two particle diameters. The vibrations are not symmetric: the time the box is moving up is, in general, different to the time it is moving down. The limit cycles of isolated grains are largely affected by the asymmetry of the vibration mode, increasing the size in phase space of the chaotic regions. When many grains are placed in the box, the phase separation between dense, solid-like regions, coexisting with fluid-like regions takes place at smaller global densities for asymmetric vibration profiles. Besides, the order parameter of the transition takes larger values when asymmetric forcing is used.
keywords:
granular systems, phase separation, low-dimensional dynamical systems, numerical simulations1 Introduction
Granular systems, characterized by the dissipative collisional dynamics of macroscopic objects still defy our understanding. When energy is injected at a high enough rate to compensate for the dissipated energy dynamical states are generated. Granular media, in many aspects, resemble molecular fluids. However, the energy dissipated at every collision permanently keeps those systems in a non-equilibrium state. The origin of the non-equilibrium states is that energy injected by one mechanism—for example collisions with the walls—is dissipated by a different one, interparticle collisions. A necessary condition for equilibrium would be detailed balance which is not present in our system.
It has been shown that varying the injection mechanism generates non-equilibrium states with different properties. For example, the shear viscosity varies from case to case. Compare the outcomes in Ref.[1], where the Inelastic Hard Sphere model is used in all cases, but the driving mechanism is different. Hence it is interesting to study the different behaviors of the system when different energy injection mechanisms are used.
A particular geometry to study granular systems that has gained interest is the quasi two-dimensional (Q2D) configuration. In this case grains are put in a shallow box: large horizontal dimensions and a rather small vertical one. The box is vertically vibrated and the spherical grains gain energy colliding with the top and bottom plates. This energy is partly transfered to the horizontal directions through collisions.
Using shallow boxes has many advantages. In experiments, it allows the dynamics of the granular layer to be fully visualized by imaging the system, as all particles can be seen and recorded with a camera from the top. This makes it possible to accurately study the system in a microscopic way, as particle’s positions and velocities can be measured for most particles at any time. Also the collective behavior can be captured [2, 3, 4, 5, 6]. Implied by the energy injection mechanism, the horizontal kinetic energy of the grains can be quite different from the vertical kinetic energy [7, 8].
When the height of the box is less than twice the particle’s diameter we have a particular and relevant case: no two particles can be on top of one another. Here, gravity does not play a direct role in the horizontal dynamics and the indirect effects can be controlled and reduced by means of increasing the dimensionless acceleration of the box. More importantly, gravity is perpendicular to the eventual directions of phase separation, allowing to discard many known mechanisms. Nevertheless, experiments and simulations have shown that segregation can also take place between grains that differ in size or mass [8, 9].
It has been observed that a particular phase separation takes place in shallow boxes: grains form solid-like regions surrounded by fluid-like ones having high contrasts in density, local order and granular temperature [2]. This phase separation is driven by the negative compressibility of the effective two dimensional fluid [3] and, depending on the height of the box, it can be either of first or second order [10, 11].
In the present article we study the role that the energy injection plays in the phase separation in Q2D systems. To do so, keeping the material properties and geometry of the system unchanged, we vary the waveform profile of the vibration. That is, we change the pure sinusoidal profile where the upward and downward phases are symmetric, to asymmetric profiles where both phases take different times. Under these conditions we first analyze the dynamics of isolated grains looking for the limit cycles that each one of them develops. For the case of an isolated particle with no top wall see [12, 13, 14]. Next we consider dense regimes where the grains interact so that phase separation may take place. It is found that asymmetric vibration profiles increase the size of the chaotic regions in phase space and also facilitate phase separation. Our main tool are event driven molecular dynamics simulations, making use of our own quite efficient strategy [15]. See also [16].
2 The Model
2.1 System setup
The grains are inelastic hard spheres with rotational degrees of freedom. These particles are in a vertically vibrated shallow box, namely we consider granular systems in a box with a height of the order of two particle diameters and much larger horizontal dimensions. Collisions are characterized by normal and tangential restitution coefficients as well as friction coefficients.
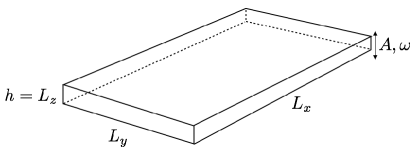
The diameter of the particles, the acceleration of gravity and the mass of the particles are used to define the dimensionless expressions in this article, except that time is measured in oscillation periods, . The horizontal lenghts of the box and will be different in different simulations, although in all cases they will be large compared with the confinement height , which is taken to be between and . Simulations to study the phase separations are done with , where the system remains homogeneous in the direction, allowing us to measure the density contrast between the solid-like cluster and the surrounding liquid-like phase. The vibration is characterized by the amplitude and frequency . Finally, collisions are characterized by the following mechanical parameters: normal and tangential restitution coefficients and , while the static and dynamic friction coefficients are and . Their specific values will be given in each case.
2.2 Symmetric profiles: sinusoidal versus parabolic
It may seem natural to consider sinusoidal vibrations, but we have studied systems for which the vibration cycle is characterized by four separate parabolic movements in the sense that the height depends quadratically in time. The acceleration is piecewise constant, with values . This parabolic movement is described in detail in the next subsection. It will be interesting to observe that for a given vibration frequency there is a range of amplitudes for which the system behaves almost as if there were sinusoidal vibrations.
2.3 Asymmetric profiles
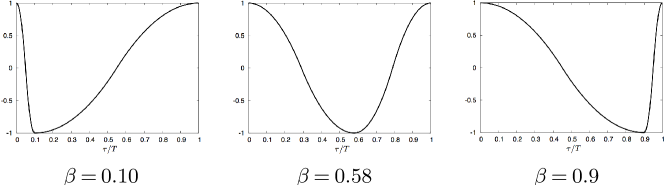
In our studies energy is injected to the system by means of vertically vibrating the box using asymmetric modes where, again the acceleration is piecewise constant. We define the asymmetry coefficient , , which divides the period in two intervals of size and . In the first interval the box moves down with accelerations , while in the second one the box moves up with accelerations .
The height of the top (+) and bottom (-) walls of the box are given by
| (1) |
where and
| (2) |
This function is continuous and has continuous first derivatives. The first derivative of vanishes at , and at . For this quadratic function roughly resembles .
The control parameters are the asymmetry parameter , the amplitude and angular frequency of the oscillations. The latter is characterized by the dimensionless acceleration and dimensionless velocity .
3 A single particle in the vibrating box
In the case of shallow boxes it is important to understand first the movement of a single particle. There are conditions under which the particle ends up in permanent contact with the base of the box. But if is larger than unity such situation cannot occur. Next, it may happen that the energy injected to the particle by the basis is not enough for the particle to reach the upper wall in the long term evolution. We consider conditions under which neither of these last two cases can take place.
If the single particle is left bouncing for a sufficiently large time, its angular and horizontal translation velocities vanish so that the movement of the particle becomes strictly one dimensional and the friction coefficients as well as the tangential restitution coefficient become irrelevant. There is a wide range of amplitudes and frequencies for which the particle reaches this quite simple limit cycle characterized by two velocities: the velocities with which the particle bounces off the two horizontal walls.
Increasing the vibration frequency or the amplitude the limit cycle of the single particle reaches a threshold above which the limit cycle suffers a bifurcation. Now the grain bounces twice at the top and bottom walls before repeating its movement. Hence the new limit cycle takes twice the time associated to the limit cycle just before the bifurcation. There is a chain of bifurcations of this type until the bouncing of the single particle becomes chaotic. Some cases of the resulting limit cycles are presented in Fig. 3. All this can be appreciated in Figure 4 where it is seen that other modes appear as the amplitude grows, that is, the particle has more than one bouncing mode for a given value of the amplitude. Figure 4 includes in red the bouncing velocities when the vibration is sinusoidal with the same frequency and amplitude as our parabolic vibration. To our surprise, when the bouncing velocities are almost exactly the same till about .
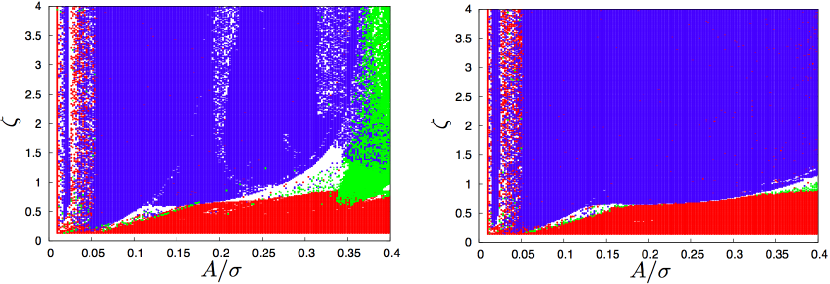
Figure 5 presents a qualitative picture of the possible outcomes. Different colors are used to represent the single period, double period, and chaotic motion cases. The comparison shows how similar is the behavior with sinusoidal and parabolic profiles, except that for large amplitudes the parabolic profiles are more regular. In both cases, a band of chaotic motion is present for small amplitudes.
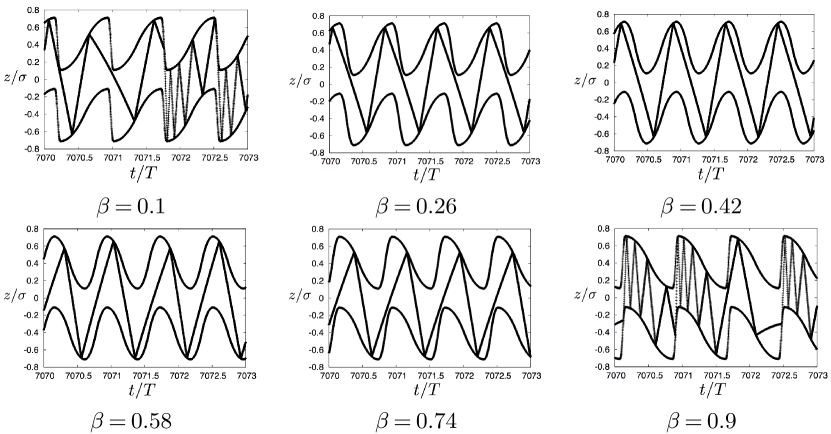
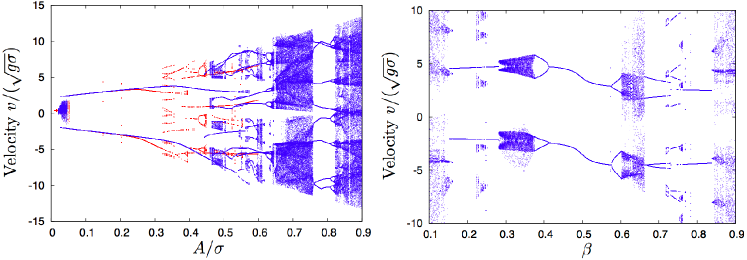
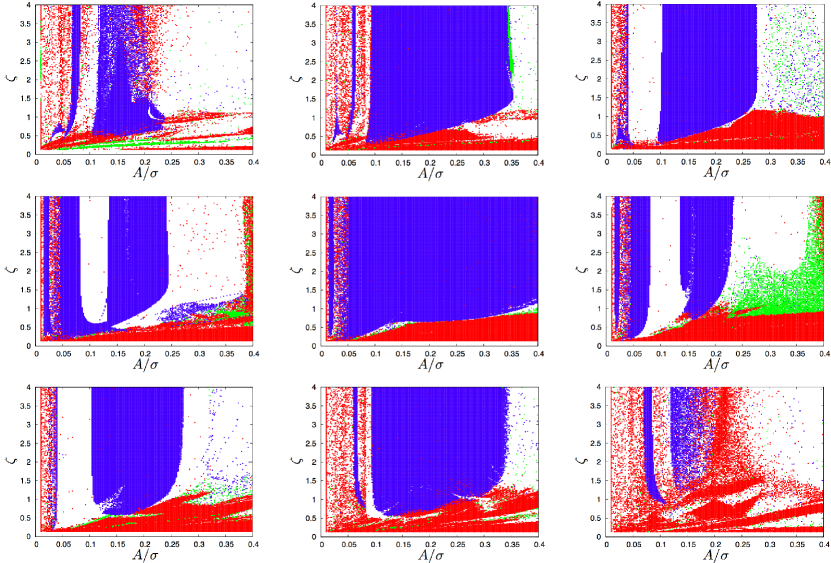
Using the same analysis, we consider the asymmetric profile, varying the parameter in the case where in the symmetric profile the limit cycle consists on a single bounce on the top and bottom walls. Figure 4 shows that close to the symmetric case () the limit cycle is perturbed, keeping its qualitative behavior but changing the values of the bouncing velocities. Further away from the symmetric condition, period doubling and chaos appears. The qualitative plots in Figure 6 confirm this result. The most regular motion is obtain in the vicinity of . For intermediate values of figure 6 shows that the effect of gravity is obvoius in the case of smaller values of while for large (small ) the structure of the figure is weekly dependent of .
 |
4 Phase separation
In the case of systems composed by a single species of granular matter there are conditions under which the system separates into high and low density zones [3]. The results of the previous section illustrate a central point: the form of the vibration—determined by the parameter —has an important effect in the way the system behaves. This is illustrated in Figure 7 which shows a characteristic state of a vibrated granular system in a narrow 3D box: depending on the value of the system may or may not present phase separation. Indeed, with all other parameters fixed to a case where the symmetric case would yield to a state with no phase separation, forcing with asymmetric profiles induces phase separation.
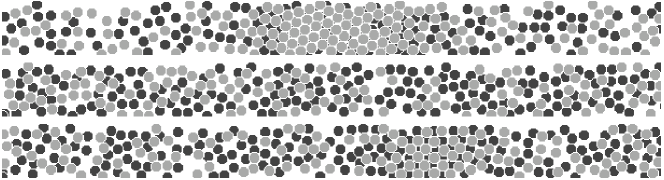
For a quantitative analysis, we define the contrast observable , which is the ratio between the smaller and larger observed area densities: . In the case of the system shown in Fig. 7, which are strictly 3D, the density is evaluated considering many transversal strips and calculating the area density in each strip, defined using the projection of the particles in each 2D strip.
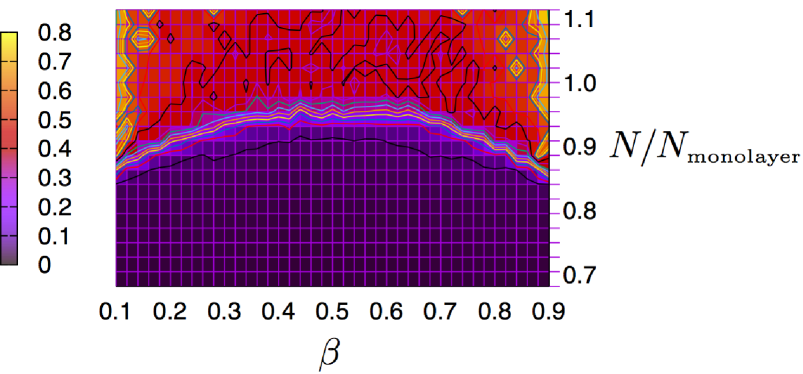
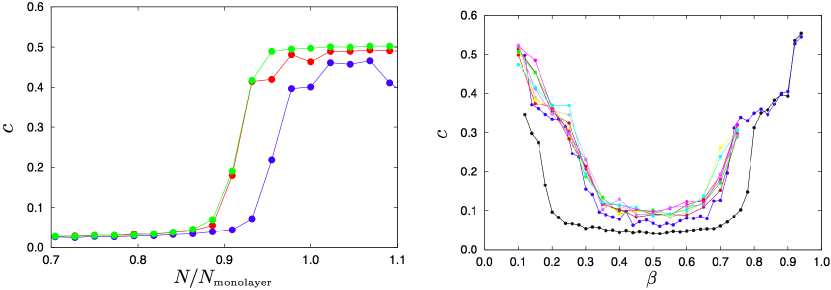
Figure 8 shows that, in agreement with the snapshots in Fig. 7, the density contrast is larger when is away from the symmetric case . A transition line can be identified where there is steep increase in . This transition line indicates that away from the symmetric case, a smaller number of particles is needed to produce the phase separation. This is clearly presented in the left panel of Fig. 9, where the contrast is shown as a function of the number of particles for three values of . A clear transition is observed, with a critical number of particles that is larger for .
Figure 9-right presents the contrast as a function of for a fixed number of particles and different values of . The collapse between the majority of the curves shows that the mayor impact in the phase separation is the shape of the vibration rather than the energy injection rate.
5 Conclusions
In this article we have studied the role of changing the energy injection profile of the box in vibrofluidized shallow granular media, where the box moves vertically in a periodic way. With this aim we modify the oscillation profile. Originally, the profile was symmetric with piecewise constant accelerations, mimicking a sinusoidal oscillation. This profile was changed to an asymmetric one, still with piecewise constant accelerations, where the downward and upward phases take different fractions of the oscillation period: and , respectively.
Single isolated grains reach states where the motion is purely vertical. These states can be periodic in the form of limit cycles with the same period as the box or with a period that is an integer multiple of the box period. Also chaotic or irregular motion is possible. The effect of moving toward asymmetric forcing is to increase the region in parameter space where chaotic motion is observed. Conversely, it is more probable to find regular motion with the same period as the box for the symmetric forcing.
The asymmetric forcing also has an effect on the phase separation between dense and dilute regions when many particles are placed in the box. The phase separation takes place for smaller number of particles when the forcing is asymmetric. The previous result suggests that other ways of increasing the asymmetry could also be efficient in producing phase separation. As an extreme case, we consider a sawtooth profile at high frequency and small amplitude, such that particles always meet the walls at the same position and approaching the particles with a fixed velocity. Figure 10 shows that indeed phase separation takes place and high contrast states can be attained.
It remains as an open question if there is a relation between the accessibility to chaotic behavior for single particles far from the symmetric profile and the enhanced phase separation in the collective dynamics with many particles.

In Ref. [3] it was shown that the origin of the phase separation is a negative compressibility region in the effective equation of state of the pressure as a function of density . This equation of state emerges as a consequence of the temperature being enslaved to the density under high vertical confinement, with a monotonically decreasing function. Then, equations of state derived from kinetic theory, with positive compressibility can turn into effective equations of state with negative compressibility and van der Waals loops [17]. An attempt to understand why is it that for far from a phase separation takes place for lower densities it would be necessary to study in the stationary regime the enslaving , which will depend on . This analysis needs the study of the limit cycles coupled with the three-dimensional collisions that transfer energy from the vertical to the horizontal degrees of freedom. This analysis, beyond the scope of this article, is postponed for a further study
The result of the present article as well as others confirm that the properties of non-equilibrium systems depend not only on the internal dynamics but also on the energy injection mechanism. Consistent with this it should be said that there is no guarantee that the conclusions raised here could be valid for other forcing mechanisms.
6 Authors contributions
P. Cordero and D. Risso carried out the simulations. All authors participated in the design of the simulations, analysis the results and writing of the manuscript.
This research was supported by Fondecyt Grants Nos. 1120775 and 1140778.
References
- [1] J.J. Brey, J.W. Dufty, C.S. Kim, and A. Santos, Phys. Rev. E 58, 4638 (1998). A. Santos, V. Garzó, and J.W. Dufty, Phys. Rev E 69, 061303 (2004). P. Cordero, D. Risso, and R. Soto, Physica A 356, 54 (2005). R. Soto, D. Risso, and R. Brito, Phys. Rev. E 90, 062204 (2014).
- [2] J.S. Olafsen, J.S. Urbach, Phys. Rev. Letters 81 4369, (1998); A. Prevost, P. Melby, D.A. Egolf, and J.S. Urbach, Phys. Rev. E, 70 050301(R) (2004); P. Melby et al., J. Phys. Cond. Mat. 17, S2689-S2704 (2005).
- [3] M.G. Clerc, P. Cordero, J. Dunstan, K. Huff, N. Mujica, D. Risso and G. Varas, Nature Physics 4 249 (2008).
- [4] T. Schnautz, R. Brito, C.A. Kruelle, and I. Rehberg, Phys. Rev. Lett. 95, 028001 (2005).
- [5] F.F. Chung, S.S. Liaw, and C.Y. Ju, Gran. Matter 11, 79 (2009).
- [6] F. Pacheco-Vazquez, Gabriel A. Caballero-Robledo, and J. C. Ruiz-Suarez, Phys. Rev. Lett. 102, 170601 (2009).
- [7] P. Melby et al., J. Phys. Condens. Matter 17, S2689 (2005).
- [8] N. Rivas, P. Cordero, D Risso, and R. Soto, New J. Phys. 13, 055018 (2011).
- [9] N. Rivas, S. Ponce, B. Gallet, D. Risso, R. Soto, P. Cordero, and N. Mujica, Phys. Rev. Lett. 106, 088001 (2011).
- [10] G. Castillo, N. Mujica, and R. Soto, Phys. Rev. Lett. 109, 095701 (2012).
- [11] G. Castillo, N, Mujica, and R. Soto Phys. Rev. E 91, 012141 (2015).
- [12] A. Mehta and J.M. Luck, Phys. Rev. Letters 65, 393 (1990); Phys. Rev. E 48, 3988 (1993)
- [13] K. Szymanski and Y. Labaye, Phys. Rev. E 59, 2863 (1999).
- [14] J.J. Barroso, M.V. Carneiro and E.E.N. Macau, Phys. Rev. E 79, 026206 (2009)
- [15] M. Marin, D. Risso and P. Cordero, Journal of Computational Physics 109 306 (1993), P. Cordero, D. Risso and M. Marin, Chaos, Fractals and Solitons 6 95 (1995), M. Marin and P. Cordero, SCS 28th Annual Simulation Symposium (ASS 1995), Phoenix, Arizona, April 1995, pages 288-295, Editors: G. Chiola, A. Ferscha, E. Kortright (IEEE-CS Press), M. Marín and P. Cordero, Comp. Phys. Comm. 92, 214 (1995), M. Marin and P. Cordero, 8th Joint EPS-APS International Conference on Physics Computing, Krakow, Poland, Sept. 1996, pages 315-318, Editors: P. Borcherds, M. Bubak (World Scientific, 1996), P. Cordero and M. Marin, Fourth Granada Lectures in Computational Physics, P.L. Garrido and J. Marro, eds, Springer-Verlag, 1997.
- [16] S. González, D. Risso and R. Soto, Eur.Phys. J. Special Topics 179, 33 (2009).
- [17] C. Cartes, M.G. Clerc and R. Soto, Phys. Rev. E 70, 031302 (2004).