Spectral shift and dephasing of electromagnetically induced transparency in an interacting Rydberg gas
Abstract
We perform spectroscopic measurements of electromagnetically induced transparency (EIT) in a strongly interacting Rydberg gas. We observe a significant spectral shift and attenuation of the transparency resonance due to the presence of interactions between Rydberg atoms. We characterize the attenuation as the result of an effective dephasing, and show that the shift and the dephasing rate increase versus atomic density, probe Rabi frequency, and principal quantum number of Rydberg states. Moreover, we find that the spectral shift is reduced if the size of a Gaussian atomic cloud is increased, and that the dephasing rate increases with the EIT pulse duration at large parameter regime. We simulate our experiment with a semi-analytical model, which yields results in good agreement with our experimental data.
pacs:
42.50.Gy,32.80.Ee,32.80.RmI Introduction
Atomic systems driven in the configuration of electromagnetically induced transparency involving a Rydberg state (Rydberg EIT) Fleischhauer et al. (2005) are promising systems for the investigation of quantum nonlinear optics Mohapatra et al. (2008); Pritchard et al. (2010) and quantum many-body physics (Löw et al., 2012; Weimer et al., 2010; Schauß et al., 2012; Labuhn et al., 2016) with strong interactions and correlations. With Rydberg EIT, non-linearity at the single photon level has been demonstrated with the remarkable realizations of photon filters, deterministic single photon sources, and interaction between pairs of photons (Dudin and Kuzmich, 2012; Peyronel et al., 2012; Firstenberg et al., 2013), and also been utilized to implement single-photon transistors (Gorniaczyk et al., 2014; Tiarks et al., 2014). Moreover, the recent demonstration of interaction enhanced absorption imaging (IEAI) (Günter et al., 2012, 2013) confirms the great potential of Rydberg EIT for the study of many-body physics with Rydberg atoms.
In Rydberg EIT, highly correlated many-body atomic states arising from the interaction-induced blockade Jaksch et al. (2000); Tong et al. (2004); Vogt et al. (2006); Heidemann et al. (2007) result in strong nonlinear optical response, and can be mapped onto the probe field propagating through the medium. Thus detailed studies on the spectral, temporal, and spatial properties of the transmitted probe light are crucial for proper understanding of such systems and their further applications in quantum optics, quantum information, and quantum many-body physics. Because of the large parameter space and complex dynamics of Rydberg EIT ensembles in the blockade regime, many questions remain open in spite of significant investigation efforts, both experimental Weatherill et al. (2008); Pritchard et al. (2010); Schempp et al. (2010); Sevinçli et al. (2011a); Raitzsch et al. (2009); Baluktsian et al. (2013); Zhang et al. (2014); DeSalvo et al. (2016) and theoretical Weimer et al. (2008); Petrosyan et al. (2011); Ates et al. (2011); Sevinçli et al. (2011b, a); Heeg et al. (2012); Gärttner et al. (2012); Petrosyan et al. (2013); Gärttner et al. (2014). All of Rydberg EIT experiments in the blockade regime have observed the reduction of the EIT transparency at the probe resonance due to Rydberg blockade induced dissipation, also called photon blockade Gorshkov et al. (2011). However, the spectral shift of the transparency resonance, as predicted by several theoretical models, has only been observed in two experiments Carr et al. (2013); DeSalvo et al. (2016), but remains elusive in others. Theoretical calculations, while succeeding to describe certain experimental observations, have yet converged to a comprehensive physical picture due to the challenges posted by strong correlation and dissipation in such systems.
In this article, we present a study of the Rydberg EIT spectra in presence of interaction and their dependence on atomic density, input probe light intensity, and principal quantum number of Rydberg states. We show that all the features of the spectra can be quantified phenomenologically via an effective shift and an effective dephasing rate in the optical Bloch equations describing the evolution of non interacting atoms driven under conditions of Rydberg EIT, as in reference Raitzsch et al. (2009). Our experimental data are in good agreement with a semi-analytical model based on previous results obtained from the Monte Carlo rate equations approach Ates et al. (2011) and the superatom model Petrosyan et al. (2011). We find that the spectral shift is accurately accounted for by an average energy level shift due to the interaction between Rydberg atoms, while the effective dephasing rate mainly comes from the photon blockade effect and dephasing inherent to the dispersion of Rydberg energy level shifts. The dephasing rate increases with the EIT pulse duration at large parameter regime and deviates from the model because of the presence of additional dephasing mechanisms. Finally, we demonstrate that as the size of a Gaussian atomic cloud is increased, the measured spectral shift is reduced. This study provides important experimental evidences to advance the understanding on the spectral properties of Rydberg EIT.
II Experiment
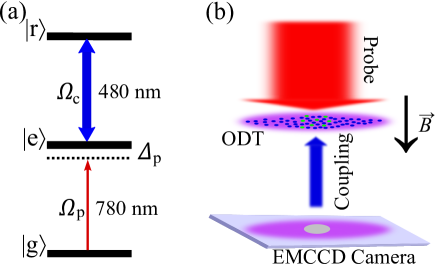
The experiment was performed with a 87Rb atomic cloud released from a horizontally positioned single-beam optical dipole trap (ODT), which was formed by a 1064 nm laser beam with a power of 3.1 W and a Gaussian radius of 42.6 . Atoms were loaded into the ODT from a molasses cooled atomic ensemble, the preparation of which was detailed in Ref.Han et al. (2015). Subsequently, a guiding field of approximately 3.5 Gauss along the vertical direction pointing downwards was switched on to define the quantization axis , and the atoms in the ODT were optically pumped into the () state. At this stage, the atomic cloud had a temperature in the range 20 to K. The atomic cloud was then released for a time of flight (TOF) before the spectroscopic measurement. By changing the ODT loading efficiency and/or the TOF duration, the peak atomic density of the ground state , , and the radius of the cloud along the vertical direction, , could be varied independently in the ranges of and , respectively.
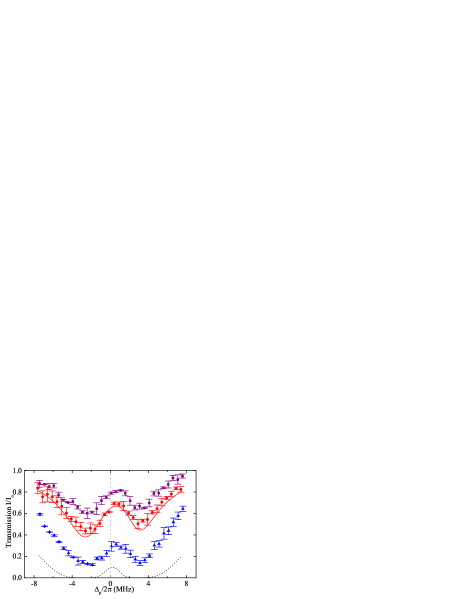
Shown in Fig. 1 are the schematics of the energy levels and the optical setup for Rydberg EIT, the details of which are similar to that in Ref.Han et al. (2015). At each experimental cycle after TOF of the atomic cloud, the probe and coupling beams were turned on simultaneously for 15 s during which an EMCCD camera was exposed to acquire the image of the probe beam transmitted through the atomic cloud via a diffraction limited optical system. To obtain an EIT transmission spectrum, a set of images of the transmitted probe light were taken while varying the probe beam detuning from shot to shot to scan through the resonance of the transition but fixing the coupling beam frequency to be on resonance with the transition. The probe transmission () was extracted by taking the ratio between the probe intensity passing through the center of the coupling beam (with Rabi frequency ) and that of the incoming probe beam without atomic cloud (), and plotted vs. to get the transmission spectra in Fig. 2.
III Results and discussion
In EIT of a non-interacting gas, the linear susceptibility for the probe light at the first order is given by Fleischhauer et al. (2005)
| (1) |
where is the wavelength of the probe transition, is the resonant cross-section of the probe transition, MHz is the decay rate of intermediate state , and are the detunings of the probe and coupling lights, and finally and are the decay rates of atomic coherences. As the atomic sample in this experiment is rather thin along the beam propagation direction , lensing can be neglected Han et al. (2015), and the spatial dependent terms in Eq. (1) are reduced to a constant and one-dimensional functions and . As the incoming probe light of Rabi frequency propagates through the atomic sample, the solution of the one-dimensional Maxwell’s equation gives the transmission
| (2) |
where is the wavenumber of the probe light and corresponds to the optical density of the atomic cloud at the first order.
In an interacting Rydberg gas, the single-atom Rydberg energy level is shifted by the strong interaction, which for state in our experiment is the repulsive van der Waals interaction , where the strength coefficient scales as Singer et al. (2005). One of the most important consequences of this energy level shift is the blockade effect that allows only one Rydberg excitation among many atoms within a sphere of radius . The interaction induced level shift and excitation blockade greatly modify the susceptibility of the EIT ensemble. The linear susceptibility in Eq. (1) is now changed to a nonlocal nonlinear susceptibility, which in principle is given by the solution of a full master equation of the interacting many-body system, and this change is reflected in the EIT transmission spectra. In a simple and intuitive physical picture, the shifted Rydberg energy level detunes the transparency away from that of the non-interacting EIT resonance, and the blockade effect results in scattering around each blockaded sphere, which gives rise to additional decoherence compared to that of the single-atom EIT. The resulting spectral shift and attenuation of the transparency peak depend on the interaction strength , the density of blockaded spheres (Rydberg excitations) , and the number of atoms inside each blockaded sphere .
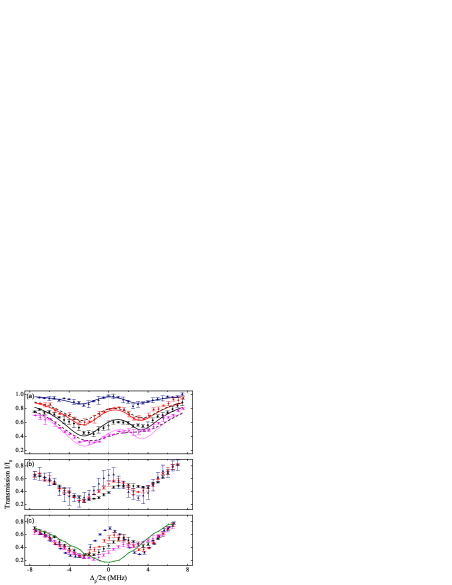
A set of values around the middle of our experimental parameter range, , , , , , gives the blockade radius = 2.4 m, the atom number per unit blockaded sphere , and the Rydberg atom density , where is the on resonance single atom EIT linewidth Peyronel et al. (2012) and is the Rydberg excitation fraction. This indicates that the Rydberg EIT system in our experiment goes into the blockade regime of this interacting many-body system. In the three sets of transmission spectra in Fig. 2, there is an increasing blue shift of transparency away from the single atom EIT resonance () as well as an increasing width and reduced height of the transparency, when the ground state atomic density , the incoming probe Rabi frequency , or the principal quantum number are increased.
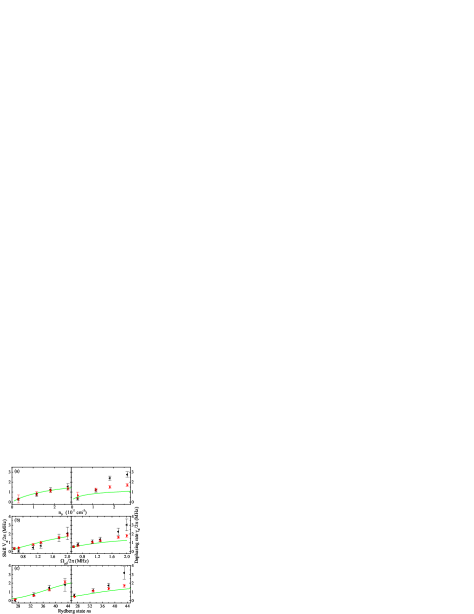
In order to quantify the spectral shift and the attenuation of the transparency peak, we fit the experimental EIT transmission spectra to Eq. (2) with , and as the fitting parameters. While experimentally the coupling light frequency is always on the resonance of the single-atom transition , is set to be a fitting parameter to account for the shift due to Rydberg interactions. The effective dephasing rate is also set to be a fitting parameter, and it accounts mostly for a reduction of the transparency peak with exponential dependence in conditions of relatively large Fleischhauer et al. (2005). The effective dephasing with rate includes the decay of atomic coherence for the single-atom Rydberg EIT, which has a rate of kHz in our experiment Han et al. (2015), the effect of the photon blockade, and other dephasing processes, such as the dephasing inherent to the dispersion of the shifted Rydberg energy levels due to interaction. The result of the fits captures essentially all the features of the spectra, as illustrated in Fig. 2 (a) with a couple sample fittings. As shown in Fig. 3, the extracted shift and dephasing rate are increasing with , , and , and their amplitudes are of the same order.
In order to get a deeper insight on the different contributions to the effective dephasing rate, we simulate our experimental transmission spectra with an approximate nonlinear susceptibility Petrosyan et al. (2011); Gärttner et al. (2014),
| (3) |
where is the fraction of atoms inside the blockaded spheres excluding Rydberg atoms and every physical quantity in the equation is a function of . The first term is proportional to the average three-level susceptibility of atoms inside the blockaded spheres . In this integral and as detailed in Appendix A, is the three-level atom susceptibility calculated from the steady state solution of the single atom master equation, computed at fourth order in for and . The blockade radius is defined as the distance at which , where is the Rydberg population obtained from the single atom master equation at given detuning , and finally is the volume of the blockaded sphere. Because of the very large interaction with the Rydberg atom at the center of the blockade sphere, is nearly equal to the two-level atom susceptibility , and therefore attributes mostly to photon blockade. in the second term of Eq. (3) is the susceptibility of unblockaded atoms (including Rydberg excitations themselves) more than distance from any (other) Rydberg excitations. Since the unblockaded atoms could be excited to interact with other Rydberg excitations, is the susceptibility of three-level Rydberg EIT with the shifted energy level, where accounts for the average energy level shift due to interactions with surrounding Rydberg atoms, while accounts for the standard deviation of the level shift from the mean value .111We assume that the bandwidth of energy level shifts is of the order of . The effect of this bandwidth is simulated with a dephasing term in , following an approach very similar to that used in optical Bloch equations for the treatment of non-zero laser linewidths Gea-Banacloche et al. (1995), although here the bandwidth of the distribution of energy level shifts is not strictly speaking of Lorentzian type. and are evaluated with a simple mean-field approach Weimer et al. (2008); DeSalvo et al. (2016), where the average shift felt by an atom is the sum over the interactions with all Rydberg excitations outside a sphere of radius , , and the variance of this average shift is given by . At each spatial position , and are calculated222Correlations in position between Rydberg excitations are neglected in this evaluation of the variance of energy level shifts. by replacing the sum with an integral and using the local density approximation (LDA) for and , which yields:
| (4) |
and
| (5) |
Here the excitation fraction in the blockade regime is given in good approximation by Gärttner et al. (2014); Petrosyan et al. (2013), where is the Rydberg population fraction of the non-interacting Rydberg EIT.
The simulated EIT spectra are produced by numerically solving the Maxwell’s equation with the approximate susceptibility in Eq. (3) and the experimental parameters as inputs, without any fitting parameter. They agree reasonably well with the experimental spectra, as shown by the samples in Fig. 2 (a). The shift and dephasing rate of these simulated spectra are extracted by fitting to Eq. (2) as in the case of experimental spectra, and plotted along with the experimental results in Fig. 3. The spectral shifts are definitely well captured by our model, and the dephasing rates deviate only at large , , or .
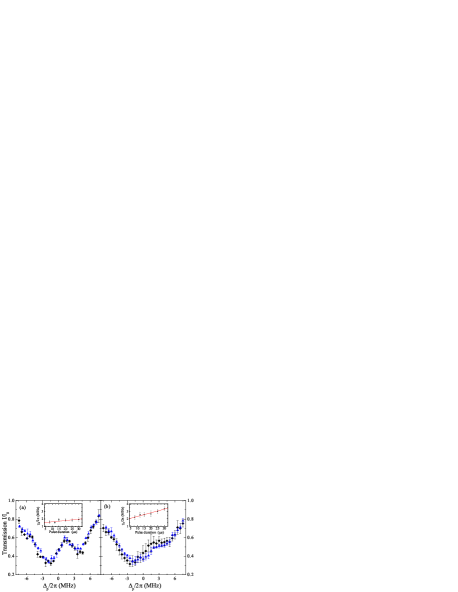
To further investigate the additional dephasing rates that are not included in our model, we perform spectroscopic measurements with different EIT pulse durations for two principal quantum numbers, as shown in Fig. 4. The dephasing rate becomes larger with increasing pulse duration, while the spectral shift remains the same. More measurements show that the time-dependent dephasing effect only becomes important at large parameter regimes, where our model deviates from the experimental data. One potential explanation is the presence of motional dephasing in our system, which could come from thermal motion of ground state atoms, photon recoil motion, and most likely dipole force induced motion Baur et al. (2014).
An important experimental observation is that the spectral shift is smaller for a Gaussian atomic sample with larger size than for a smaller size one, while both have the same peak atomic density, as shown in Fig. 5. This reduction in the observed shift can be explained by the inhomogeneity of the EIT ensemble together with the dependence shown in Fig. 3. As the probe light enters the atomic sample, it first sees the lower atomic density at the wing part of the Gaussian density profile; and when the light reaches the center of the sample with the high atomic density, its intensity has already been attenuated due to scattering along its way. Given the similar peak atomic density, this effect of inhomogeneity in a thicker atomic sample obviously is more pronounced than that in a thinner one, and correspondingly results in smaller spectral shift.
IV Conclusion
In conclusion, we have measured the spectral shift and dephasing rate of Rydberg EIT and clearly mapped out their dependence on density, probe Rabi frequency, and Rydberg principal quantum number. While the spectral shifts agree very well with theoretical predictions obtained in the frozen gas approximation over the whole parameter range, the dephasing rates are consistently larger than predicted at high Rydberg excitation or large blockade. This discrepancy is likely due to motional dephasing and invites further investigations. Furthermore, we demonstrate that the observed spectral shift also depends on the size of the Gaussian atomic sample. This clear observation of spectral shift raises the prospect to realize interaction induced optical switches, and these spectroscopic measurements are highly relevant for imaging Rydberg excitations via IEAI based on Rydberg EIT. Moreover, it would be interesting to extend our experiment into the parameter regime, where collective excitations could give a Rydberg excitation fraction higher than that of a noninteracting Rydberg gas Gärttner et al. (2014).
Acknowledgements.
The authors thank Benoît Grémaud for helpful discussions. The authors acknowledge the support by the National Research Foundation, Prime Ministers Office, Singapore and the Ministry of Education, Singapore under the Research Centres of Excellence programme. This work is partly supported by Singapore Ministry of Education Academic Research Fund Tier 2 (Grant No. MOE2015-T2-1-085).Appendix A
The susceptibility for the probe light, obtained from the optical Bloch equations for three-level non-interacting atoms driven in configuration of EIT, is given by Steck (2006)
| (6) |
where is the dipole matrix element for the transition, is the atomic density, is defined as the Rabi frequency of the circular probe field , and is the atomic coherence of the transition. is given by the solution of the Markovian master equation , where
and
Here, and are the probe and the two-photon detunings, respectively. The decay rate of state is denoted as , while the decay rate of state is neglected. The atomic coherences and decay with a rate which accounts for the sum of various dephasing processes, and is of the order of MHz in absence of interactions Han et al. (2015). The decay rates of other atomic coherences are assumed to be equal to , i. e. they are predominantly determined by dissipation and additional dephasing rates are neglected in comparison.
References
- Fleischhauer et al. (2005) M. Fleischhauer, A. Imamoǧlu, and J. P. Marangos, Rev. Mod. Phys. 77, 633 (2005).
- Mohapatra et al. (2008) A. K. Mohapatra, M. G. Bason, B. Butscher, K. J. Weatherill, and C. S. Adams, Nat. Phys. 4, 890 (2008).
- Pritchard et al. (2010) J. D. Pritchard, D. Maxwell, A. Gauguet, K. J. Weatherill, M. P. A. Jones, and C. S. Adams, Phys. Rev. Lett. 105, 193603 (2010).
- Löw et al. (2012) R. Löw, H. Weimer, J. Nipper, J. B. Balewski, B. Butscher, H. P. Büchler, and T. Pfau, J. Phys. B 45, 113001 (2012).
- Weimer et al. (2010) H. Weimer, M. Müller, I. Lesanovsky, P. Zoller, and H. P. Büchler, Nat. Phys. 6, 382 (2010).
- Schauß et al. (2012) P. Schauß, M. Cheneau, M. Endres, T. Fukuhara, S. Hild, A. Omran, T. Pohl, C. Gross, S. Kuhr, and I. Bloch, Nature 491, 87 (2012).
- Labuhn et al. (2016) H. Labuhn, D. Barredo, S. Ravets, S. de Léséleuc, T. Macrì, T. Lahaye, and A. Browaeys, Nature (London) 534, 667 (2016).
- Dudin and Kuzmich (2012) Y. O. Dudin and A. Kuzmich, Science 336, 887 (2012).
- Peyronel et al. (2012) T. Peyronel, O. Firstenberg, Q.-Y. Liang, S. Hofferberth, A. V. Gorshkov, T. Pohl, M. D. Lukin, and V. Vuletić, Nature 488, 57 (2012).
- Firstenberg et al. (2013) O. Firstenberg, T. Peyronel, Q.-Y. Liang, A. V. Gorshkov, M. D. Lukin, and V. Vuletić, Nature 502, 71 (2013).
- Gorniaczyk et al. (2014) H. Gorniaczyk, C. Tresp, J. Schmidt, H. Fedder, and S. Hofferberth, Phys. Rev. Lett. 113, 053601 (2014).
- Tiarks et al. (2014) D. Tiarks, S. Baur, K. Schneider, S. Dürr, and G. Rempe, Phys. Rev. Lett. 113, 053602 (2014).
- Günter et al. (2012) G. Günter, M. Robert-de Saint-Vincent, H. Schempp, C. S. Hofmann, S. Whitlock, and M. Weidemüller, Phys. Rev. Lett. 108, 013002 (2012).
- Günter et al. (2013) G. Günter, H. Schempp, M. Robert-de Saint-Vincent, V. Gavryusev, S. Helmrich, C. S. Hofmann, S. Whitlock, and M. Weidemüller, Science 342, 954 (2013).
- Jaksch et al. (2000) D. Jaksch, J. I. Cirac, P. Zoller, S. L. Rolston, R. Cote, and M. D. Lukin, Phys. Rev. Lett. 85, 2208 (2000).
- Tong et al. (2004) D. Tong, S. M. Farooqi, J. Stanojevic, S. Krishnan, Y. P. Zhang, R. Côté, E. E. Eyler, and P. L. Gould, Phys. Rev. Lett. 93, 063001 (2004).
- Vogt et al. (2006) T. Vogt, M. Viteau, J. Zhao, A. Chotia, D. Comparat, and P. Pillet, Phys. Rev. Lett. 97, 083003 (2006).
- Heidemann et al. (2007) R. Heidemann, U. Raitzsch, V. Bendkowsky, B. Butscher, R. Löw, L. Santos, and T. Pfau, Phys. Rev. Lett. 99, 163601 (2007).
- Weatherill et al. (2008) K. J. Weatherill, J. D. Pritchard, R. P. Abel, M. G. Bason, A. K. Mohapatra, and C. S. Adams, J. Phys. B 41, 201002 (2008).
- Schempp et al. (2010) H. Schempp, G. Günter, C. S. Hofmann, C. Giese, S. D. Saliba, B. D. DePaola, T. Amthor, M. Weidemüller, S. Sevinçli, and T. Pohl, Phys. Rev. Lett. 104, 173602 (2010).
- Sevinçli et al. (2011a) S. Sevinçli, C. Ates, T. Pohl, H. Schempp, C. S. Hofmann, G. Günter, T. Amthor, M. Weidemüller, J. D. Pritchard, D. Maxwell, et al., Journal of Physics B: Atomic, Molecular and Optical Physics 44, 184018 (2011a).
- Raitzsch et al. (2009) U. Raitzsch, R. Heidemann, H. Weimer, B. Butscher, P. Kollmann, R. Löw, H. Büchler, and T. Pfau, New. J. Phys. 11, 055014 (2009).
- Baluktsian et al. (2013) T. Baluktsian, B. Huber, R. Löw, and T. Pfau, Phys. Rev. Lett. 110, 123001 (2013).
- Zhang et al. (2014) H. Zhang, L. Zhang, L. Wang, S. Bao, J. Zhao, S. Jia, and G. Raithel, Phys. Rev. A 90, 043849 (2014).
- DeSalvo et al. (2016) B. J. DeSalvo, J. A. Aman, C. Gaul, T. Pohl, S. Yoshida, J. Burgdörfer, K. R. A. Hazzard, F. B. Dunning, and T. Killian, Physical Review A 93, 022709 (2016).
- Weimer et al. (2008) H. Weimer, R. Löw, T. Pfau, and H. P. Büchler, Phys. Rev. Lett. 101, 250601 (2008).
- Petrosyan et al. (2011) D. Petrosyan, J. Otterbach, and M. Fleischhauer, Phys. Rev. Lett. 107, 213601 (2011).
- Ates et al. (2011) C. Ates, S. Sevinçli, and T. Pohl, Phys. Rev. A 83, 041802 (2011).
- Sevinçli et al. (2011b) S. Sevinçli, N. Henkel, C. Ates, and T. Pohl, Phys. Rev. Lett. 107, 153001 (2011b).
- Heeg et al. (2012) K. P. Heeg, M. Gärttner, and J. Evers, Phys. Rev. A 86, 063421 (2012).
- Gärttner et al. (2012) M. Gärttner, K. P. Heeg, T. Gasenzer, and J. Evers, Phys. Rev. A 86, 033422 (2012).
- Petrosyan et al. (2013) D. Petrosyan, M. Höning, and M. Fleischhauer, Phys. Rev. A 87, 053414 (2013).
- Gärttner et al. (2014) M. Gärttner, S. Whitlock, D. W. Schönleber, and J. Evers, Phys. Rev. A 89, 063407 (2014).
- Gorshkov et al. (2011) A. V. Gorshkov, J. Otterbach, M. Fleischhauer, T. Pohl, and M. D. Lukin, Phys. Rev. Lett. 107, 133602 (2011).
- Carr et al. (2013) C. Carr, R. Ritter, C. G. Wade, C. S. Adams, and K. J. Weatherill, Phys. Rev. Lett. 111, 113901 (2013).
- Han et al. (2015) J. Han, T. Vogt, M. Manjappa, R. Guo, M. Kiffner, and W. Li, Phys. Rev. A 92, 063824 (2015).
- Singer et al. (2005) K. Singer, J. Stanojevic, M. Weidemüller, and R. Côté, Journal of Physics B: Atomic, Molecular and Optical Physics 38, S295 (2005).
- Gea-Banacloche et al. (1995) J. Gea-Banacloche, Y.-q. Li, S.-z. Jin, and M. Xiao, Phys. Rev. A 51, 576 (1995).
- Baur et al. (2014) S. Baur, D. Tiarks, G. Rempe, and S. Dürr, Phys. Rev. Lett. 112, 073901 (2014).
- Gärttner et al. (2014) M. Gärttner, S. Whitlock, D. W. Schönleber, and J. Evers, Phys. Rev. Lett. 113, 233002 (2014).
- Steck (2006) D. A. Steck, Quantum and Atom Optics (2006) available online at http://steck.us/teaching.