The ISLANDS project I: Andromeda XVI, An Extremely Low Mass Galaxy not Quenched by Reionization
Abstract
Based on data aquired in 13 orbits of HST time, we present a detailed evolutionary history of the M31 dSph satellite Andromeda XVI, including its life-time star formation history, the spatial distribution of its stellar populations, and the properties of its variable stars. And XVI is characterized by prolonged star formation activity from the oldest epochs until star formation was quenched 6 Gyr ago, and, notably, only half of the mass in stars of And XVI was in place 10 Gyr ago. And XVI appears to be a low mass galaxy for which the early quenching by either reionization or starburst feedback seems highly unlikely, and thus, is most likely due to an environmental effect (e.g., an interaction), possibly connected to a late infall in the densest regions of the Local Group. Studying the star formation history as a function of galactocentric radius, we detect a mild gradient in the star formation history: the star formation activity between 6 and 8 Gyr ago is significantly stronger in the central regions than in the external regions, although the quenching age appears to be the same, within 1 Gyr. We also report the discovery of 9 RR Lyrae stars, 8 of which belong to And XVI. The RR Lyrae stars allow a new estimate of the distance, = 23.720.09 mag, which is marginally larger than previous estimates based on the tip of the red giant branch.
Subject headings:
galaxies: dwarf — galaxies: Local Group — galaxies: individual (Andromeda XVI) — galaxies: evolution — stars: variables: RR Lyrae1. Introduction
Nearby resolved dwarf galaxies in the Local Group (LG) constitute a compelling sample to address fundamental open questions about galaxy evolution. The variety of properties in terms of mass, luminosity, surface brightness, gas content, chemical evolution (e.g. McConnachie, 2012), together with the possibility to resolve them into individual stars, offer a large number of observables to investigate how small systems evolved since their formation to the present time. In particular, the ability to derive quantitative star formation histories (SFH) based on deep photometry reaching below the oldest main sequence Turn-Off (TO, Gallart et al., 2005) allows us to put firm constraints on the time of the onset and of the end of star formation, which opens the possibility to constrain the physical mechanisms directly affecting the early stages of dwarf galaxy evolution. On the one hand, it is expected that both internal (supernova feedback, e.g., Mac Low & Ferrara 1999) and external mechanisms (e.g., ionizing photons from the first sources; Ricotti & Gnedin 2005; Susa & Umemura 2004) affect the star formation activity, terminating it at an early epoch. On the other hand, the environment is also expected to play a significant rôle on small systems orbiting massive primaries (tidal stirring: Mayer et al. 2001; ram pressure: Mayer et al. 2006; resonances: D’Onghia et al. 2009), which may have a substantial effect in stripping mass from small systems, again leading to an early cessation of the star formation.
In a series of papers, based on deep HST/ACS photometry within the framework of the LCID collaboration (Monelli et al., 2010a, b; Hidalgo et al., 2011; Skillman et al., 2014), we have shown that star formation generally continues well past in the mass regime . However, during the last ten years, our knowledge of the LG has been deeply influenced by photometric surveys that have brought about unexpected discoveries and new questions. First, the number of known LG galaxies has more than doubled in a few years only. Starting with the discovery of the first faint dwarf (also called “ultra-faint dwarfs”, Willman et al., 2006) the known satellites of the Milky Way (MW) jumped from 11 (9 bright dSph plus the Magellanic Clouds) to 37 today. These faint dwarfs extend the spectrum of galactic properties to a regime of very low mass, low luminosity, and typically low mean metallicity. They are thought to have formed stars very early on and for a very short period of time (Brown et al., 2014), possibly because cosmic reionization might have inhibited further star formation in this low mass regime.
All currently known Local Group faint dwarfs fit well within this general trend, apart from one exception. Leo T, discovered as a stellar over-density in the Sloan Data Release 5, immediately presented a peculiar combination of low mass (, Ryan-Weber et al. 2008) and young stellar populations ( 200 Myr, Irwin et al. 2007), together with a large fraction of HI gas (Ryan-Weber et al., 2008). Deeper HST data confirmed the extended star formation activity from the oldest epochs to the present day (Clementini et al. 2012; Weisz et al. 2012, see also de Jong et al. 2008), which revives the question of whether cosmic reionization is the actual cause of thee star formation quenching in the faintest dwarfs. Remarkably, two more galaxies recently discovered have stellar mass smaller than that of Leo T but their CMD show hints of extended star formation until intermediate epoch: Eridanus II (Koposov et al., 2015; The DES Collaboration et al., 2015) and Hydra II (Martin et al., 2015), detected in the Dark Energy Survey and in the Survey for the MAgellanic Stellar History footprints.
Similarly to what occurred in the MW, the number of known satellites of M31 has increased considerably in the last few years (Martin et al., 2009; Richardson et al., 2011; Slater et al., 2011; Bell et al., 2011; Martin et al., 2013a, b). This was mainly thanks to the effort of the PAndAS project (McConnachie et al., 2009). The discovery of And XVI was reported in Ibata et al. (2007), from MegaCam/CFHT observations of the M31 surroundings that later would be folded in the PAndAS survey (McConnachie et al., 2009). And XVI is located kpc from M31 in the south-east direction. The initial estimate of its luminosity ( = -9.2 mag, Ibata et al., 2007) suggested a relatively bright object. However, more recent estimates (Martin et al. 2016, submitted) revised this value to a significantly fainter value, = –7.6 mag. First estimates based on the tip of the red giant branch (RGB) indicated a distance ()0=23.600.2 mag, corresponding to 52550 kpc, though smaller values have been suggested (23.39, Conn et al., 2012). Spectroscopic follow-up supports a low mean metallicity, close to [Fe/H] = –2 (Letarte et al., 2009; Collins et al., 2014, 2015). However, the most distinctive characteristic of And XVI is its extended SFH, which continued to 6 Gyr ago (Weisz et al., 2014). The present work is part of the ISLAND project (Initial Star-formation and Lives of the ANDromeda Satellites), which obtained a total of 111 HST orbits to study six satellites of M31 (GO 13028, 13739): And I, And II, And III, And XV, And XVI, and And XXVIII. In this paper we present a detailed reanalysis of the data from Weisz et al. (2014), adding information on the properties of the variable stars population and on the spatial variation of the stellar populations. In particular, §2 presents a brief summary of the ACS data used in this work and a detailed presentation of the And XVI CMD. In §3 we present the discovery and analysis of RR Lyrae (RRL) stars, and we derive a new distance for And XVI in §4. §5 is devoted to the derivation of the detailed SFH, while §6 presents an analysis of the variation of the properties of And XVI as a function of radius, both in terms of SFH and CMD morphology. The discussion of these results (§7) and a summary of the conclusions (§8) close the paper.
| Image Name | Filter | Exp. time | Date | MJD |
|---|---|---|---|---|
| (UT start) | d-2,400,000 | |||
| jc1d09upq | 1,280 | 2013 Nov 20 12:46:13 | 56616.545139 | |
| jc1d09urq | 987 | 2013 Nov 20 13:10:30 | 56616.560301 | |
| jc1d09uuq | 1,100 | 2013 Nov 20 14:13:37 | 56616.604792 | |
| jc1d09uyq | 1,359 | 2013 Nov 20 14:34:55 | 56616.621076 | |
| jc1d10wdq | 1,280 | 2013 Nov 20 23:55:40 | 56617.010037 | |
| jc1d10wfq | 987 | 2013 Nov 21 00:19:57 | 56617.025199 | |
| jc1d10xaq | 1,100 | 2013 Nov 21 01:23:05 | 56617.069701 | |
| jc1d10xeq | 1,359 | 2013 Nov 21 01:44:23 | 56617.085986 | |
| jc1d11ywq | 1,280 | 2013 Nov 21 09:29:27 | 56617.408499 | |
| jc1d11yyq | 987 | 2013 Nov 21 09:53:45 | 56617.423673 | |
| jc1d11z1q | 1,100 | 2013 Nov 21 10:56:55 | 56617.468199 | |
| jc1d11z5q | 1,359 | 2013 Nov 21 11:18:13 | 56617.484483 | |
| jc1d12a2q | 1,280 | 2013 Nov 21 15:52:01 | 56617.674172 | |
| jc1d12a5q | 987 | 2013 Nov 21 16:16:18 | 56617.689334 | |
| jc1d12a9q | 1,100 | 2013 Nov 21 17:23:30 | 56617.736660 | |
| jc1d12zzq | 1,359 | 2013 Nov 21 17:44:48 | 56617.752522 | |
| jc1d13b9q | 1,280 | 2013 Nov 21 23:50:12 | 56618.006245 | |
| jc1d13bbq | 987 | 2013 Nov 22 00:14:29 | 56618.021407 | |
| jc1d13caq | 1,100 | 2013 Nov 22 01:17:39 | 56618.065933 | |
| jc1d13ceq | 1,359 | 2013 Nov 22 01:38:57 | 56618.082218 | |
| jc1d14f2q | 1,280 | 2013 Nov 22 10:59:39 | 56618.471143 | |
| jc1d14f4q | 987 | 2013 Nov 22 11:23:56 | 56618.485872 | |
| jc1d14f7q | 1,100 | 2013 Nov 22 12:27:08 | 56618.530854 | |
| jc1d14fbq | 1,359 | 2013 Nov 22 12:48:26 | 56618.547139 | |
| jc1d14feq | 1,360 | 2013 Nov 22 14:02:46 | 56618.598771 | |
| jc1d14fiq | 1,100 | 2013 Nov 22 14:28:23 | 56618.615056 |
2. Data
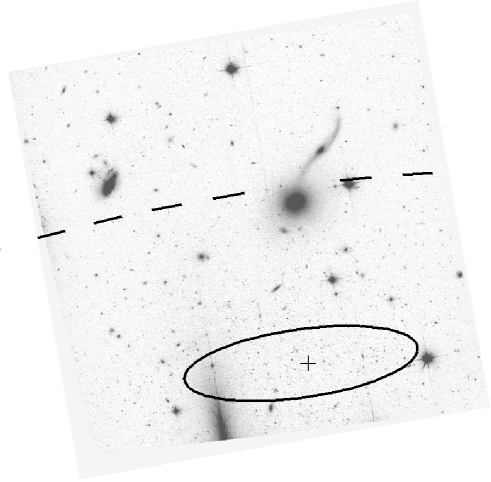
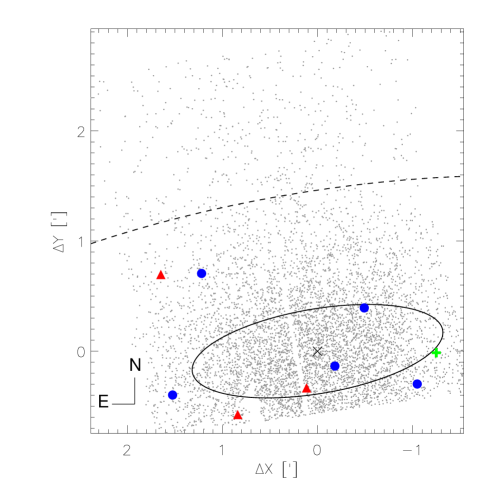
The data set used here is the same presented in Weisz et al. (2014), and consists of 13 ACS images in each the and passbands. Parallel photometric reductions were conducted using both DOLPHOT and DAOPHOT/ALLFRAME as was done for the LCID project (e.g., Monelli et al., 2010b). Here we have chosen to use the DAOPHOT/ALLFRAME photometry as a matter of convenience. The calibration to the standard VEGAMAG system was done adopting the updated zero point from the instrument web page. Figure 1 shows a stacked drizzled image, where a large number of background extended objects is evident. In particular, note the edge-on galaxy apparently interacting with the big elliptical to the West, and the group of late-type galaxies in the North-East. The two ellipses correspond to elliptical radii =1.38, and 5.00, and will be used in §6 to investigate the radial properties. Figure 2 shows the spatial distribution of the sources in the final catalog. Big colored symbols mark the position of the 9 discovered RRL stars (see §3.1).
2.1. CMD analysis
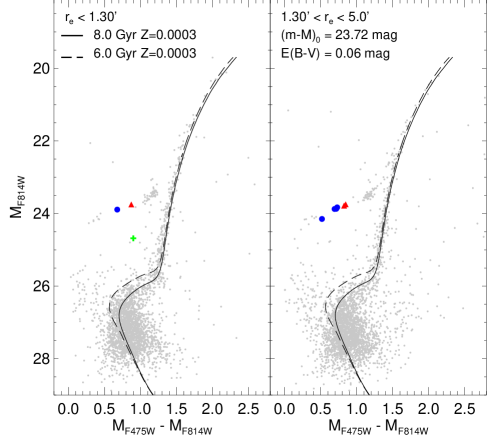
Figure 3 shows the (, ) CMD of And XVI. In the construction of Figure 3 we adopted a reddening of E(-)=0.06 (Schlafly & Finkbeiner, 2011) and a distance modulus of 23.72 mag. The latter value has been derived from the RRL stars, as detailed in §4.1. The RRLs discovered in And XVI are plotted as large symbols and will be discussed in §3.
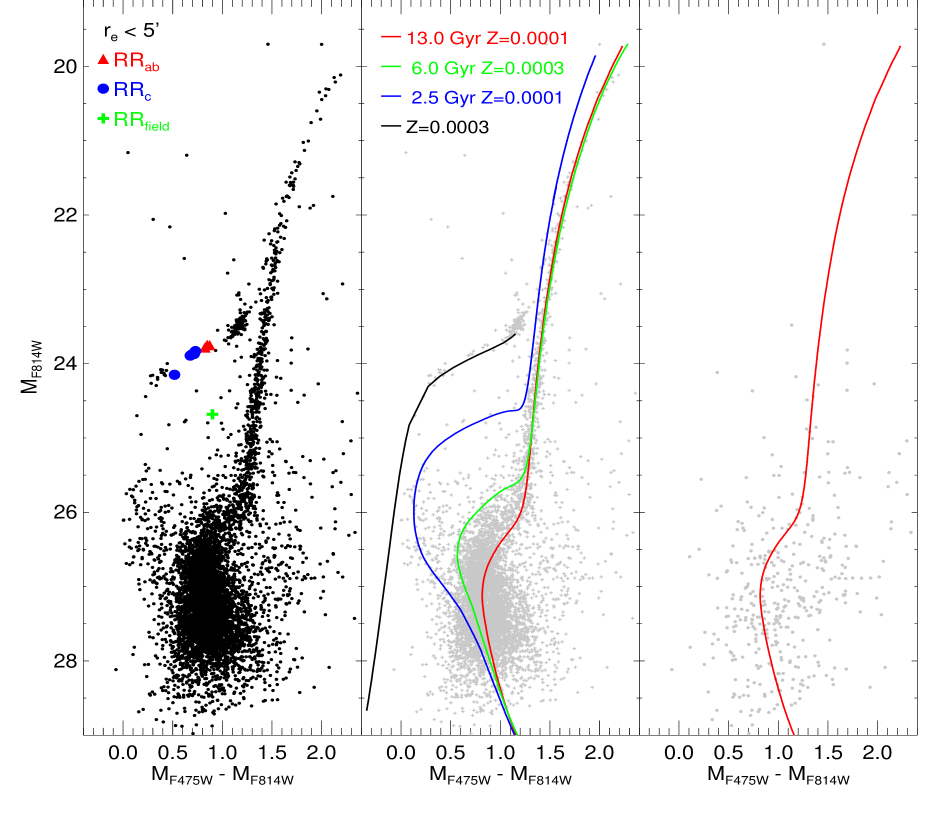
A photometric selection was applied according to the sharpness parameter provided by DAOPHOT ( 0.3). Given the small number of And XVI stars, and the heavy contamination from background galaxies, we performed a further check on the stacked image, removing a few hundred sources associated with extended objects and spikes of heavily saturated field stars. Finally, we ended up retaining 5,714 bona-fide stellar sources within the 5.0′ellipse. These are shown in the CMD of the left panel, where the typical features of a predominantly old stellar populations clearly appear. The red giant branch (RGB) spans more than five magnitudes, from the tip at 20 mag down to 25.5. The horizontal branch (HB) has a predominantly red morphology with a well populated red part, concentrated close to (, ) (1.2, 23.5) mag, which is well separated from the RGB, suggesting a limited metallicity spread. On the other extreme, the HB extends to the blue reaching well beyond the RRL instability strip to 0.2 mag. Overall, we derive an HB morphology index0.64111The HB index was introduced by Lee (1990) and it is defined as HBR = (-)/(++), where B and R are the number of HB stars bluer and redder than the instability strip, and V is the total number of RR Lyrae stars..
The central panel of the same figure shows the comparison with selected isochrones from the BaSTI222 http://basti.oa-teramo.inaf.it/index.html stellar evolution library (Pietrinferni et al., 2004, 2009). In particular, the red and green lines represent an old (13 Gyr, Z=0.0001) and an not-too-old-age (6 Gyr, Z=0.0003, Castellani & degl’Innocenti 1995) population. These two isochrones bracket both the RGB and the main sequence Turn-Off region well. Interestingly, this suggests that the stellar populations in And XVI are characterized by a considerable age spread, but a small range of metallicities.
Finally, the right panel presents the sources detected in the outermost region of the field of view, for r 5′. The same old isochone as in the central panel is shown. Roughly 400 sources are present in this diagram, but no obvious features appear. Many of the detected objects present colors redder than the MS stars of And XVI, suggesting that they are unresolved background galaxies. Neverthless, we cannot rule out the possibility that some And XVI stars are still present in this region, which will be anyway excluded from the SFH analysis.
| Name | R.A. | Dec. | type | P | mF475W | AF475W | mF814W | AF814W | mB | AB | mV | AV | mI | AI |
|---|---|---|---|---|---|---|---|---|---|---|---|---|---|---|
| hr min sec | d | mag | mag | mag | mag | mag | mag | mag | mag | mag | mag | |||
| V0 | 00:59:24.38 | 32:22:33.14 | 0.622 | 25.582 | 0.889 | 24.682 | 0.431 | 25.727 | 0.990 | 25.244 | 0.767 | 24.670 | 0.446 | |
| V1 | 00:59:25.33 | 32:22:16.09 | 0.358 | 24.568 | 0.641 | 23.875 | 0.399 | 24.681 | 0.725 | 24.328 | 0.538 | 23.857 | 0.397 | |
| V2 | 00:59:27.97 | 32:22:57.56 | 0.391 | 24.560 | 0.557 | 23.831 | 0.284 | 24.668 | 0.616 | 24.308 | 0.454 | 23.812 | 0.290 | |
| V3 | 00:59:29.43 | 32:22:25.88 | 0.350 | 24.569 | 0.541 | 23.892 | 0.358 | 24.667 | 0.573 | 24.325 | 0.480 | 23.873 | 0.361 | |
| V4 | 00:59:30.84 | 32:22:13.99 | 0.617 | 24.623 | 0.840 | 23.751 | 0.589 | 24.741 | 0.969 | 24.313 | 0.810 | 23.735 | 0.600 | |
| V5 | 00:59:34.27 | 32:21:59.43 | 0.638 | 24.594 | 1.200 | 23.747 | 0.655 | 24.717 | 1.182 | 24.323 | 0.978 | 23.731 | 0.667 | |
| V6 | 00:59:36.07 | 32:23:16.33 | 0.399 | 24.586 | 0.444 | 23.870 | 0.216 | 24.694 | 0.478 | 24.342 | 0.390 | 23.851 | 0.217 | |
| V7 | 00:59:37.51 | 32:22:10.07 | 0.288 | 24.668 | 0.300 | 24.150 | 0.161 | 24.736 | 0.316 | 24.495 | 0.251 | 24.134 | 0.157 | |
| V8 | 00:59:38.10 | 32:23:15.76 | 0.651 | 24.608 | 0.673 | 23.783 | 0.427 | 24.734 | 0.719 | 24.327 | 0.574 | 23.767 | 0.432 |
2.2. Blue Straggler stars
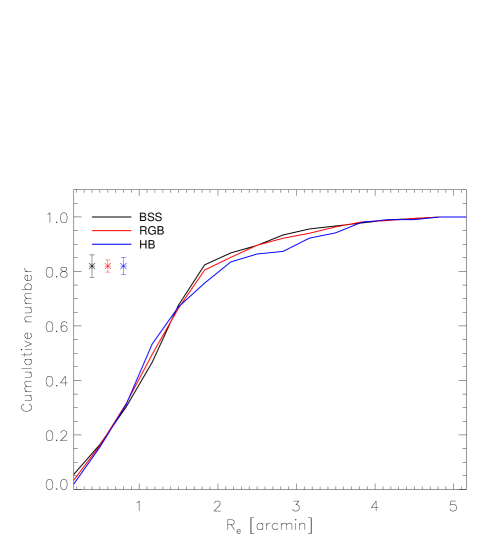
The CMD clearly show a plume of objects bluer and brighter than the old MSTO, between mag and mag. They are most likely Blue Stragglers stars (BSSs) formed by primordial binary stars, as commonly found in many dSph (Mapelli et al., 2007, 2009; Monelli et al., 2012; Santana et al., 2013). On the other hand, stars in that region of the CMD might be genuine young objects, with ages in the range between 1 and 3 Gyr. The blue line in Figure 3 represents a metal-poor isochrone of 2.5 Gyr, which provides a fair agreement with the observed sequence. If And XVI hosted such a young population, one would expect to find it spatially concentrated in the innermost region of the galaxy, as commonly observed in LG dwarfs. Figure 4 shows the cumulative distribution of stars in the blue plume, the RGB and the HB. Within the error, they are identical a a function lf elliptical radius. This indirectly supports the inference that the stars in the blue plume are BSSs and not a young population. The plume of blue objects causes a minor peak in the SFH between 2 and 3 Gyr ago §5.2, which contributed with 3% of the stellar mass. Both the age range and the mass percentage are consistent with those estimated in Cetus and Tucana (Monelli et al., 2012). This again indirectly supports the BSS hypothesis.
3. Variable stars
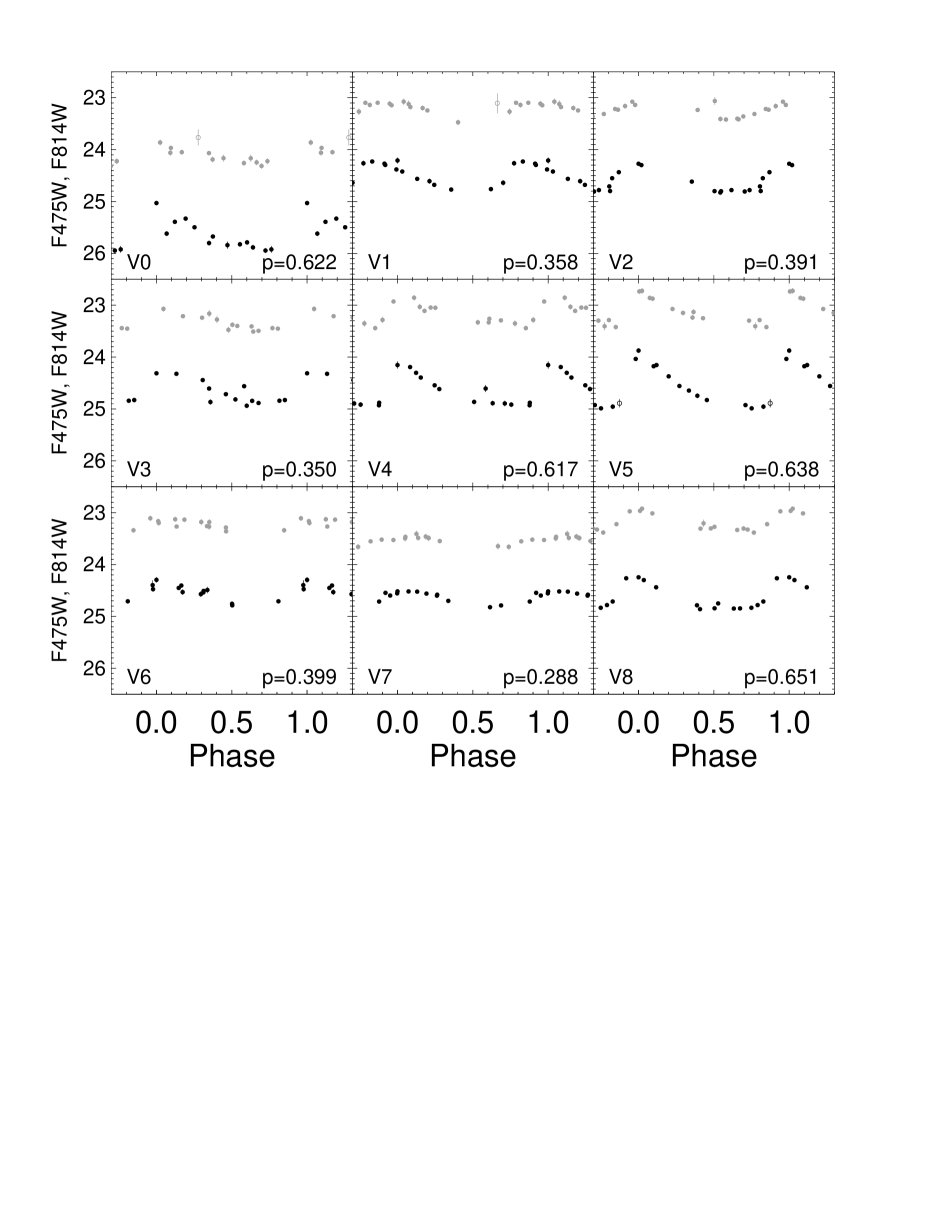
Our observational strategy was designed for optimal time sampling of short period (1 d) variable stars such as RRL and Anomalous Cepheids (ACs). All the observations were executed within 2.1 days, and were organized in six visits, five of two and one of three orbits. Moreover, each orbit was split into one and one exposure, and a sequence --- was observed in each group of two visits. This allowed a larger time difference between the two images at shorter wavelength, where the amplitude is larger. Table 1 reports the observation log, listing the image name, filter, exposure time, starting date of observation and modified Julian date at mid exposure.
3.1. RR Lyrae stars
Candidate variable stars were identified following the same approach adopted for the galaxies of the LCID project (Bernard et al., 2009, 2010, 2013). In particular, we used the variability index introduced by Stetson (1996). The light curves of selected candidates were individually visually inspected, and nine variables were confirmed. Given their pulsational properties and the location on the CMD, we classify all of them as RRL stars. The and magnitudes were re-calibrated to the Johnson system using the same relations adopted in Bernard et al. (2009). Table 2 summarizes the properties of the confirmed variables which are named in order of increasing right ascension. Their position in the CMD is shown in Figure 3: red triangles and blue circles represent RR and RR type stars, respectively. Interestingly, one variable (V0) is significantly fainter (green plus), by 0.8 mag in the band. Figure 5 presents the light curves of the nine variables. Despite the small number of phase points, the time sampling chosen when preparing the observations provides a fairly homogeneous coverage of the light curves. In particular, we do not find any obvious problem with V0 that may account for the fainter magnitude, though the light curve is admittedly noisy. We have checked whether a significantly higher metal content may be responsible for such a lower luminosity. Adopting the luminosity-metallicity relation by Clementini et al. (2003), we derive that an [Fe/H] approximately solar is required to explain such a large magnitude difference. Such a large metallicity spread within the population of stars able to form RRL in And XVI looks unlikely, in particular if we take into account the relatively small range estimated both spectroscopically (Letarte et al., 2009; Tollerud et al., 2012) and with the SFH (see §5.2). Alternatively, we can assume that V0 does not belong to And XVI, and the magnitude difference is due to a distance effect. Assuming a metal content of [Fe/H]=1.9 and the metallicity-luminosity relation from Clementini et al. (2003, see $ 4.1), we derive a distance difference between V0 and the rest of variables of the order of 290 kpc. Given that And XVI is located 200 kpc closer than M31, this means that V0 is compatible with being located 100 Kpc beyond M31, but still well within its virial radius, thus being a possible candidate M31 halo star (Ibata et al., 2014).
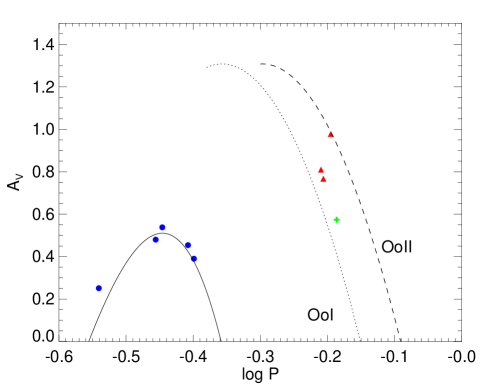
Figure 6 shows the period-amplitude (Bailey) diagram for the detected variable stars. The dotted and dashed lines mark the loci of Oosterhoff I and Oosterhoff II globular clusters, respectively, from Cacciari et al. (2005). The solid line is the locus defined for RR stars, from Kunder et al. (2013). The three And XVI RR stars occupy the region intermediate to the two curves. However, both the mean period of RR stars (=0.636 d) and of the RR type (=0.357 d) are close to the typical values for the Oosterhoff II type stellar systems. Note that the ratio between the number of RR and RR is unusually large (Catelan, 2009), and And XVI is the only dwarf known with more RR than RR. This finding is particularly intriguing given the red morphology of the HB which would favor the sampling of the red part of the instability strip, where the RR are located. However it might be possibly related to the small total number of RRL stars. Alternatively, this effect could be related to the low metallicity of the oldest stars, such as the RR Lyrae stars which would be preferentially located in the blue part of the HB. However, we note that other M31 satellites with similar small number of RRL variables and bluer HB morphology such as And XI and And XIII (Yang & Sarajedini, 2012), the number of RR type is larger than that of RR type (10 vs 5 and 8 vs 1, respectively).
3.2. Anomalous Cepheids
We report that we did not discover any AC in the surveyed area of And XVI. This kind of pulsating variables, present only in metal-poor (Z0.0006 Fiorentino et al., 2006) populations, are centrally He-burning stars typically 1 mag brighter then RRL stars. They can form through two different channels: i) single, evolved stars of mass 1.3 M 2.2 M⊙, therefore younger than 1 Gyr; ii) coalescent binary stars evolved after the BSS phase. Despite the fact that ACs have been observed in many dSph galaxies (Sculptor: Kaluzny et al. 1995; Fornax: Bersier & Wood 2002; Carina: Dall’Ora et al. 2003; Coppola et al. 2013, Draco: Kinemuchi et al. 2008; Cetus and Tucana: Bernard et al. 2009), the non-detection in And XVI is not surprising, and we ascribe it to its low mass. First, the lack of ACs agrees with the lack of recent star formation, thus excluding the first formation channel. Second, the small number of stars populating the blue plume of BSS () implies that very few evolved stars of this population are expected. These, due to their mass, tend to occupy the red part of the HB, at temperatures lower than the instability strip, and few such stars are clearly visible above the red HB, at 23 mag. Finally, adopting the relation between the frequency of ACs and the luminosity of the host galaxy, discovered by Mateo et al. (1995) and updated by Fiorentino & Monelli (2012), we estimate that 11 ACs are expected in the surveyed area, in agreement with the current observations.
4. Distance estimate
4.1. RR Lyrae distance estimate
Pulsational properties of RRL stars can be used to derive a robust estimate of the distance. In the following we will use three different methods. In the analysis, we did not include the faint V0 RRL star.
a) First, we adopt the relation between the intrinsic luminosity, , and the metallicity. In the range below [Fe/H] = –1.6 we assume two linear relations333the and magnitudes were re-calibrated to the Johnson system using the same relations adopted in Bernard et al. (2009):
| (1) |
from Clementini et al. (2003) and
| (2) |
from Bono et al. (2003). We assume a value for the [Fe/H]=2, in agreement with the available spectroscopic measurements (Letarte et al., 2009; Collins et al., 2014, 2015). For the metal content, the Clementini et al. (2003) and the Bono et al. (2003) relations provide absolute magnitude values of = 0.438 and 0.360 mag, respectively. We derive absolute distance moduli for And XVI, corrected for extinction, of = 23.720.09 mag and 23.790.08 mag, respectively, corresponding to 554 and 572 kpc. We note that a change in the metal content by 0.2 dex affects the distance estimates by 0.04 mag
b) It is well established that RRL stars obey a period-luminosity-metallicity relation in the near-infrared, which can be expressed in the form
| (3) |
We adopt here the most updated theoretical relations from Marconi et al. (2015), both for the Wesenheit W(,) and W(,) magnitudes.
We used here the full sample of RRL stars after fundamentalizing the RR type by adding 0.127 to the logarithm of their period. We calculated the Wesenheit apparent magnitudes of each star, and adopting these relations we derived the true distance modulus. Assuming [Fe/H] -2.3 dex (Z 0.0001) the two relations provide = 23.740.03 mag and = 23.770.06 mag, respectively. A slightly larger metallicity, [Fe/H] -1.8 dex (Z 0.0003) shortens the derived distance by few hundredths of magnitude: = 23.680.03 mag and = 23.700.03 mag.
c) An independent method to derive the distance based on the RRL properties was introduced by Caputo et al. (2000) and takes advantage of the period-luminosity-metallicity relation at the first overtone blue edge of the instability strip. Ideally, this method works well if the blue side of the instability strip is well sampled, which is not the case for the current data set. However, the few RR type stars found can provide an upper limit to the distance. Applying the relations from Caputo et al. (2000) to the shortest period star, we derive a distance modulus of 23.83, again assuming [Fe/H]=2.
Overall, these different methods applied to the RRL stars sample of And XVI provide consistent results about its distance. For consistency with previous analysis of isolated galaxies within the framework of the LCID project, we will adopt the distance derived with the -[Fe/H] relation by Clementini et al. (2003), = 23.720.09 mag, to derive the SFH in §5.
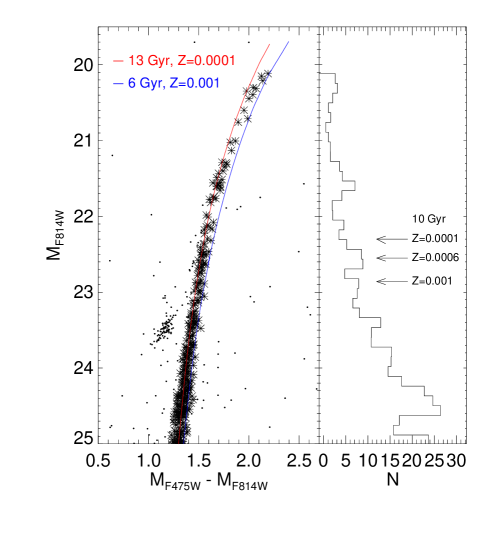
4.2. RGB tip distance estimate
Ibata et al. (2007) estimated the distance of And XVI to be (m-M)0 = 23.60.2 mag (525 Kpc), based on the position of the tip of the RGB. A more recent study by Conn et al. (2012), based on a more sophisticated analysis of the same feature, suggested a slightly shorter distance, (m-M)0 = 23.39 (476 kpc). We note that the distance estimate based on the RRL stars are systematically larger than those based on the tip of the RGB. However, they are is still in agreement, within the error bars, with the value provided by Ibata et al. (2007), and only in marginal agreement at the 2 level with the measurement by Conn et al. (2012) .
Figure 7 summarizes our attempt to derive a distance to And XVI based on tip of the RGB as detected in the ACS data. The left panel shows a zoom of the CMD in the RGB region, and the right one presents the luminosity function of RGB stars in the band. These are highlighted by big asterisks in the left panel. The plot clearly shows that the region of the RGB tip is heavily under-sampled, with only 9 stars detected in the half brightest magnitude. This is far from the at least 50 stars recommended by Madore & Freedman (1995) to derive a distance modulus with 0.1 uncertainty. This is also supported by the comparison with theoretical isochrones (red line: Z=0.0001, t=13 Gyr; blue: Z=0.001, t=6 Gyr). Assuming (m-M)0=23.72 mag (from the RRL estimate, see §4.1), it is evident that the brightest portion of the RGB is devoid of observed stars. Note that a shorter distance modulus would move the isochrones to brighter apparent magnitudes, thus worsening the problem. Given the little contamination from both And XVI AGB and foreground field stars, we can set an upper limit to the distance, assuming that the brightest observed star is representative of the tip. This has magnitude = 20.116 mag. The F814W absolute magnitude of the RGB tip shows a mild dependence on the metallicity in the metal regime appropriate for the stars in And XVI. In more detail, theoretical predictions based on BaSTI stellar models show that is equal to -4.087 at Z=0.0001 and to -4.166 for Z=0.001. When combining these model predictions with an extinction estimate of mag, we obtain a distance modulus upper limit ranging from 24.09 to 24.17 mag, i.e., in the range 657 - 682 Kpc. A visual inspection of the CMD from Ibata et al. (2007) discloses at least one very bright star is missing in our photometry, possibly because it is outside our field of view. This is probably what causes the difference in the derived distance using the same approach. In any case, it is evident that the poor statistics in the RGB star counts are strongly hampering the possibility to use the RGB tip method for a robust distance estimate.
In passing, we note that for the same reason no clear detection of the RGB bump is possible. The luminosity function in the right panel of Figure 7 does not show any clear evidence of the RGB bump. The three overplotted arrows mark the position of the RGB bump derived from theoretical isochrones of 10 Gyr, and metallicity ranging from Z=0.0001 to Z=0.001. We note that an observed peak around 22.5 mag agrees well with the predicted bump for Z=0.0006 and age of 10 Gyr. As the bump positions depends both on the age (fainter bump for increasing age) and the metallicity (fainter bump for increasing metallicity) there is some degree of degeneracy. However, it seems clear that the observed peak cannot be reproduced with very metal-poor populations, as the predicted bump for Z=0.0001 and an age of 10 Gyr is too bright (22.35 mag), and gets brighter for decreasing age, while it gets virtually undetectable for older ages, as the magnitude extension of the loop drops. Similarly, in the case of more metal-rich populations, the predicted bump is too faint, and an age of 6 Gyr is required fit the observed peak (though with a color that is too red).
5. Star formation history
5.1. Star formation history derivation
The SFH was derived using the IAC-star, MinnIAC and IAC-pop codes (Aparicio & Gallart, 2004; Hidalgo et al., 2011; Aparicio & Hidalgo, 2009), in a similar fashion as already presented in previous papers of the LCID project (Monelli et al., 2010a, b; Hidalgo et al., 2011; Skillman et al., 2014). For the present data set, we used a model CMD of 3106 stars with ages and metallicities uniformly distributed in the ranges 0 t 13.5 Gyr and 0.0001 Z 0.0025. Observational errors were simulated taking into account the results of 2106 artificial stars.
IAC-star requires the selection of a number of parameters that are used in the
solution derivation. On the one hand, parameters used to build the model CMD such
as the amount of binary stars and the initial mass function were chosen to be the
same as in previous LCID papers. Namely, we used a 40% binary faction (0.5) and
the Kroupa (2002) IMF (x=1.3 for and x=2.3 for ). To run IAC-pop and MinnIAC, decisions have to be taken concerning the
parametrization of both the age and metallicity bins (that define the
“simple stellar populations”) and that of the CMDs.
The adopted age and metallicity bins were:
age=[0 1 2.5:1:13.5] Gyr
metallicity=[0.0001 0.0003 0.0005 0.0007 0.0010 0.0015 0.0020 0.0025]
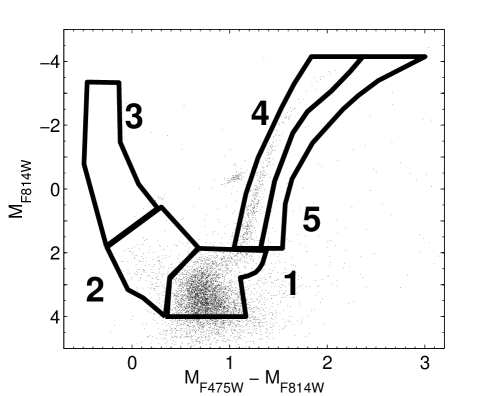
The sampling of the CMD is based on macro-regions, called bundles (see Figure 8). In each bundle, stars are counted in a
regular grid of boxes, whose size is fixed and constant.
The main limit of the current data set is the relatively small number of stars in
the observed CMD, which can introduce noise in the solution if too fine of a sampling
of the CMD is adopted. Therefore, we performed a number of tests to optimize the
bundle and boxe sizes. We found that the final solution is mostly affected by two
factors: i) the sizes of the boxes in bundle 1; ii) the
inclusion of the RGB in bundle 4.
Most of the information on the age of the stellar population comes from the main sequence and TO region. For predominantly old populations as those present in And XVI, most of the information will come from bundle 1. Bundle 3 and bundle 5 are useful to set limits to the youngest populations and the highest metallicity, respectively, while bundle 2 samples the blue plume. In previous works, in order to give more weight to the TO region, we adopt smaller boxes in the corresponding bundle. However, we found that, in comparison with our previous LCID experience, we had to significantly increase the size of individual boxes in this bundle in order to avoid fluctuations and the appearance of spurious populations in the solution. Namely, the box size chosen is (color, magnitude) = (0.04, 0.2) mag, compared to typically (0.02, 0.1) in LCID. Given the little or negligible number of stars, larger boxes are used in bundles 2, 3 and 5. The HB is excluded from the SFH analysis because the details of its morphology depend on highly unknown factors such as the mass loss during the RGB phase, and they are not properly modeled in our synthetic CMD.
The second major difference with the LCID strategy is that including the RGB significantly improves the solution as well. With the LCID galaxies we had demonstrated that, whenever the CMDs are well populated by at least tens of thousands of stars, the inclusion of the RGB has little, if any, effect on the final solution, and typically the increases (Bernard et al., 2012). This is mostly due to the fact that the age is highly degenerate in the RGB, while a bundle such as the current bundle 5 is always useful to set a constraint to the most metal-rich population. In the current analysis, where only few thousand stars are available, we found that the solution strongly benefits from the inclusion of a bundle on the RGB. The main effect is that spurious populations (such as simultaneously very old and very metal-rich ones) disappear from the solution.
5.2. Global star formation history of And XVI
The SFH of And XVI was derived using only stars within 5 from the center. The total number of stars used to derive the SFH are 3985, 202, and 491, in bundles 1,2, 4 respectively. For larger galactocentric distances, the majority of sources are expected to be background unresolved galaxies, Nevertheless, the comparison with theoretical isochrones in Figure 3 suggests that a small fraction of And XVI stars may be present at larger radius. Scaling the number of objects in the outer regions found in the same bundles within 5, we find that an upper limit of 4.5% of contaminating objects may be affecting the star counts, thus not strongly affecting the derived SFH. In particular, since the distribution of the contaminating galaxies in the CMD does not resemble that of a stellar population, we do not expect that they originate any strong features at a specific age in the SFH.
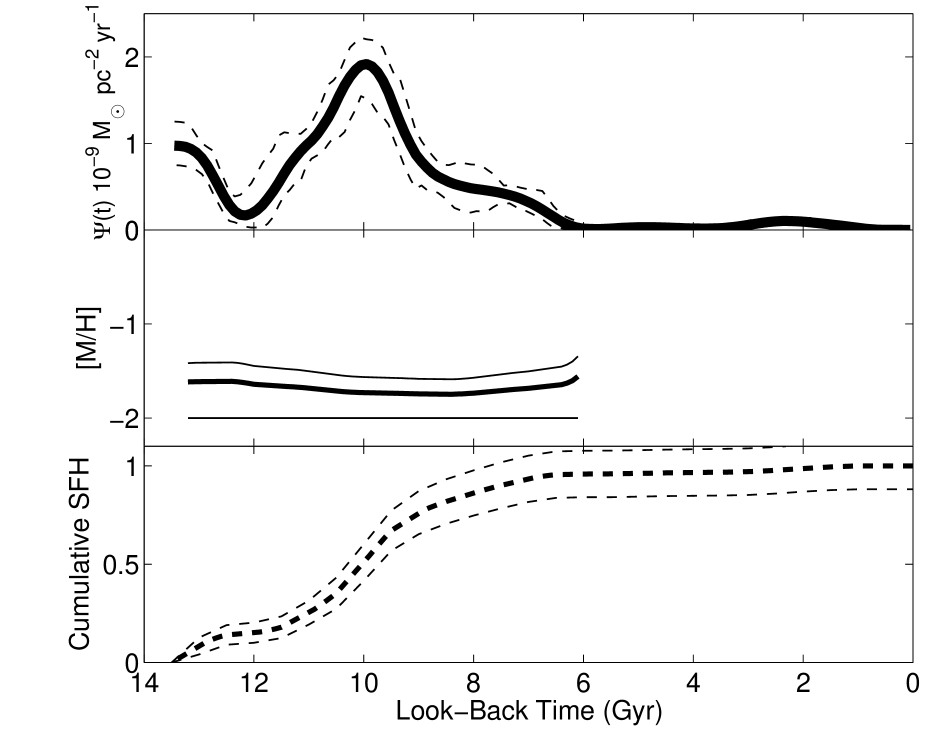
The final solution is presented in Figure 9. The three panels represent, from top to bottom, the star formation rate (SFR), the age-metallicity relation (AMR) and the cumulative SFH as a function of the look-back time. And XVI is populated by both old and intermediate age stars. It started forming stars at the oldest possible epoch. Remarkably, in our SFH solutions, there appears to be a significant very old peak at 13.5 Gy ago, followed by a sudden drop of star formation. After a minimum occurred 12 Gyr ago, star formation increased again and reached its peak 10 Gyr ago. This is an extremely interesting finding, as this feature is not common either among the MW dSph satellites, nor the isolated ones such as Cetus and Tucana. In fact, they typically present one single dominant event of star formation occurred at the oldest epochs (see e.g., Monelli et al., 2010b, c; de Boer et al., 2012b, a). The second distinctive feature we recover, as already found by Weisz et al. (2014), is that the star formation activity extends for many Gyr, vanishing 6 Gyr ago. The blue plume of stars in bundle 2 produces the small peak at 3 Gyr, which we interpret as BSS stars (see $ 2.2). We also recover a fundamentally constant AMR, with metallicity not exceeding [M/H]=1.5 (Z=0.0006), in agreement with the qualitative comparison with theoretical isochrones. further constrain the nature cumulative SFH reveals that 10% of And XVI stellar mass was in place by 6 (12.8 Gyr ago), that is when the reionization epoch concluded, and that And XVI formed 50% of its stellar mass by 2, or 10.10.2 Gyr ago (see Table 3 for the derived integrated and mean quantities).
| Quantity | value |
|---|---|
| (10) | 1.920.03 |
| (10) | 3.60.1 |
| age (Gyr) | 9.90.1 |
| [Fe/H]] 10-4 dex | 4.20.1 |
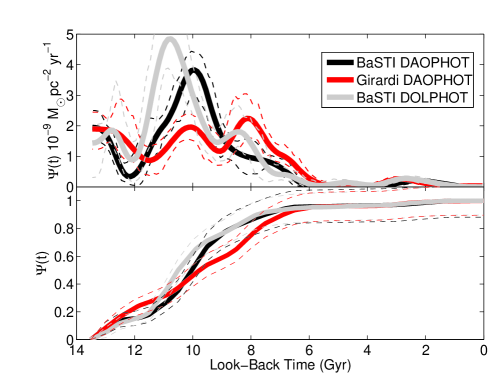
Figure 10 presents a comparison between the SFH recovered using different photometry sets and stellar evolution libraries. In particular, together with the previous DAOPHOT+BaSTI solution (black lines), we show the SFH obtained with DAOPHOT+Girardi (red lines, Girardi et al. 2000) and DOLPHOT+BaSTI (grey lines), The Figure presents both the SFR as a function of time (top panel) as well as the normalized cumulative SFH (bottom). The plots disclose a general very good agreement. In particular, the three solutions confirm the fundamental results that the star formation in And XVI did extend to 6 Gyr ago, and that there is no dominant initial event as in other dSph such as Cetus and Tucana. We exclude that this can be an artifact due to photometric errors, as they are too small to affect the TO morphology causing the age spread, in either photometry. Moreover, the three solutions confirm an initial star formation followed by a less intense activity. In particular, the use of either photometry set together with the BaSTI models provide a minimum at 12 Gyr, while the subsequent maximum is 1 Gyr younger in the DOLPHOT+BaSTI solution than in the DAOPHOT+BaSTI one. Interestingly, while the BaSTI solution provides a strong peak at such ages, the solution based on the Girardi library is characterized by a flatter SFR, though the age of the peaks agrees very well with the BaSTI solutions. The consistency between the three solutions is clear in the bottom panels, where the cumulative SFHs agree at the 1- level.
6. Radial spatial gradient
In this section we investigate how the properties of And XVI change as a function of the distance from its center. First, we note that we do not have a symmetric spatial sampling of the galaxy. In fact, due to a bright field star next to the innermost regions of And XVI, we were forced to point the telescope such that the center of the galaxy is next to the edge of the ACS camera, at (X,Y)(566,1847) px (see the black cross in Figure 2). Second, we estimate that the current ACS data cover 23% of the galaxy area.
For the following analysis, we take advantage of a homogeneous derivation of the structural parameters of all M31 dwarf spheroidal galaxies that fall in the PAndAS footprint (Salomon et al., 2015) and use the following, updated values for the centroid (0:59:30.3+-0.4;+32:22:34+-0.4), ellipticity (0.290.08), position angle (989°), and half-density radius (1.00.1′).We calculated the elliptical distance for each star from the galaxy center, and we used it to select three regions. The two panels of Fig. 11 show the CMD of the inner and outer regions, selected such that they have a similar total number of sources in the bundles used for the SFH derivation (2,300). This occurs at r=1.38. Interestingly, the overall morphology of the CMD does not change strongly as a function of radius. In the following we analyze in detail the differences in the SFH, and how these reflect in the variation of the CMD morphology. The CDM of the outer regions, already presented in the right panel of Figure 3, clearly demonstrates that there is marginal evidence for the presence of And XVI stars beyond 5rh (re=5.0′).
6.1. The spatially and temporally extended SFH of And XVI
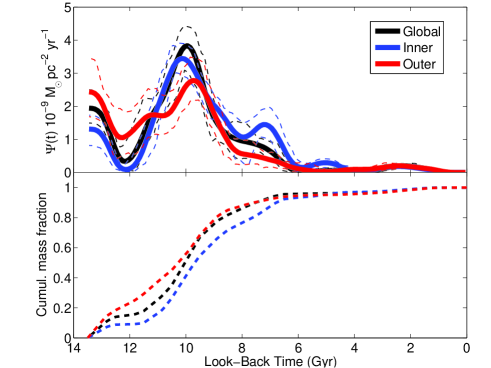
To guide the eye, we over-plotted on Figure 11 two isochrones from the BaSTI database, assuming Z=0.0003 and ages= 6,8 Gyr. Comparing the two panels we found that the region between two curves is slightly more populated in the inner (276 stars) than in the outer region (191 stars), suggesting that the star formation rate 6 Gyr ago was higher in the inner than in the outer region. It also may indicate that the star formation was slightly more prolonged toward the center of And XVI, as commonly found in nearby dwarf galaxies, though the effect looks small. It is remarkable that And XVI was able to sustain star formation for at least 6 Gyr over a vast fraction of its main body.
To support this finding, we derive the SFH in the two elliptical regions, in identical way as for the full galaxy. The results are shown in Figure 12, where the calculated SFRs vs time are over-plotted. The figure shows that the main features are consistent in the inner, outer, and the global solutions. The SFR in both the central and external region presents an initial peak followed by a decreased activity. The main peak is recovered at similar age (10 Gyr ago), and star formation continues to 6 Gyr in both regions. However, at the most recent epochs, it presents stronger activity in the central part compared to the outskirts, with a secondary peak occurred 7 Gyr ago. It must be stressed that the uncertainties are large, mostly due to the small number of stars used to derive both solutions, and therefore such detailed comparison should be treated cautiously. However, the fact that And XVI was able to sustain star formation for at least 6 Gyr over its entire body remains a solid result. This is significantly different from what was found in other dwarfs. For example, the spatial variation of the SFH in LGS 3 and Phoenix (Hidalgo et al., 2013) indicate the presence of a gradient in the age of the youngest populations, which are confined in the central regions only. Similar conclusions have been reached also in the case of the MW satellites Fornax and Carina (de Boer et al., 2013, 2014), which are dominated by intermediate-age populations in the center and by purely old populations in the outskirts.
7. Discussion
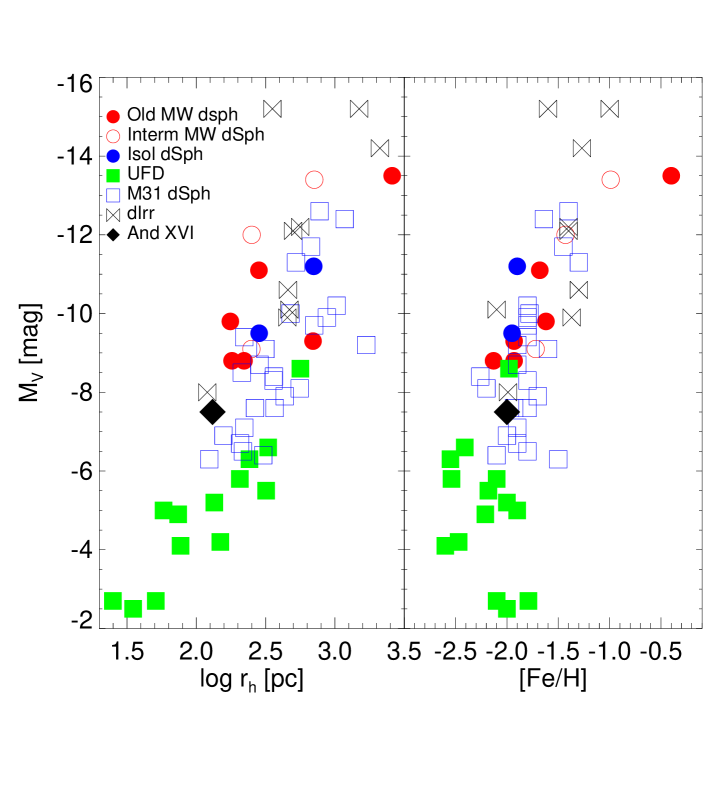
Given its size and luminosity, And XVI is somewhat at the boundary between classical and faint dwarfs. Figure 13 shows the absolute magnitude of Local Group dwarfs as a function of their size (half light radius, ) and metallicity. The data are from the compilation paper by McConnachie (2012), and the plots partially replicate his figures 6 and 12 (see also Clementini et al. 2012, their figure 1). Different symbols indicate LG dwarf galaxies of different morphological types, as labeled. We updated here the position of And XVI, shown as a black diamond, using the luminosity from Martin et al 2016 (submitted). And XVI occupies the faint tail of the M31 satellites sequence, being 1 mag brighter than M31 dwarfs of similar size, such as And XI and And XX. With respect to previous estimates (Ibata et al., 2007), the absolute magnitude increased by 1.7 mag, moving And XVI significantly closer to the faint dwarfs region ( = 7.5 mag), but nonetheless it is still 2-3 mag brighter than Galactic faint dwarfs of similar size such as Leo V and Ursa Major II.
And XVI is thus a small mass satellite of M31, located relatively far from both its host (279 kpc) and the MW (575 kpc). The most striking feature of its evolution is that it was able to sustain star formation for 7 Gyr and, as proven in the previous section, over most of its body, with only a small spatial gradient in the sense that the youngest star formation (6-8 Gyr ago) was stronger in the inner regions. This occurrence is an interesting and peculiar feature among LG dwarfs. In fact, broadly speaking, it is something intermediate between the two typical observed behaviors. Following the nomenclature introduced by Gallart et al. (2015), we identify that the majority of dSph galaxies are fast systems, i.e., they have formed stars for a short amount of time at the oldest epochs (e.g., Draco, Ursa Minor, Cetus, Tucana). On the other extreme, slow dwarf galaxies which present current or recent star formation are characterized by continuous activity from the oldest to youngest epochs (e.g., Leo A: Cole et al. 2007; Leo T: Weisz et al. 2012; Clementini et al. 2012; DDO210: Cole et al. 2014; the Fornax dSph: de Boer et al. 2012a; del Pino et al. 2013; the Magellanic Clouds: Smecker-Hane et al. 2002; Noël et al. 2009; Meschin et al. 2014). Within this scheme, the dominant old peak of star formation makes And XVI similar to a fast system, but nonetheless the extended activity is typical of slow galaxies, though the quenching occurred 6 Gyr ago. What mechanisms influenced the evolution of And XVI? What favored the extended star formation, and what caused its termination?
We derived that the mass formed in the surveyed area during the first two Gyr is of the order of (15% of the total mass). Therefore, And XVI would have properties comparable to a typical faint dwarf, if star formation had been truncated at a similar epoch. This suggests that, despite the similar stellar mass back then, And XVI was not strongly affected by reionitazion, which is thought to be the strongest mechanism shutting down star formation in low mass Milky Way satellites (Brown et al., 2014). On the other hand, the properties of the old population in And XVI are reminiscent of those of the old population in the low-mass dIrr isolated galaxies, Leo A and Leo T, at least in terms of integrated quantities. On the one hand, the mean star formation rate of Leo A between 13.5 and 11.5 Gyr ago was 2., implying that this dIrr formed in the first 2 Gyr a mass of stars of the order of 4104 M⊙. This is within a factor of 2 of what was produced by And XVI444Taking into account the area covered by ACS data and the size of Leo A(Vansevičius et al., 2004), we estimate that this number might be underestimated by a factor or 2-3, thus not affecting the following discussion. Moreover, the number of RRL stars is very similar in both systems (8 10, Bernard et al. 2013). On the other hand, Figure 13 also shows that, in both planes, And XVI is located remarkably close to Leo T, the lowest mass star forming galaxy known in the LG. In particular, And XVI is 0.5 mag fainter than Leo T which, despite its low mass (total mass , Simon & Geha 2007, Ryan-Weber et al. 2008, thus comparable to that of And XVI), was able to form stars over a Hubble time (Weisz et al., 2012; Clementini et al., 2012).
This suggests that the initial properties of And XVI, Leo A, and Leo T were similar to those of a faint dwarf progenitor. Nonetheless, if the initial masses were similar, And XVI, Leo T, and Leo A would have been equally vulnerable as faint dwarfs to the quenching effect of reionization. This clearly does not seem to be the case, since in the SFH there is no trace of a strong damping effect during the early evolution, contrary to what occurs in faint dwarfs. Possibly, this is indicating that the different evolution is dictated by the environmental conditions. At present, Leo T is located in relative isolation quite similar to And XVI, at 400 kpc from the MW and more than 900 kpc from M31. Interestingly, the negative radial velocities of both Leo T and And XVI with respect of both spirals and the LG barycenter is compatible with them approaching the LG for the first time. Leo A is remarkably one of the most isolated systems at the fringes of the LG. Together with DDO210 and VV124 it belongs to the restricted group of dwarf galaxies that did not ever strongly interact with either the MW and M31 all along their history (McConnachie, 2012). The similarity of And XVI and these dIrrs may also indirectly support the idea that And XVI was initially located in a lower density environment, far from both the ionizing radiation and the gravitational effect of the growing MW and M31, thus explaining the prolonged star formation despite the initial low mass. This has been proposed to be generally the case for slow systems (Gallart et al., 2015).
Moreover, it has been suggested that And XVI is among the least dark matter dominated of the M31 satellites (Collins et al., 2014). This as well might be an indication of a slower mass assembling history maybe related to the formation in a low-density environment. Although such small systems are expected to be strongly affected by reionization, the subsequent evolution may be driven by a complex interplay of mass assembly history, effect of the reionization and effect of stellar feedback. Theoretical models by Benítez-Llambay et al. (2014) suggest that the stellar feedback acts as regulator of the evolution of small galaxies after the reionization epoch: in those systems where the star formation started before the reionization, the stellar feedback contributes to sweep out the gas, causing a definitive termination in the star formation. In those systems where no stars formed before the reionization epoch, this contributes to heat up and disperse the gas, but is not strong enough to permanently remove the gas from these systems. This gas is later recollected by the central halo and can start producing stars mostly at intermediate to young ages. Leo A, Leo T and And XVI may fit in this scheme, and therefore they may be galaxies with mass below threshold for star formation before the reionization.
8. Conclusions
We have presented a detailed analysis of the And XVI dSph galaxy,
satellite of M31, based on deep CMD obtained from ACS data. The main
conclusions can be summarized as follows:
We have derived three SFH of And XVI using two different
photometric reduction (DAOPHOT and DOLPHOT) and two stellar evolution
libraries (BaSTI and Girardi), obtaining a very good agreement independently
on the assumptions;
The SFH of And XVI at the oldest epochs seems different from both the MW and
isolated dSph, as the dominant peak occurred relatively late, around 10 Gyr ago,
is preceded by an initial peak at the oldest
ages, followed by a period of decreased activity;
Despite the low stellar mass (M105M⊙), And XVI
presents an extended star formation activity, which begun at the oldest
epochs and was maintained until 6 Gyr ago;
We detected 9 variable stars, all RRL stars. Eight of them
belong to And XVI, while one is compatible with being a more distant,
M31 halo field star;
We provided a new estimate of the distance of And XVI,
= 23.720.09 mag, based on the properties of RRL stars. We
found that different methods (Luminosity-metallicity relation,
period-luminosity-metallicity relation) provide values slightly larger than
previous estimates based on the RGB tip;
We discussed the properties of And XVI in comparison
with other LG dwarfs. And XVI occupies the faint end of the dSph
sequence. However, we found that if its star formation would have been
truncated 12 Gyr ago, today it would closely resemble a faint dwarf galaxy
in stellar mass.
The SFH of And XVI is consistent with a formation and early
evolution in a low-density environment, which favored a slow mass assembly
and prolonged star formation. A late arrival in the inner region of the LG
may have been the cause of the termination in star formation occurring 7 Gyr ago.
New data available for more M31 satellites, collected within the framework of this project, will allow us to build a fundamental sample to compare the MW, M31, and isolated dwarfs in the LG.
acknowledgments
We are grateful to the anonymous referee for the pertinent comments which improved the paper. The authors thanks M. Marconi and V. Braga for providing the coefficients of the period-luminosity relations. MM is grateful to G. Fiorentino and to G. Bono for the discussion on the HB morphology and the RRL properties. Support for this work has been provided by the Education and Science Ministry of Spain (grants AYA2013-42781, AYA2014-56765-P). DRW is supported by NASA through Hubble Fellowship grant HST-HF-51331.01 awarded by the Space Telescope Science Institute. MBK is supported by the HST grants AR-12836 and AR-13888.
Facility: HST (ACS)
References
- Aparicio & Gallart (2004) Aparicio, A., & Gallart, C. 2004, AJ, 128, 1465
- Aparicio & Hidalgo (2009) Aparicio, A., & Hidalgo, S. L. 2009, AJ, 138, 558
- Bell et al. (2011) Bell, E. F., Slater, C. T., & Martin, N. F. 2011, ApJ, 742, L15
- Benítez-Llambay et al. (2014) Benítez-Llambay, A., Navarro, J. F., Abadi, M. G., et al. 2014, ArXiv e-prints
- Bernard et al. (2009) Bernard, E. J., Monelli, M., Gallart, C., et al. 2009, ApJ, 699, 1742
- Bernard et al. (2010) —. 2010, ApJ, 712, 1259
- Bernard et al. (2012) Bernard, E. J., Ferguson, A. M. N., Barker, M. K., et al. 2012, MNRAS, 420, 2625
- Bernard et al. (2013) Bernard, E. J., Monelli, M., Gallart, C., et al. 2013, MNRAS, 432, 3047
- Bersier & Wood (2002) Bersier, D., & Wood, P. R. 2002, AJ, 123, 840
- Bono et al. (2003) Bono, G., Caputo, F., Castellani, V., et al. 2003, MNRAS, 344, 1097
- Brown et al. (2014) Brown, T. M., Tumlinson, J., Geha, M., et al. 2014, ApJ, 796, 91
- Cacciari et al. (2005) Cacciari, C., Corwin, T. M., & Carney, B. W. 2005, AJ, 129, 267
- Caputo et al. (2000) Caputo, F., Marconi, M., Musella, I., & Santolamazza, P. 2000, A&A, 359, 1059
- Castellani & degl’Innocenti (1995) Castellani, V., & degl’Innocenti, S. 1995, A&A, 298, 827
- Catelan (2009) Catelan, M. 2009, Ap&SS, 320, 261
- Clementini et al. (2012) Clementini, G., Cignoni, M., Contreras Ramos, R., et al. 2012, ApJ, 756, 108
- Clementini et al. (2003) Clementini, G., Gratton, R., Bragaglia, A., et al. 2003, AJ, 125, 1309
- Cole et al. (2014) Cole, A. A., Weisz, D. R., Dolphin, A. E., et al. 2014, ApJ, 795, 54
- Cole et al. (2007) Cole, A. A., Skillman, E. D., Tolstoy, E., et al. 2007, ApJ, 659, L17
- Collins et al. (2014) Collins, M. L. M., Chapman, S. C., Rich, R. M., et al. 2014, ApJ, 783, 7
- Collins et al. (2015) Collins, M. L. M., Martin, N. F., Rich, R. M., et al. 2015, ApJ, 799, L13
- Conn et al. (2012) Conn, A. R., Ibata, R. A., Lewis, G. F., et al. 2012, ApJ, 758, 11
- Coppola et al. (2013) Coppola, G., Stetson, P. B., Marconi, M., et al. 2013, ApJ, 775, 6
- Dall’Ora et al. (2003) Dall’Ora, M., Ripepi, V., Caputo, F., et al. 2003, AJ, 126, 197
- de Boer et al. (2014) de Boer, T. J. L., Tolstoy, E., Lemasle, B., et al. 2014, A&A, 572, A10
- de Boer et al. (2013) de Boer, T. J. L., Tolstoy, E., Saha, A., & Olszewski, E. W. 2013, A&A, 551, A103
- de Boer et al. (2012a) de Boer, T. J. L., Tolstoy, E., Hill, V., et al. 2012a, A&A, 544, A73
- de Boer et al. (2012b) —. 2012b, A&A, 539, A103
- de Jong et al. (2008) de Jong, J. T. A., Harris, J., Coleman, M. G., et al. 2008, ApJ, 680, 1112
- del Pino et al. (2013) del Pino, A., Hidalgo, S. L., Aparicio, A., et al. 2013, MNRAS, 433, 1505
- D’Onghia et al. (2009) D’Onghia, E., Besla, G., Cox, T. J., & Hernquist, L. 2009, Nature, 460, 605
- Fiorentino et al. (2006) Fiorentino, G., Limongi, M., Caputo, F., & Marconi, M. 2006, A&A, 460, 155
- Fiorentino & Monelli (2012) Fiorentino, G., & Monelli, M. 2012, A&A, 540, A102
- Gallart et al. (2005) Gallart, C., Zoccali, M., & Aparicio, A. 2005, ARA&A, 43, 387
- Gallart et al. (2015) Gallart, C., Monelli, M., Mayer, L., et al. 2015, ApJ, 811, L18
- Girardi et al. (2000) Girardi, L., Bressan, A., Bertelli, G., & Chiosi, C. 2000, A&AS, 141, 371
- Hidalgo et al. (2011) Hidalgo, S. L., Aparicio, A., Skillman, E., et al. 2011, ApJ, 730, 14
- Hidalgo et al. (2013) Hidalgo, S. L., Monelli, M., Aparicio, A., et al. 2013, ApJ, 778, 103
- Ibata et al. (2007) Ibata, R., Martin, N. F., Irwin, M., et al. 2007, ApJ, 671, 1591
- Ibata et al. (2014) Ibata, R. A., Lewis, G. F., McConnachie, A. W., et al. 2014, ApJ, 780, 128
- Irwin et al. (2007) Irwin, M. J., Belokurov, V., Evans, N. W., et al. 2007, ApJ, 656, L13
- Kaluzny et al. (1995) Kaluzny, J., Kubiak, M., Szymanski, M., et al. 1995, A&AS, 112, 407
- Kinemuchi et al. (2008) Kinemuchi, K., Harris, H. C., Smith, H. A., et al. 2008, AJ, 136, 1921
- Koposov et al. (2015) Koposov, S. E., Belokurov, V., Torrealba, G., & Wyn Evans, N. 2015, ArXiv e-prints
- Kroupa (2002) Kroupa, P. 2002, Science, 295, 82
- Kunder et al. (2013) Kunder, A., Stetson, P. B., Cassisi, S., et al. 2013, AJ, 146, 119
- Lee (1990) Lee, Y.-W. 1990, ApJ, 363, 159
- Letarte et al. (2009) Letarte, B., Chapman, S. C., Collins, M., et al. 2009, MNRAS, 400, 1472
- Mac Low & Ferrara (1999) Mac Low, M.-M., & Ferrara, A. 1999, ApJ, 513, 142
- Madore & Freedman (1995) Madore, B. F., & Freedman, W. L. 1995, AJ, 109, 1645
- Mapelli et al. (2009) Mapelli, M., Ripamonti, E., Battaglia, G., et al. 2009, MNRAS, 396, 1771
- Mapelli et al. (2007) Mapelli, M., Ripamonti, E., Tolstoy, E., et al. 2007, MNRAS, 380, 1127
- Martin et al. (2009) Martin, N. F., McConnachie, A. W., Irwin, M., et al. 2009, ApJ, 705, 758
- Martin et al. (2013a) Martin, N. F., Slater, C. T., Schlafly, E. F., et al. 2013a, ApJ, 772, 15
- Martin et al. (2013b) Martin, N. F., Schlafly, E. F., Slater, C. T., et al. 2013b, ApJ, 779, L10
- Martin et al. (2015) Martin, N. F., Nidever, D. L., Besla, G., et al. 2015, ArXiv e-prints
- Mateo et al. (1995) Mateo, M., Fischer, P., & Krzeminski, W. 1995, AJ, 110, 2166
- Mayer et al. (2001) Mayer, L., Governato, F., Colpi, M., et al. 2001, ApJ, 547, L123
- Mayer et al. (2006) Mayer, L., Mastropietro, C., Wadsley, J., Stadel, J., & Moore, B. 2006, MNRAS, 369, 1021
- McConnachie (2012) McConnachie, A. W. 2012, AJ, 144, 4
- McConnachie et al. (2009) McConnachie, A. W., Irwin, M. J., Ibata, R. A., et al. 2009, Nature, 461, 66
- Meschin et al. (2014) Meschin, I., Gallart, C., Aparicio, A., et al. 2014, MNRAS, 438, 1067
- Monelli et al. (2010a) Monelli, M., Cassisi, S., Bernard, E. J., et al. 2010a, ApJ, 718, 707
- Monelli et al. (2010b) Monelli, M., Hidalgo, S. L., Stetson, P. B., et al. 2010b, ApJ, 720, 1225
- Monelli et al. (2010c) Monelli, M., Gallart, C., Hidalgo, S. L., et al. 2010c, ApJ, 722, 1864
- Monelli et al. (2012) Monelli, M., Cassisi, S., Mapelli, M., et al. 2012, ApJ, 744, 157
- Noël et al. (2009) Noël, N. E. D., Aparicio, A., Gallart, C., et al. 2009, ApJ, 705, 1260
- Pietrinferni et al. (2004) Pietrinferni, A., Cassisi, S., Salaris, M., & Castelli, F. 2004, ApJ, 612, 168
- Pietrinferni et al. (2009) Pietrinferni, A., Cassisi, S., Salaris, M., Percival, S., & Ferguson, J. W. 2009, ApJ, 697, 275
- Richardson et al. (2011) Richardson, J. C., Irwin, M. J., McConnachie, A. W., et al. 2011, ApJ, 732, 76
- Ricotti & Gnedin (2005) Ricotti, M., & Gnedin, N. Y. 2005, ApJ, 629, 259
- Ryan-Weber et al. (2008) Ryan-Weber, E. V., Begum, A., Oosterloo, T., et al. 2008, MNRAS, 384, 535
- Salomon et al. (2015) Salomon, J.-B., Ibata, R. A., Martin, N. F., & Famaey, B. 2015, MNRAS, 450, 1409
- Santana et al. (2013) Santana, F. A., Muñoz, R. R., Geha, M., et al. 2013, ApJ, 774, 106
- Schlafly & Finkbeiner (2011) Schlafly, E. F., & Finkbeiner, D. P. 2011, ApJ, 737, 103
- Simon & Geha (2007) Simon, J. D., & Geha, M. 2007, ApJ, 670, 313
- Skillman et al. (2014) Skillman, E. D., Hidalgo, S. L., Weisz, D. R., et al. 2014, ApJ, 786, 44
- Slater et al. (2011) Slater, C. T., Bell, E. F., & Martin, N. F. 2011, ApJ, 742, L14
- Smecker-Hane et al. (2002) Smecker-Hane, T. A., Cole, A. A., Gallagher, III, J. S., & Stetson, P. B. 2002, ApJ, 566, 239
- Stetson (1996) Stetson, P. B. 1996, PASP, 108, 851
- Susa & Umemura (2004) Susa, H., & Umemura, M. 2004, ApJ, 610, L5
- The DES Collaboration et al. (2015) The DES Collaboration, Bechtol, K., Drlica-Wagner, A., et al. 2015, ArXiv e-prints
- Tollerud et al. (2012) Tollerud, E. J., Beaton, R. L., Geha, M. C., et al. 2012, ApJ, 752, 45
- Vansevičius et al. (2004) Vansevičius, V., Arimoto, N., Hasegawa, T., et al. 2004, ApJ, 611, L93
- Weisz et al. (2012) Weisz, D. R., Zucker, D. B., Dolphin, A. E., et al. 2012, ApJ, 748, 88
- Weisz et al. (2014) Weisz, D. R., Skillman, E. D., Hidalgo, S. L., et al. 2014, ApJ, 789, 24
- Willman et al. (2006) Willman, B., Masjedi, M., Hogg, D. W., et al. 2006, ArXiv Astrophysics e-prints
- Yang & Sarajedini (2012) Yang, S.-C., & Sarajedini, A. 2012, MNRAS, 419, 1362