Turbulence generated proton-scale structures in the terrestrial magnetosheath
Abstract
Recent results of numerical magnetohydrodynamic simulations suggest that in collisionless space plasmas turbulence can spontaneously generate thin current sheets. These coherent structures can partially explain intermittency and the non-homogenous distribution of localized plasma heating in turbulence. In this Letter Cluster multi-point observations are used to investigate the distribution of magnetic field discontinuities and the associated small-scale current sheets in the terrestrial magnetosheath downstream of a quasi-parallel bow shock. It is shown experimentally, for the first time, that the strongest turbulence generated current sheets occupy the long tails of probability distribution functions (PDFs) associated with extremal values of magnetic field partial derivatives. During the analyzed one hour long time interval, about a hundred strong discontinuities, possibly proton-scale current sheets were observed.
Subject headings:
plasma turbulence – magnetic field – discontinuities1. Introduction
Downstream of the terrestrial bow shock (BS) the super-sonic and super-Alfvénic solar wind flow slows down, gets compressed and heated. The solar wind is diverted by the strong geomagnetic field at the magnetopause (MP). The magnetosheath (MS) is the region between the BS and the MP, where the field and plasma fluctuations are rather strong. Numerical simulations (Omidi et al., 2014; Karimabadi et al., 2014) demonstrate the complexity of this region - being populated by various interacting multi-scale structures, such as filaments, vortices, current sheets, plasma jets and flows. In-situ measurements from different missions also revealed the existence of nonlinear structures in upstream and downstream BS regions, for example, shocklets (Hoppe et al., 1981), short duration large amplitude magnetic structures (SLAMS) (Lucek et al., 2004), and hot-flow anomalies (Facskó et al., 2009) embedded in the highly turbulent MS. Some of these nonlinear structures are also associated with enhanced levels of wave and fluctuation activity (Kovács et al., 2009). The fluctuations and structures are more pronounced in the quasi-parallel BS configuration when the angle between the interplanetary magnetic field (IMF) and the nominal BS normal is smaller than 45∘. In such a case, the upstream (solar wind, foreshock) and downstream MS regions are magnetically connected and the resulting turbulence becomes increasingly intermittent away from the BS (Yordanova et al., 2008).
In turbulent space plasmas thin magnetic structures, current sheets and reconnection can be generated spontaneously through complex interactions (Chang et al., 2004; Servidio et al., 2009; Matthaeus et al., 2015). Furthermore, recent studies on the statistics of velocity gradient tensor invariants revealed that approaching the non-MHD scales vortex stretching may play a relevant role in generating small scale dissipative structures (Consolini et al., 2015). These structures observed as discontinuities in the solar wind (Greco et al., 2009) are associated with local dissipation/heating (Osman et al., 2012, 2014) and introduce intermittency to plasma turbulence. The occurrence frequency of discontinuities in the solar wind agrees rather well with the statistics of turbulence generated current sheets in numerical simulations (Greco et al., 2008, 2009; Servidio et al., 2011). Cluster observations in MS downstream quasi-parallel BS also confirmed the occurrence of reconnecting thin current sheets (Rétino et al., 2007; Sundkvist et al., 2007) and the current sheet associated electron heating (Chasapis et al., 2015a).
Numerical simulations have shown that the strongest discontinuities and current sheets generated by turbulence populate the tails of non-Gaussian PDFs of normalized current density (Greco et al., 2009; Matthaeus et al., 2015). However, this has not been shown directly from the data. Although it is tempting to assume that the fat tails of the PDFs are completely determined by turbulence generated strong current sheets, one should not forget that there might exist other intermittent structures of different origin. As a matter of fact, the high Reynolds number simulations of MHD turbulence (Greco et al., 2009; Servidio et al., 2011) cannot reproduce the rich ensemble of intermittent nonlinear structures mentioned above. In this letter, using Cluster data in the MS downstream of quasi-parallel BS, we show that the strongest observed current sheets de facto occupy the tails of histograms. We also estimate the occurrence frequency of the strongest current sheets along the trajectory of Cluster spacecraft. The paper is organized as follows: Section 2 explains the data and instrumentation, Section 3 introduces the structure detection tools. Section 4 demonstrates how the structure detection tools work for a thin current sheet. In Section 5 discontinuity and current sheet statistics is presented. Section 6 contains the summary and conclusions.
2. Data and instrumentation
In this Letter we consider the data interval between and UT (decimal hours) on 27 March 2002 when the Cluster spacecraft probed the magnetosheath downstream of a quasi-parallel bow shock. OMNI minute data have been used to obtain the model bow shock (Farris and Russell, 1994) and magnetopause (Shue et al., 1998) boundaries as well as the normal vector to the bow shock. The Cluster fleet was initially at the GSE coordinate system position () , moving towards the magnetopause in a nearly perfect tetrahedron configuration with inter-probe separations of about 100 km. The relative positions of the spacecraft are shown in Figure . The upstream plasma and field conditions in the solar wind were quasi-stationary with average parameters - magnetic field nT, velocity km/s, and density cm-1.
During the selected interval, the magnetic field measurements were available from the FGM instrument (Balogh et al., 1997) with sampling frequency Hz, and from the STAFF instrument (Cornilleau-Wehrlin et al., 1997) with Hz. By using finite impulse response filter at Hz the magnetic data from both instruments were merged into one time-series with extended frequency coverage up to 450 Hz in burst mode. The electric field data were available from EFW instrument (Gustafsson et al., 1997).
3. Structure detection tools
Current sheets, associated with large-scale boundaries, such as the magnetopause or the magnetotail current sheet can be easily identified. Even if the boundaries are moving or the structures are flapping, the same current sheet can be observed multiple times. On the other hand, turbulence generated boundaries and the associated current sheets are small-scale and transient in the spacecraft frame. Their identification requires special methods. To detect discontinuities and current sheets in magnetosheath three types of parameters will be estimated from Cluster spacecraft pairs (, = 1, 2, 3, 4) in time : 1.) the Partial Variance of Increments (); 2.) the angle between magnetic field vectors ; and 3.) the magnetic field derivatives .
The method using PVIs was first introduced for identification of discontinuities within the intermittent solar wind turbulence from single point measurement. The results have also been supported by numerical simulations (Greco et al., 2009). The PVIs here are calculated on the basis of the normalized variance of the absolute value of magnetic field spatial increments between two spacecraft :
| (1) |
where the average is taken over the whole interval. The mean is also calculated. In contrary to the standard one-directional (Greco et al., 2008), comprises information on increments along all pairs in Cluster tetrahedron. In recent 3D simulations of MHD turbulence a similar multi-directional PVI was used, arguably providing an unbiased information about the spatial structure of discontinuities (Zhang et al., 2015).
The rotation of the magnetic field vector between spacecraft pairs is estimated through:
| (2) |
The partial derivatives of the magnetic field are obtained from:
| (3) |
where is the spatial separation between pairs, stands for the partial derivatives , , , etc. These form the orthogonal components of and . For supposedly time-independent short events with roughly constant and for linearly changing magnitudes of magnetic components over the tetrahedron, the current density ( is the magnetic constant) can be calculated.
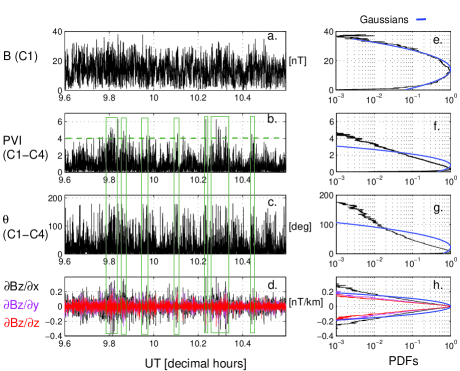
It has already been shown that the parameters and are correlated. Discontinuities with high values of are associated with large magnetic rotations (Chasapis et al., 2015a). The joint occurrence of strong magnetic shear and high indicates that the corresponding discontinuity is a current sheet. More about structure detection tools in turbulence can be found in Chasapis et al. (2015b). For the studied interval the correlations are demonstrated in Figure . The left panels – show the magnetic field intensity for C1, the PVI magnitude for the spacecraft pair C1–C4, the magnetic field rotation angle for the same pair of probes and the partial derivatives for the components of the magnetic field. The parameters from other spacecrafts or spacecraft pairs look similar (not shown). The right panels – show the PDFs corresponding to the time series on the left. The maxima of PDFs are normalized to one. Gaussians with the same standard deviations are inserted as well. Although the PDF of B(C1) is the closest to the Gaussian distribution, there are significant deviations from it near the peak value. It indicates, that various physical processes with different magnetic PDFs can form the summary histogram within the analyzed interval. The large deviations from the Gaussians for the other parameters are evident near the maxima and at the tails of PDFs. Since the strongest discontinuities or (reconnecting) current sheets are expected to form the tail of PDFs (Greco et al., 2009), we are interested in correlations between the extremal values of , and . The green boxes in panels – show a few sub-intervals of the data when the threshold selects intervals of large-deviations of and as well.
4. An example of current sheet
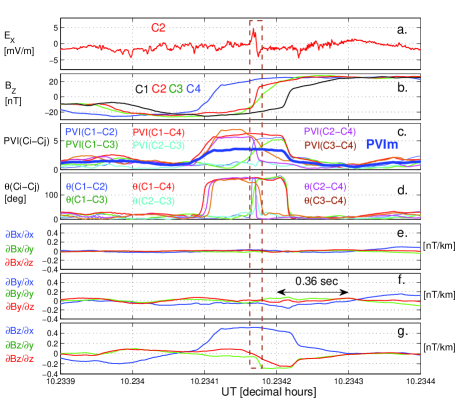
Figure shows a crossing of thin proton-scale (0.5 sec) current sheet by the Cluster fleet, for which Chasapis et al. (2015a) found electron heating signatures. For this event the GSE coordinate system was shown to be very close to the current sheet system. The panels show the bipolar change of the electric field (), the components of the magnetic field (), s for spacecraft pairs and the mean (), s for spacecraft pairs () and the derivatives (–). The bipolar signature is associated with the fast, 0.06 sec long sign-change of within the dashed box. The average Doppler-shifted electron gyroperiod for the considered 1 h long interval is 0.04 sec, rather close to the duration of the bipolar electric field change. This thin electron current sheet is embedded into a broader sheet associated with the more gradual changes of before and after of the dashed box. The fastest sign-changes of in Figure 3b were observed by and indicating that these probes crossed the current sheet where it was locally thinner or in a direction more perpendicular than the other probes. Since the probes are separated mainly in Y and Z directions (Figure 1), the current sheet normal direction is close to the GSE X direction. This is also confirmed by minimum variance analysis (not shown). Therefore, the normal component of the electric field is (Figure ) exhibiting the same time scale as the embedded electron scale seen in (red curve in the dashed box, Figure ). Figures and show that the or and parameters are correlated and indicate the crossings of the thin current sheet rather well. implies that the current sheet is between a spacecraft pair while indicates that the probes are at the same side of the sheet. The derivatives of the component mark the presence of the current sheet (Figure ), the other s show only insignificant fluctuations (Figures ). Some events during the analyzed interval are associated with the sign-changes and enhanced gradients of the component.
5. Current sheet and discontinuity statistics
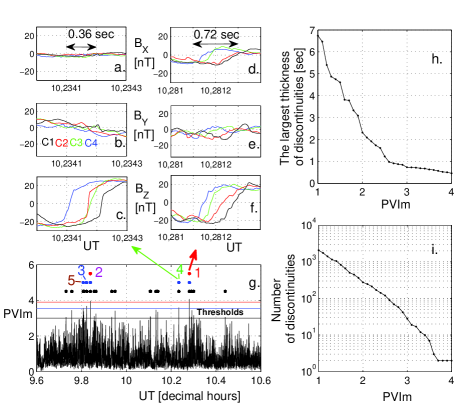
The potential discontinuities in the data can be found by using the mean . In any case, however, the PVI thresholds should not be considered as unique parameters identifying the thin current sheets. For the selected cases here we considered all the parameters shown in Figure 3 and visually checked the events. The usefulness of is demonstrated in Figure , where three different thresholds (red, blue and black horizontal lines) and the corresponding time instants - points - are shown. The red, blue and black populations of points correspond to the thresholds of the same color. The first five discontinuities are numbered and color coded by red, magenta, blue, green and brown. This color code is also used in Figure 5 for indicating the location of discontinuities in a histogram. The 1st discontinuity (magnetic components are depicted in Figures –) is a magnetic reconnection event described thoroughly by (Rétino et al., 2007). The 2nd discontinuity is a current sheet with sign-changes and the 3rd discontinuity is a more complicated event comprising crossings of two neighboring current sheets. The 4st discontinuity (Figures –) was identified as a current sheet associated with electron heating by Chasapis et al. (2015a). For these current sheets the maxima of are close to . The 5th discontinuity is a current sheet where the maxima of are less than , which is still a very high magnetic shear angle (Chasapis et al., 2015a).
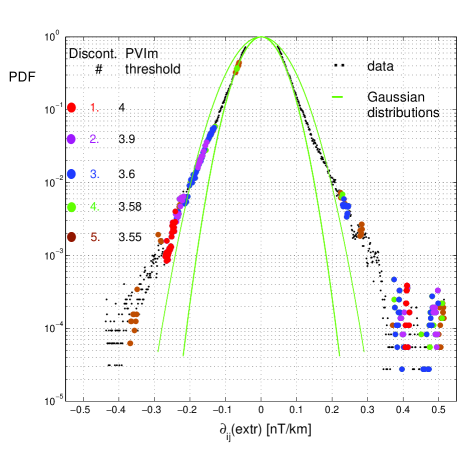
Figure shows the largest thickness of discontinuities in seconds for changing thresholds . It is calculated as a local duration of a discontinuity in time having . Since for a given threshold a discontinuity may be represented by one value only, the smallest thicknesses are often close to 0 second. Therefore, the mean discontinuity thickness has no meaning. However, the largest thickness (Figure ) together with the total number of detected discontinuities (Figure ) for a given threshold provides the information about the minimum number of discontinuities with thicknesses equal or smaller than the largest thickness. The comparison of Figure with Figure shows, that for very thin structures, for example with a duration of less than one second (possibly current sheets), there exist almost one hundred discontinuities during the analyzed magnetosheath interval. Nevertheless, Figure demonstrates that the strongest discontinuities represent a tiny part of the time series only. In order to show that the intermittently occurring rare current sheets belong to the tails of PDFs as it is expected from 2D MHD simulations of current density distributions (Greco et al., 2009) the PDF(j) should be obtained directly from the data. Although non-Gaussian skewed distributions are typical for space plasmas (Burlaga and Ness, 1998; Vörös et al., 2015), the direct estimation of j from in-situ data is difficult. The curlometer technique provides an estimate of , but it is loaded by several known sources of errors (Vallat et al., 2005). The curlometer works satisfactorily for well selected, short and stationary events with a linear variation of inside the tetrahedron. This is not the case for the entire one-hour long interval analyzed here. To reconstruct the whole PDF(j), the localized strong currents (PDF tail), the nearly current-free flux tube regions and the random transient currents (central part of PDF) should all be involved in a histogram. However, the quality of the current density estimation for the considered time interval is low. This can be deduced from the ratio , which has values for large parts of the data. For good quality (j) estimations it should be (Grimald et al., 2012). This is why instead of the derived quantity (), which can also be burdened with additional errors, we use the partial derivatives for further statistical investigations. However, as Figures – show, some of the s are close to zero even during current sheet crossing. On the other hand, there exist nonzero values which are not associated with the current sheet. The simplest way to obtain PDF() is to take the extreme value of or at times . Physically, we select structures which are associated with the largest magnetic gradient between spacecraft pairs in the tetrahedron volume at times . The result is shown in Figure . The black points correspond to the histogram of the entire time series of . The left (negative values) and the right (positive values) of PDF() are obtained independently. Since the extreme value distribution has very low occurrence frequencies for small values of derivatives, the central noisy part of the histogram for [nT/km] is cut off. The color coded points on the PDF curve, according to their , correspond to the five current sheets for different thresholds shown in Figure . We note, that the boxes in histograms near a given value of contain contributions from many other time intervals. Nevertheless, for the purposes of this study, it was enough to show that the strong discontinuities belong to the histogram boxes at the tails of PDFs. The green curves in Figure correspond to Gaussian distributions. The smallest values are normally distributed, while at the non-Gaussian tail the strongest discontinuities are observed as it is expected from numerical simulations (Greco et al., 2009; Servidio et al., 2009; Matthaeus et al., 2015). The wider Gaussian in Figure has the same mean and standard deviation as the data. The narrower Gaussian represents a fit to the central part of the histogram, shown with the purpose to indicate the strong deviation of the tails from the normal PDF. The PDF values between the two Gaussian curves are expected to correspond to magnetic structures, possibly flux tubes (Greco et al., 2009).
6. Summary and conclusions
The main aim of this study was to show that the thin current sheets identified by simple structure detection tools populate the fat tails of PDFs. This has already been shown for the histograms of the normalized current density in MHD turbulence simulations (Greco et al., 2009; Matthaeus et al., 2015). However, in simulations the identification of current and magnetic structures forming the non-Gaussian PDF(j) is straightforward. Although the four-point curlometer technique is an excellent tool for estimating from four-spacecraft data, it works well for selected short events only. The two-point magnetic field differences have already been used previously in turbulence studies to obtain the long tail PDFs (Vörös et al., 2006) and to identify the intermittency effects (Yordanova et al., 2015). The extremal values of magnetic field partial derivatives calculated between spacecraft pairs are also associated with thin current sheets. We found that the strongest current sheets associated with belong to the tails of PDF(), confirming the results of MHD turbulence simulations on the generation of intermittent structures (Greco et al., 2009; Matthaeus et al., 2015). It was also found that during a one-hour-long time Cluster observed about a hundred thin magnetic structures in the MS downstream of a quasi-parallel BS which might be associated with non-homogenous localized heating of plasma. This conjecture has to be confirmed by a thorough analysis of similar events using high resolution field, particle and plasma data from the MMS mission. Our results also demonstrate that, a conditional selection of structures and their identification in histograms (PDFs) represents a powerful tool for better understanding of the role of rare but intense events (in our case strong discontinuities or reconnection sites), which can determine the basic physical properties of plasma systems.
References
- Balogh et al. (1997) Balogh, A., M. W. Dunlop, S. W. H.Cowley, D. J. Southwood, et al., (1997), The Cluster Magnetic Field Investigation, Space Sci. Rev., 79(1/2), 65–91.
- Burlaga and Ness (1998) Burlaga, L.F., and N.F. Ness, (1998), Magnetic field strength distributions and spectra in the heliosphere and their significance for cosmic ray modulation: Voyager 1, 1980-1994, J. Geophys. Res., 103, 29719–29732.
- Chang et al. (2004) Chang, T., S. W. Y. Tam, and C. C Wu, (2004) Solar wind magnetic fluctuation spectra: Dispersion versus damping Phys. Plasmas, 11, 1287- 1299.
- Chasapis et al. (2015a) Chasapis, A., A. Retinó, F. Sahraoui, A. Vaivads, Yu. V. Khotyaintsev, et al., (2015a) Thin Current Sheets and Associated Electron Heating in Turbulent Space Plasma Astrophys. J. Lett., 804, L1.
- Chasapis et al. (2015b) Chasapis, A., (2015b) Study of magnetic reconnection in turbulent plasmas using satellite data, PhD Thesis, Laboratoire de Physique des Plasmas, Universitè Paris-Sud, France.
- Cornilleau-Wehrlin et al. (1997) Cornilleau-Wehrlin, N., P. Chauveau, S. Louis, A. Meyer, J. M. Nappa, et al., (1997), The Cluster Spatio-Temporal Analysis of Field Fluctuations (STAFF) Experiment, Space Sci. Rev., 79(1/2), 107–136.
- Consolini et al. (2015) Consolini, G., M. Materassi, M.F. Marcucci, and G. Pallocchia, (2015), Statistics of the velocity gradient tensor in space plasma turbulent flows, Astrophys. J., 812:84.
- Facskó et al. (2009) Facskó, G., Z. Németh, G. Erdös, A. Kis and I. Dandouras, (2009) A global study of hot flow anomalies using Cluster multi-spacecraft measurements Ann. Geophys., 27, 2057- 2076.
- Farris and Russell (1994) Farris, M. H., and C. T. Russell, (1994) Determining the standoff distance of the bow shock: Mach number dependence and use of models J. Geophys. Res., 99, 17681- 17689.
- Greco et al. (2008) Greco, A., P. Chuychai, W. H. Matthaeus, S. Servidio, and P. Dmitruk, (2008) Intermittent MHD structures and classical discontinuities Geophys. Res. Lett., 35, L19111.
- Greco et al. (2009) Greco, A., W. H. Matthaeus, S. Servidio, P. Chuychai, and P. Dmitruk, (2009) Statistical Analysis of Discontinuities in Solar Wind ACE Data and Comparison with Intermittent MHD Turbulence Astrophys. J. Lett., 691, L111-L114.
- Grimald et al. (2012) Grimald, S., I. Dandouras, P. Robert, and E. Lucek, (2012) Study of the applicability of the curlometer technique with the four Cluster spacecraft in regions close to Earth Ann. Geophys., 30, 597- 611.
- Gustafsson et al. (1997) Gustafsson, G., R. Boström, B. Holback, G. Holmgren, A. Lundgren, K. Stasiewicz, et al., (1997), The Electric Field and Wave Experiment for the Cluster Mission, Space Sci. Rev., 79(1/2), 137–156.
- Hoppe et al. (1981) Hoppe, M. M., C. T. Russell, L. A. Frank, T. E. Eastman, and E. W. Greenstadt, (1981) Upstream hydromagnetic waves and their association with backstreaming ion populations - ISEE 1 and 2 observations J. Geophys. Res., 86, 4471–4492.
- Karimabadi et al. (2014) Karimabadi, H., V. Roytershteyn, H. X. Vu, Y. A. Omelchenko, J. Scudder, W. Daughton, et al., (2014) The link between shocks, turbulence, and magnetic reconnection in collisionless plasmas Phys. of Plasmas, 21, 062308.
- Kovács et al. (2009) Kovács, P., G. Facskó, and I. Dandouras, (2014) Turbulent dynamics inside the cavity of hot flow anomaly Planet. Space Sci., 92, 24- 33.
- Lucek et al. (2004) Lucek, E., T. Horbury, A. Balogh, I. Dandouras, and H. R me, (2004) Cluster observations of structures at quasi-parallel bow shocks Ann. Geophys., 22, 2309–2313.
- Matthaeus et al. (2015) Matthaeus,W. H., M. Wan, S. Servidio, A. Greco, K. T. Osman, S. Oughton, and P. Dmitruk (2015) Intermittency, nonlinear dynamics and dissipation in the solar wind and astrophysical plasmas Phil. Trans. R. Soc. A, 373, 20140154.
- Omidi et al. (2014) Omidi, N., D. Sibeck, O. Gutynska, and K. J. Trattner, (2014) Magnetosheath filamentary structures formed by ion acceleration at the quasi-parallel bow shock J. Geophys. Res., 119, 2593 -2604.
- Osman et al. (2014) Osman, K. T.,W. H. Matthaeus, J. T. Gosling, A. Greco, S. Servidio, B. Hnat, et al., (2014) Magnetic Reconnection and Intermittent Turbulence in the Solar Wind Phys. Rev. Lett., 112, 215002.
- Osman et al. (2012) Osman, K. T.,W. H. Matthaeus, M. Wan, and A. F. Rappazzo, (2012) Intermittency and Local Heating in the Solar Wind Phys. Rev. Lett., 108, 261102.
- Rétino et al. (2007) Retinò, A., D. Sundkvist, A. Vaivads, F. Mozer, M. André, C. J. Owen, (2007) In situ evidence of magnetic reconnection in turbulent plasma Nature Physics, 3, 236–238.
- Servidio et al. (2011) Servidio, S., A. Greco, W. H. Matthaeus, K.T. Osman, and P. Dmitruk, (2011) Statistical association of discontinuities and reconnection in magnetohydrodynamic turbulence J. Geophys. Res., 116, A09102.
- Servidio et al. (2009) Servidio, S., W. H. Matthaeus, M. A. Shay, P. A. Cassak, and P. Dmitruk, (2009) Magnetic reconnection and two-dimensional magnetohydrodynamic turbulence Phys. Rev. Lett., 102, 115003-1- 115003-4.
- Shue et al. (1998) Shue, J.-H., P. Song, C. T. Russell, J. T. Steinberg, J. K. Chao, G. Zastenker, et al. (1998) Magnetopause location under extreme solar wind conditions J. Geophys. Res., 103, 17791–17700.
- Sundkvist et al. (2007) Sundkvist, D., A. Retinò, A. Vaivads, and S. D. Bale, (2007) Dissipation in Turbulent Plasma due to Reconnection in Thin Current Sheets Phys. Rev. Lett., 99, 025004.
- Vallat et al. (2005) Vallat, C., I. Dandouras, M. Dunlop, A. Balogh, E. Lucek, G. K. Parks, et al., (2005) First current density measurements in the ring current region using simultaneous multi-spacecraft CLUSTER-FGM data Ann. Geophys., 23, 1849- 1865.
- Vörös et al. (2006) Vörös, Z.,W. Baumjohann, R. Nakamura, M. Volwerk, and A. Runov, (2006) Bursty Bulk Flow Driven Turbulence in the Earth’s Plasma Sheet Space Sci. Rev., 122, 301–311.
- Vörös et al. (2015) Vörös, Z., M. Leitner, Y. Narita, G. Consolini, P. Kovács, A. Tóth, and J. Lichtenberger, (2015) Probability density functions for the variable solar wind near the solar cycle minimum J. Geophys. Res., 120, 6152- 6166.
- Yordanova et al. (2008) Yordanova, E., A. Vaivads, M. André, S. C. Buchert, and Z. Vörös, (2008) Magnetosheath Plasma Turbulence and Its Spatiotemporal Evolution as Observed by the Cluster Spacecraft Phys. Rev. Lett., 100, 205003.
- Yordanova et al. (2015) Yordanova, E., S. Perri, L. Sorriso-Valvo, and V. Carbone, (2015) Multipoint observations of anisotropy and intermittency in the solar wind turbulence EPL, 110, 19001.
- Zhang et al. (2015) Zhang, L., J. He, C. Tu, L. Yang, X. Wang, E. Marsch, and L. Wang, (2015) Occurrence rates and heating effects of tangential and rotational discontinuities as obtained from three-dimensional simulation of magnetohydrodynamic turbulence Astrophys. J. Lett., 804, L43.