Broad H Emission-Line Variability in a Sample of 102 Local Active Galaxies
Abstract
A sample of 102 local () Seyfert galaxies with black hole masses was selected from the Sloan Digital Sky Survey (SDSS) and observed using the Keck 10-m telescope to study the scaling relations between and host galaxy properties. We study profile changes of the broad H emission line within the year time-frame between the two sets of spectra. The variability of the broad H emission line is of particular interest, not only since it is used to estimate , but also since its strength and width is used to classify Seyfert galaxies into different types.
At least some form of broad-line variability (in either width or flux)
is observed in the majority (66%) of the objects,
resulting in a Seyfert-type change for 38% of the objects,
likely driven by variable accretion and/or obscuration.
The broad H line virtually disappears in 3/102 (3%) extreme cases.
We discuss potential causes for these changing-look AGNs. While similar dramatic transitions have previously been reported in the literature, either on a case-by-case basis or in larger samples
focusing on quasars at higher redshifts, our study provides statistical information on the frequency of H line variability in a sample of low-redshift Seyfert galaxies.
Subject headings: accretion, accretion disks black hole physics galaxies: active galaxies: evolution galaxies: Seyferts galaxies: statistics
I. Introduction
Observed relations between the mass of the supermassive black hole () at the center of a galaxy and the properties of its host galaxy – such as host galaxy mass (Magorrian et al., 1998), luminosity (Kormendy & Richstone, 1995), and stellar velocity dispersion (Ferrarese & Merritt, 2000; Gebhardt et al., 2000) – imply a relationship between galaxy evolution and black hole (BH) growth (for a recent review see Kormendy & Ho, 2013; Graham, 2016, and references therein). In the local Universe, can be measured by spatially resolving the BH sphere of influence using stellar or gas kinematics (e.g., van der Marel et al., 1998; Gebhardt et al., 2000). At larger distances, the only way to estimate is by resolving the BH sphere of influence as it responds to variations in continuum in galaxies with an active galactic nucleus (AGN). In AGNs, the BH is actively growing via an accretion disk of in-falling material. The high energy photons emitted by the hot accretion disk ionize the surrounding gas clouds, the broad-line region (BLR) in the vicinity of the BH, and the narrow-line region (NLR) further out. Reverberation mapping (Wandel et al., 1999; Kaspi et al., 2005; Bentz et al., 2013) traces variations in the accretion-disk continuum luminosity and the time-delayed response of the BLR flux to determine the size of the BLR, using light-travel time arguments. The velocity of the BLR gas can be determined from the Doppler broadening of the emission lines (such as the broad H line in the rest-frame optical). By assuming a dimensionless virial coefficient to describe the kinematics and geometry of the BLR, the velocity and size of the BLR combined yield . More recently, there have been attempts to estimate in individual objects independent of a virial coefficient by modeling reverberation-mapped data directly and constraining the geometry and kinematics of the BLR (see e.g., Pancoast et al., 2014, and references therein).
Seyfert galaxies are low luminosity AGNs for which the host galaxy can be easily resolved, thus making them attractive targets for the study of the scaling relations. In fact, for a few Seyfert galaxies, estimates from both dynamical AO measurements as well as reverberation mapping are available (Hicks & Malkan, 2008). Seyfert galaxies are categorized into different types based on their emission line profiles, ranging from type-1 to type-2 with subclasses (type-1.5, 1.8, and 1.9) in-between. Type-1 Seyferts display both broad and narrow components of emission lines, while type-2 Seyferts show only the narrow components. The intermediate Seyfert types show varying levels of broad component emission. The Balmer series in the optical regime is generally used to classify Seyfert type (Osterbrock & Koski, 1976; Osterbrock, 1977, 1981, Table 1 summarizes the different Seyfert-type classifications).
In the framework of the so-called standard unified model for active galaxies, all Seyfert galaxies are thought to be intrinsically the same but viewed from a different angle. The key to this model is a region of cold gas and dust, called the dusty torus, that surrounds the BLR and, if seen edge on, can shield both the accretion disk continuum and the broad emission lines from the observer’s view, resulting in a type-2 Seyfert galaxy. If seen face on, however, both accretion disk and BLR are visible, resulting in a type-1 Seyfert galaxy. Intermediate types-1.5, 1.8, and 1.9 are viewed along the edges of the dusty torus where it is not optically thick enough to fully block the broad lines. In other words, in this simplified model, the presence or absence of broad lines is attributed solely to viewing orientation, meaning that the Seyfert type of a galaxy does not change. (Note that the orientation of the torus is entirely independent of the host-galaxy orientation.)
However, there have been many reports of apparent Seyfert-type changes in the literature (e.g., Tohline & Osterbrock, 1976; Kollatschny & Fricke, 1985; Storchi-Bergmann et al., 1993; Aretxaga et al., 1999; Eracleous & Halpern, 2001; Trippe et al., 2008; Denney et al., 2014; Shappee et al., 2014; Parker et al., 2015). These changes can occur in either direction. NGC 4151 is one of the most notable and cited examples. Originally classified as a type-1.5 (Osterbrock, 1977), the broad emission lines disappeared throughout the 1980’s (Antonucci & Cohen, 1983; Lyutyi, Oknyanskii & Chuvaev, 1984; Penston & Perez, 1984), but have returned since (Shapovalova, Popovic & Burenkov et al., 2010). Another well-studied example is Mrk 590 which has been observed over a 40-year time scale. First observed as a type-1.5, Mrk 590 transitioned to a type-1 before the broad lines disappeared, making it a type1.9-2 Seyfert (Denney et al., 2014). Possible causes of these changing-look AGNs include changes in extinction (due to our line-of-sight grazing the dusty torus, for instance; e.g., Goodrich, 1989; Leighly et al., 2015), or changes in the AGN accretion rate (e.g., Nicastro, 2000; Korista & Goad, 2004; Elitzur, Ho, & Trump, 2014) In rare cases, the increase in accretion rate could be due to the tidal disruption and accretion of a star, and a few cases of dramatic broad-line variability possibly linked to this scenario, have been reported in recent years (e.g., Komossa et al., 2008; Arcavi et al., 2014; LaMassa et al., 2015; Merloni et al., 2015).
A certain degree of variability in the flux and profile of the BLR emission, as a response to changes in the continuum flux (and thus accretion), is not only expected, but in fact forms the basis for reverberation mapping studies. Such studies have shown that variations in continuum flux and that of the broad Balmer lines are correlated in a way so that the derived does not change (Bentz et al., 2007; Park et al., 2012; Barth et al., 2015). However, extreme variability leading to a type change seems to be rare.
Here, we address the question of the frequency of these changing-look AGNs by taking advantage of a statistical sample of 102 local Seyfert galaxies with archival spectra from the Sloan Digital Sky Survey (SDSS) and high-quality Keck spectra taken years apart. The paper is organized in the following manner. Section II summarizes the sample selection, observations, and data reduction. Section III describes the analysis of the data. Section IV discusses the derived quantities and results from the data. Section V concludes with a summary. The appendix contains a table of observations and Seyfert-type transitions for the sample (A), comparison of SDSS and Keck spectra (B), fits to the SDSS and Keck spectra (C), and SDSS optical images for two extreme objects (D). Throughout the paper, a Hubble constant of Ho = 70 km s-1, = 0.7, and = 0.3 is assumed.
II. Sample Selection, Observations, and Data Reduction
The primary goal behind sample selection and observations is the creation of a local baseline for the BH mass scaling relations of active galaxies, presented by Bennert et al. (2011); Harris et al. (2012); Bennert et al. (2015). These papers describe the sample selection, Keck observations, and Keck data reduction in detail. We here provide a brief summary only.
II.1. Sample Selection
A sample of 102 local (0.02 0.1) type-1 Seyfert galaxies was selected from the SDSS data release six (DR6) (Adelman-McCarthy et al., 2008). Objects were selected on the basis of a broad H emission line with an estimated > (Bennert et al., 2011; Harris et al., 2012). Note that of these 102 objects, only 79 are used by Bennert et al. (2015) to study the MBH- relation, since the necessary quantities (i.e., L5100, MBH, ) for that study were only accessible for these 79 objects.
II.2. SDSS Observations and Data Reduction
SDSS spectra are obtained from a 2.5-m ground based telescope with a 3” diameter circular optical fiber and an exposure time of 54 seconds. SDSS spectra cover a wavelength range of 3800Å to 9200Å with an instrumental resolution of 170 km s-1. SDSS data are already fully reduced and flux calibrated when retrieved from the SDSS archive.
II.3. Keck Observations and Data Reduction
The 102 objects selected from SDSS were observed again between January 2009 and March 2010 with the Low Resolution Imaging Spectrometer (LRIS) at the Keck 10-m telescope using a 1” x 2” wide rectangular long slit aligned with the major axis of the host galaxy (given by SDSS). (While all objects were observed at as low airmass as possible, given observation constraints, for individual objects the airmass can be as high as 1.4.) Objects observed in 2009 used a D560 dichroic, and objects observed in 2010 used a D680 dichroic. The blue Keck spectra were taken with the 600/400 grism giving a wavelength range of 3200-5350Å and an instrumental resolution of 90 km s-1; the red spectra were taken with the 831/8200 grating centered on 8950Å with a resolution of 45 km s-1. (Note that the red Keck spectra are not used in this paper since they only cover the Ca triplet absorption lines for an accurate measurement of ). The exposure times generally range from 600 to 1200 s. Keck spectra were taken on average 6.4 1.8 years after the SDSS spectra, ranging from 2.6 to 9.1 years (see Table 4 for details on SDSS and Keck observations).
The Keck data are reduced following standard reduction steps such as bias subtraction, flat field correcting, cosmic ray rejection, and wavelength calibration. AOV Hipparcos stars were used to correct for telluric absorption and relative flux calibration. Note that, unlike SDSS spectra, Keck spectra are not absolute flux calibrated because observing conditions were typically not photometric. 1D spectra were extracted from the 2D spectra with a width of 1.08” (8 pixels) to encompass the BLR, given the slit width of 1” and a typical seeing of 1”.
II.4. Lick Observations and Data Reduction
For eight objects with significantly weaker or apparently absent broad H emission in the Keck spectra, follow-up observations were conducted in January and March of 2013 with the 3m Shane telescope of Lick observatory using the Kast spectrograph and 60 min total exposure time per object. (Table 4; Scott, 2013). The slit was aligned either along the major axis or perpendicular to it. 1D spectra were extracted using a 4 pixel (3”) width centered on the peak flux to mimic the 3” diameter circular fiber of SDSS. The data were reduced following standard procedures. The Lick spectra are presented by Scott (2013). These spectra are used to determine their Seyfert type, since they also cover the H region. The Seyfert types based on the Lick spectra are listed in Table 4.
III. Analysis
In this paper, we focus on four different sets of spectra, for short called “Keck subtracted,” “Keck unsubtracted,” “SDSS subtracted,” and “SDSS unsubtracted,” as explained in the next two sections.
III.1. Unsubtracted Spectra
To classify Seyfert type and perform a qualitative comparison of the H region, the reduced spectra are used. Throughout the paper, these spectra are referred to as the unsubtracted data set.
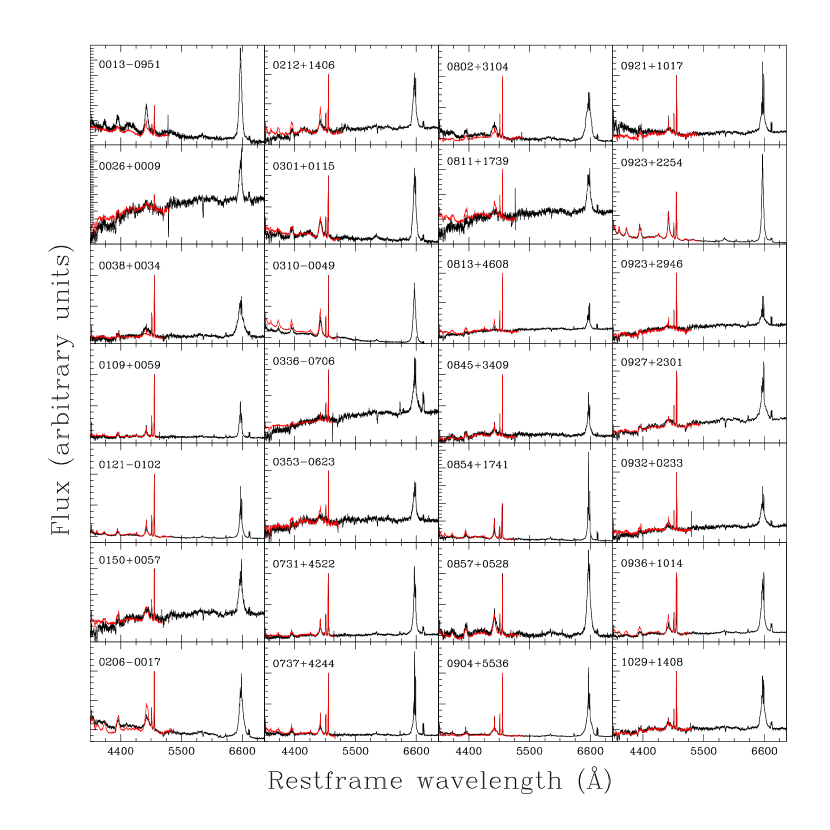
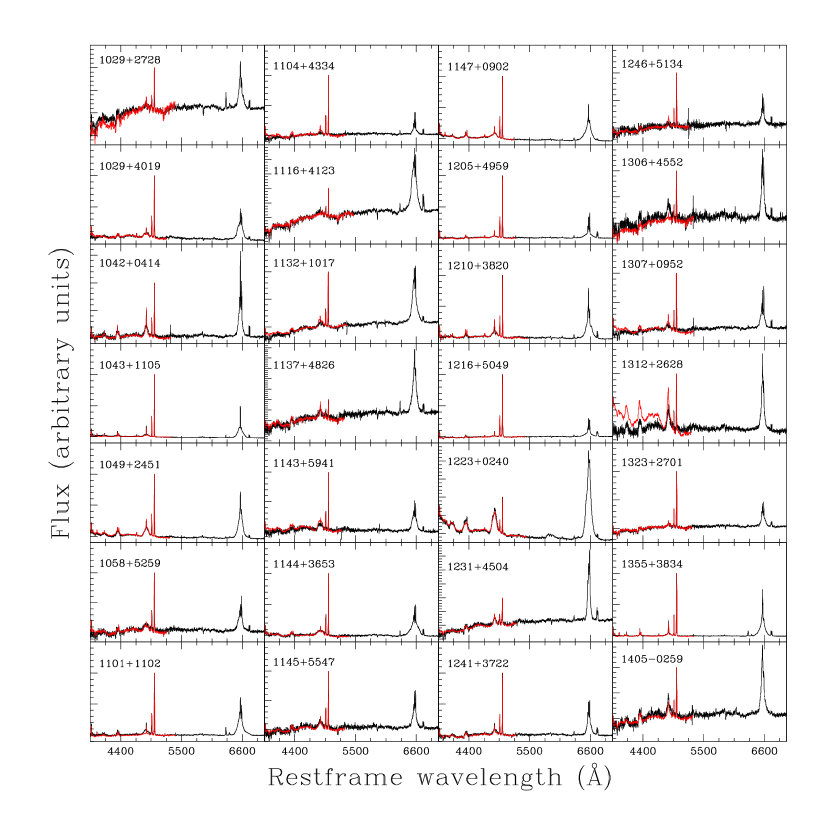
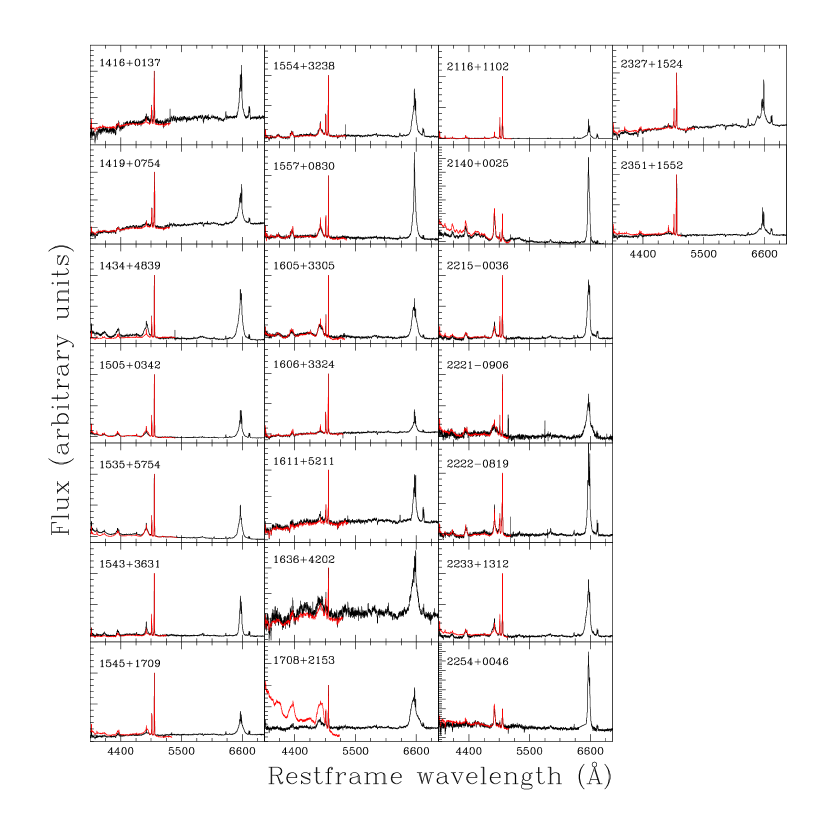
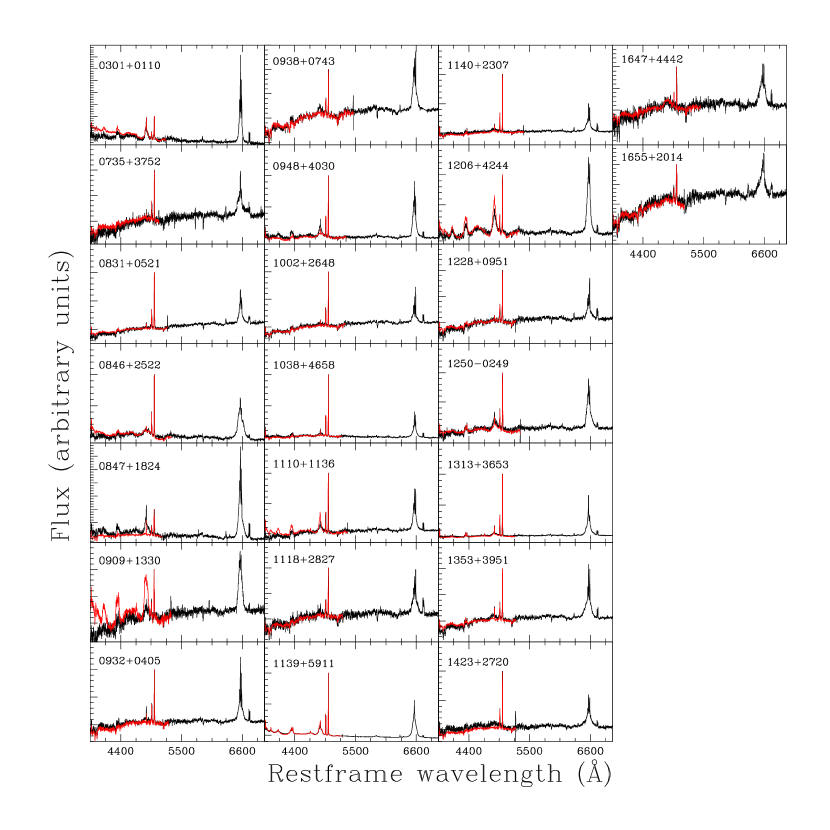
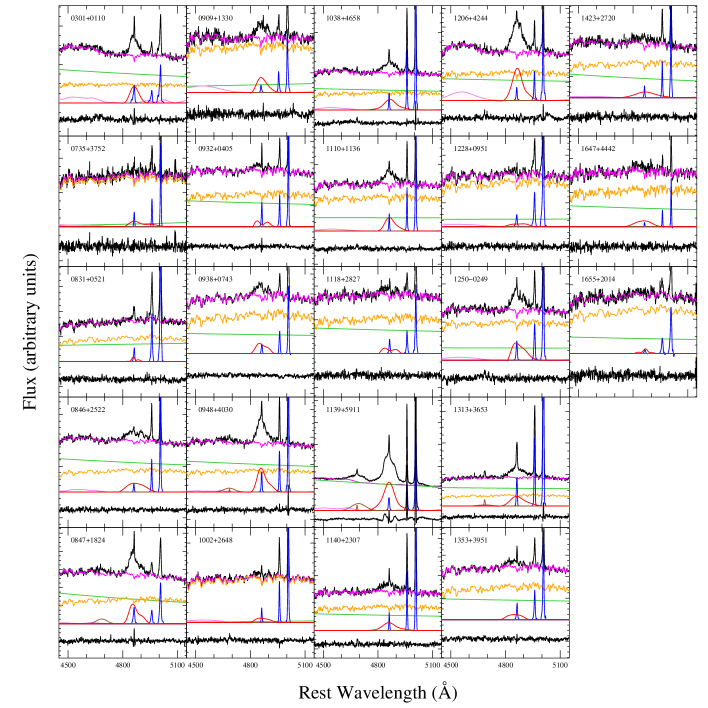
For a visual comparison of both data sets (Appendix B), the Keck spectra were re-binned to match the lower spectral resolution of the SDSS spectra. For visual presentation purposes of a direct comparison between both spectra in Figures B, the spectra were normalized to constant 5007Å [OIII] emission, assuming that the 5007Å [OIII] emission line flux is identical in both data sets, given that emission from the extended NLR does not vary over the observed timescales. This scaling also assumes that both spectra integrate the same [OIII] emission over the same area which might not necessarily be the case, given the different apertures used. Aligning the long Keck slit along the major axis of the host galaxy may reduce any difference in [OIII] flux covered. However, we discuss aperture effects in more detail below.
III.2. H Fitting and Subtracted Spectra
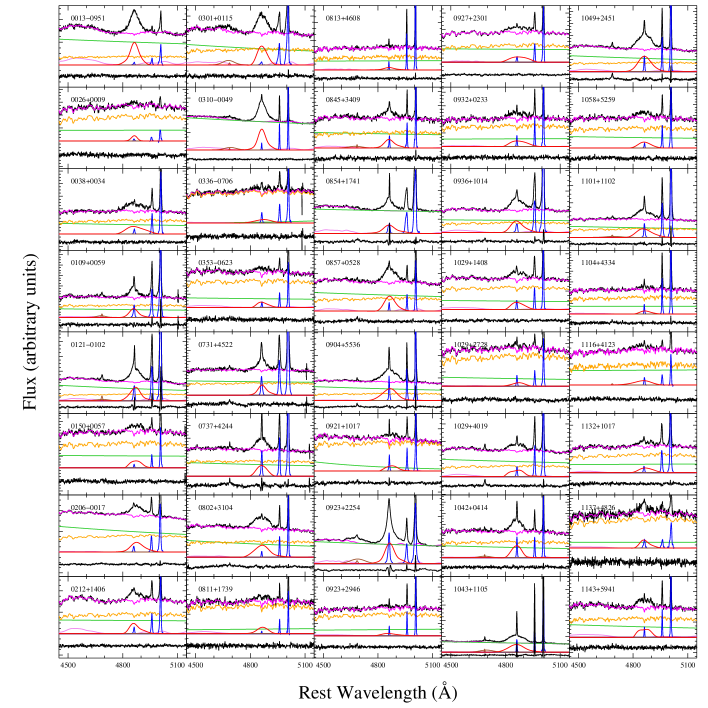
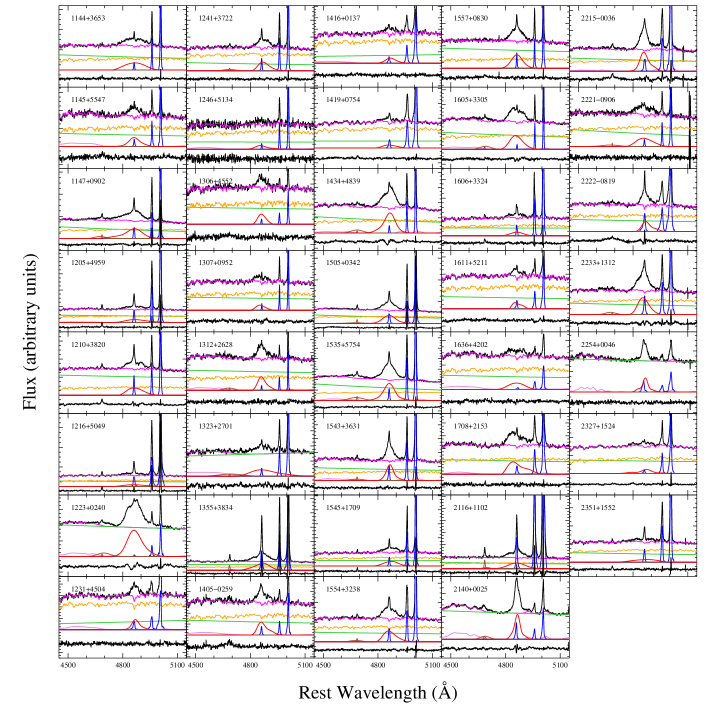
A multi-component spectral decomposition is used to fit the region around H. The procedure is summarized here briefly (see Park et al., 2015, for details).
First, the observed continuum is modeled and subtracted by fitting a pseudo-continuum consisting of the featureless AGN power-law continuum, host-galaxy starlight templates from the Indo-US spectral library (Valdez et al., 2004), and the AGN FeII emission template from Boroson & Green (1992) for the Keck spectra and from Kovacevic et al. (2010) for the SDSS spectra111The two different FeII templates are being used due to the different wavelength ranges covered by the Keck and SDSS spectra. The Keck spectra do not extend far enough into the red to fit the FeII features around 5200Å with the Kovacevic et al. (2010) multi-component template and instead must be fitted with the monolithic template from Boroson & Green (1992).. Then, the continuum-subtracted H line region is modeled by fitting Gauss-Hermite series (van der Marel & Franx, 1993; Woo et al., 2006; McGill et al., 2008) simultaneously to the [OIII] narrow emission lines 4959,5007Å and the broad and narrow H lines, to allow for the fitting of asymmetries. Gauss-Hermite polynomials of order 3-6 are used to fit the broad H line and 7-12 for each [OIII] line. In cases where the HeII 4686Å emission line is blended with the broad H, the broad and narrow HeII were fitted by simple Gaussian functions.
Depending on the degree of overlap of the broad H component with the [OIII] lines, we model the H line region in two slightly different ways. If there is no blending between the broad H component and the [OIII]5007Å line, we create a template for the narrow line components by fitting the [OIII]5007Å line with a Gauss-Hermite series function. The [OIII]4959Å line is then subtracted by blueshifting the template with a flux scale ratio fixed to 1:3 (see, e.g., Dimitrijević et al., 2007, and references therein). Then, the broad and narrow H components are fitted simultaneously through -minimization, using the blueshifted template from the [OIII]5007Å line as a template for the narrow H, with the flux ratio as a free parameter, and a Gauss-Hermite series for the broad H component.
If the broad H component is heavily blended with the [OIII] doublet lines, we model the H broad and narrow lines and the [OIII]4959, 5007Å lines all together by simultaneously fitting a Gauss-Hermite series function to the broad H component and another Gauss-Hermite series function to the [OIII]5007Å line, where the model for the [OIII]5007Å line is blueshifted and also used for both the [OIII]4959Å line with a 1:3 flux scale ratio and the narrow H component with a free flux scale ratio. This approach is based on the known fixed flux ratio of [OIII]4959, 5007 of 1:3 and the fact that the [OIII] lines and the narrow H lines originate in the NLR and should have comparable widths. It is an approach typically used to fit AGN spectra in e.g., reverberation mapping studies (Park et al., 2015; Barth et al., 2015).
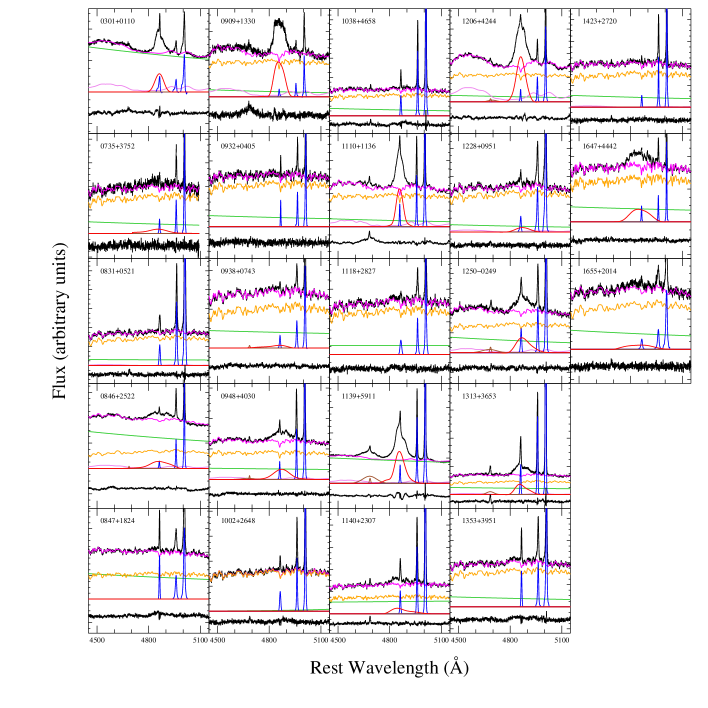
The results of the spectral fitting are given in Table 5, fits are shown in Appendix C. The pure emission-line spectra – with host-galaxy, power-law continuum and FeII emission subtracted – are referred to in the following as the subtracted data.
Note that for one object in the sample (1655+2014), the S/N ratio is too low (in both SDSS and Keck spectra) for an accurate measurement of the broad H line. For three other objects (0932+0405, 0847+1824, and 0831+0521), the broad H component could not be accurately identified in the Keck spectra. These four objects are excluded from any discussion involving the H line fitting.
III.3. Seyfert-Type Classification
The Seyfert type for all objects was classified independently by eye by two members of the team (JNR & MC) following Table 1, and has been verified independently by the broad H emission-line fitting results. Table 4 lists the Seyfert-type classifications for both SDSS and Keck spectra, as well as the eight objects observed at Lick. Typically, the H and H lines are used for Seyfert-type classification, and we followed that procedure for the SDSS and Lick spectra. However, the Keck spectra do not extend to the H line. Instead, higher order Balmer lines (H and H) were used as a proxy, see Table 1 (Osterbrock, 1977). However, these lines are intrinsically much fainter than H and H; for example, assuming case B recombination, H (H) is 26% (47%) the strength of H which itself is approximately 35% of H (Osterbrock, 1989). Moreover, the H line is often blended with the 4383Å FeI and the 4363Å [OIII] lines, cautioning the use of this line for classification. Thus, we rely on the H line for classification. This implies that we cannot differentiate between types-1.9 and 2 for Keck spectra. We conservatively classify an object without a broad H line in the Keck spectra as a type-1.9. Note that given the lower S/N of the SDSS spectra, caution should be exercised when classifying the Seyfert sub-types (1.5, 1.8, and 1.9) since broad lines can be easily lost in the noise. However, given that these are all local Seyfert galaxies, generally, S/N ratios are good even for the SDSS spectra. The observed variability of the broad H line is substantial and the overall trend is for a weaker broad H line in Keck, partially due to selection effects (see discussion below).
For a more quantitative determination of Seyfert type, we used the H broad/narrow peak-flux ratios and compared them to the visual classification. The reason for choosing peak-flux ratios are threefold. (i) Using flux ratios eliminates uncertainties on absolute flux calibration. Moreover, compared to integrated flux ratios, (ii) peak-flux ratios are essentially driving the visual classification scheme; and (iii) the width of the broad H line can have large uncertainties and depends strongly on the placement of the continuum. Depending on the signal-to-noise (S/N) of the data, it can easily be either lost in the noise or noise can be fitted as a broad H line. Thus, integrated-flux ratios are more uncertain than peak-flux ratios.
While there is scatter between these two different classification approaches, we determined cutoffs in the H broad/narrow peak flux ratios by minimizing the number of outliers. For a peak-flux ratio 1.25 there is an 83% chance that the object is a type-1, for 1.25 peak-flux ratio 0.6, there is a 67% chance that the object is a type-1.5, and for a peak-flux ratio 0.6 there is a 72% change that the object is a type-1.8. All type-1.9 objects have a peak-flux ratio of 0, since there is no broad H component. Below (Section IV.1), we discuss the results based on both visual classification as well as peak-flux ratios. The peak-flux ratios are given in Table 4.
| Type | Description |
|---|---|
| (1) | (2) |
| Type-1 | Both broad and narrow components in all Balmer lines. |
| Type-1.5 | Broad and narrow components can be identified in H and H. Broad component of higher order Balmer lines are weakening. |
| Type-1.8 | Broad H is weak but detectable. No higher order Balmer lines have a broad component. |
| Type-1.9 | Shows broad H but no higher order Balmer lines have a broad component. |
| Type-2 | No broad emission lines. |
IV. Results and Discussion
IV.1. Seyfert-Type Transitions
Based on our visual classifications, at least some degree of type transition is exhibited by 39/102 objects (3910%). To quantify the “magnitude” of the transition, we assign a value between +4 and 4 in increments of 1, with a positive value if the broad H line weakened between SDSS and Keck. Type changes of +4 indicate a full type transition from type-1 to 2; +3 indicates the object transitioned three types (e.g., 1 to 1.9); +2 indicates a transition of two types (e.g., 1 to 1.8); and +1 indicates a transition of one type (e.g., 1 to 1.5); 0 indicates that the object did not experience a Seyfert-type change. A negative value implies that the H line increased between SDSS and Keck. Figure 1 shows the distribution of the type transitions quantified in this way.

While there are type transitions in either direction, there are more objects that transition towards a narrower/weaker broad H line in Keck (transition towards type-2) which is likely a reflection of our sample selection, since only Seyfert galaxies with a broad H component were selected from SDSS (Bennert et al., 2011; Harris et al., 2012). Of the 39 objects with a type transition, the majority (31) experiences only a minor type change (1 magnitude transition), while eight underwent greater type changes of 2. One object (0847+1824) demonstrated a type transition of magnitude 3. We consider three objects (3% of the sample) extreme objects since they all show cases of a disappearing broad H line between SDSS and Keck. We discuss them in detail in Section IV.3. There is no correlation between the magnitude of the type transition and the time between observations, indicating that a Seyfert-type change happens on shorter time scales than those covered by our observations (6.41.8 years).
If we instead use our peak-flux ratio cutoffs, as discussed in Section IV.1, to classify the Seyfert type, the results change only slightly. 46/102 objects undergo a type transition, with the majority (39) experiencing only a minor type change (1 magnitude transition), while 7 underwent greater type changes of 2. However, we consider the visual classification more reliable, and it is also commonly used in the literature. Thus, in the following we refer to the visual classification.
As outlined in the introduction, AGN type changes have previously been observed in the literature and are often referred to as ”changing-look” AGNs (see, e.g., Denney et al., 2014; LaMassa et al., 2015; Runnoe et al., 2016, and references therein); indeed, the frequency and strength of our observed H emission line variability is in line with one of the first studies on this topic (Rosenblatt et al., 1994).
Two common explanations of type transitions are variable accretion and variable obscuration. Variable accretion, caused by fluctuating amounts of gas available to feed the BH (Bochkarev, 2006), results in a change of the continuum flux and subsequently in a change of the broad H emission line flux, since the BLR clouds are photoionized by the UV continuum. There are many papers citing variable accretion as the driving force behind Seyfert-type transitions (Eracleous & Halpern, 2001; Trippe et al., 2008; Shappee et al., 2014; Denney et al., 2014). Denney et al. (2014) is the most notable example reporting Mrk 590 to transition from type-1.5 to type-1, then transition again to type1.9-2. Shappee et al. (2014) (for NGC 2617), Trippe et al. (2008) (for NGC 2992), and Antonucci & Cohen (1983) (for NGC 4151) report an observed change in X-ray flux that is followed by a similar change in UV/optical flux. Variable extinction can occur when dusty clouds pass our line-of-sight. For Seyfert galaxies, the source of this obscuration is likely the dusty torus, thought to surround the BLR in the framework of the standard unified model. The individual cold gas clouds of the dusty torus are not all identical and uniform, so different gas clouds could shield different amounts of continuum and H flux.
The disappearance of broad lines as seen in 3% of our sample (discussed in detail in Section IV.3) has also been documented before. In particular, Ho & Kim (2009) report that ten of the 94 objects in their local sample ( 11%), selected to investigate relationships between and host galaxy properties using Magellan spectra (3600-6000Å wavelength range), had only narrow lines when the same objects were previously classified as type-1 Seyferts. (Note that Ho & Kim 2009 do not discuss this matter further, since it was not the main purpose of their paper.)
In a sample of 117 changing-look quasar candidates selected from SDSS DR12, Ruan et al. (2015) discovers two new low-redshift quasars (in addition to the one previously found by LaMassa et al. 2015) where both the broad H and continuum luminosity dim over the 57 years in rest-frame time, changing the objects from quasar-like to galaxy-like states. Ruan et al. (2015) argue that the observed change is driven by rapidly decreasing accretion rates.
From a sample of 1011 low-redshift quasars (z 0.63), selected based on repeated photometry from SDSS and Pan-STARRS1 as well as repeated spectra from SDSS and SDSS-III Boss, MacLeod et al. (2015) visually identify ten changing-look quasars, with 4/10 of these objects showing emission lines broadening with at least a one magnitude increase in g-band flux and 5/10 of these objects having disappearing broad emission lines and a decreasing light curve (one of these five objects was discovered by LaMassa et al. 2015). One of these five objects (SDSS J1021+4645) experienced a type transition from type-1 to type-1.9. MacLeod et al. (2015) report significant changes on timescales of 2000-3000 days with broad emission line changes corresponding to continuum changes. Variable accretion and obscuration were both discussed as possible options to explain the observed broad-line changes, and neither possibility was ruled out (MacLeod et al., 2015). A tidal disruption flare event might explain the observed changes behind J0159+0033 (MacLeod et al., 2015; Merloni et al., 2015).
For the purpose of a reverberation mapping campaign, Barth et al. (2015) re-observed AGNs classified as Seyfert-1 galaxies based on SDSS spectra 5-8 years later with the 3m Shane telescope of Lick observatory and noted that for one object (NGC 6423), all emission lines had disappeared, and three other objects (Mrk 474, Mrk 728, and Mrk 1494) changed from Seyfert-1 to Seyfert 1.9. We will discuss possible explanations for such extreme changes in Section IV.3.
IV.2. Quantifying the Observed Broad H-Line Changes
We use several measurements from our spectral decomposition of the H region discussed in Section III.2 to further quantify the observed broad H line changes and explore possible origins, particularly in these four quantities: (i) the second moment of the broad H component () from the model, used to calculate (Bennert et al., 2011, 2015) (ii) the full width at half maximum (FWHM) of the broad H line also sometimes used to calculate (e.g., Shen et al., 2008, 2011)222For a Gaussian profile, FWHMHβ = 2.35. (iii) the flux ratio of the narrow H component and [OIII] lines, H/[OIII] (iv) the peak-flux ratio of the broad and narrow components of the H line, H/H. In Figure 2, we compare these four quantities as derived from the SDSS spectra with those derived from the Keck spectra.

On average, the broad H line is wider in the SDSS spectra than in the Keck spectra, both in (1.070.29) and FWHMHβ (1.080.27) (Table 2). Moreover, the broad H line has more peak flux in the SDSS spectra than in the Keck spectra (1.26 0.12). The broader and stronger H line preferentially in the SDSS spectra is likely attributed to the bias in the sample selection, since only objects with a broad H line were chosen from SDSS.
What is noticeable in the top left panel of Figure 2 is the large scatter: for individual objects, can be almost up to a factor of two different between the two sets of spectra. FHWM follows a similar trend. Reverberation mapping studies have shown that the variability of the line-width in AGNs correlates inversely with the variability of the power-law continuum in a way that it cancels out in the virial product, resulting in a constant measurement, to within 0.05 dex uncertainty (see, e.g., Bentz et al., 2007; Park et al., 2012; Barth et al., 2015). Ruan et al. (2015) also find that for their changing-look quasars, the decrease in luminosity coincides with a broadening of the line widths to preserve the derived . Unfortunately, we cannot test this correlation in this paper, because we derive the host-galaxy free continuum flux from a 2D image decomposition of the SDSS images (Bennert et al., 2015), taken at yet a different time from the two sets of spectra. We consider this approach superior over spectral decomposition, given unknown aperture effects for spectra. (For the same reason, image decomposition based on typically an HST image taken at a different time is also used for reverberation mapped AGNs (e.g., Bentz et al., 2013).) Moreover, the Keck spectra are not absolutely flux calibrated due to typically non-photometric observing conditions. However, using the same continuum flux, derived from the 2D image decomposition, but taking into account the different width of H between the SDSS and Keck spectra, the resulting is on average 0.050.03 dex larger for SDSS spectra. This is small compared to the uncertainty of single-epoch measurements of 0.4 dex. (Note that this includes only the 79 objects from Bennert et al. (2015), since we do not have continuum measurement for the other objects. Also, for obvious reasons, it excludes any object without broad H emission in the Keck spectra.)
The lower left panel of Figure 2 shows that while overall, the H/[OIII] flux ratio as measured in the SDSS spectra is comparable to that in the Keck spectra (on average 1.040.32) with the majority of the objects falling near the unity line, the scatter is large due to some extreme outliers. While the large scatter could partially be due to the change in broad H (as a consequence of the observed Seyfert-type change) effecting the narrow H flux for fitting reasons since the lines are blended, we consider such an effect negligible given the quality of our data and our fitting procedure. More likely, it might indicate that the NLR emission lines are not constant over the timescales of these observations but do indeed reverberate, in line with recent studies by Peterson et al. (2013); Barth et al. (2015).
In the lower right panel of Figure 2, the broad H to narrow H peak-flux ratio varies quite a bit between SDSS and Keck spectra (1.260.12). This reflects the change in the broad H emission line, and, as a consequence, Seyfert type. On average, the broad H line is stronger in the SDSS spectra than in the Keck spectra, most likely due the selection bias. The change in peak-flux ratio can be used as an independent way to classify Seyfert-type transitions, as discussed in Section IV.1.
Reverberation mapping studies have revealed an anti-correlation between broad H width and luminosity (Denney et al., 2009; Park et al., 2012; Barth et al., 2015), which is attributed to the relation between ionizing flux and the local re-processing efficiency of the BLR gas: the H re-processing efficiency is greatest in the outer part of the BLR where the flux from the continuum is lower (Korista & Goad, 2004; Goad & Korista, 2014). Therefore, higher levels of continuum luminosity lead to an increase in emissivity-weighted BLR radius. This so-called breathing effect increases flux for low-velocity line core relative to high-velocity wings, which makes the line profile narrower. BLR breathing occurs on short timescales of days to weeks in response to AGN continuum variations. However, our data do not generally support this special kind of line variability.
Variable accretion and/or variable obscuration are considered the two main causes for a type change. As discussed above, to distinguish between them, the variability in X-ray, UV, and optical is typically studied. However, we do not have X-ray data concurring with the SDSS and Keck spectra. Fig. 3–6 show a qualitative comparison between the change in H and power-law, overlaying the unsubtracted spectra of SDSS and Keck for each object, scaled to [OIII]. There are 41/102 (40%) objects that have a stronger power-law emission in Keck than SDSS, for 17/102 (17%) it is the other way around, and 44/102 (43%) show no notable change. The higher fraction of non-stellar (power-law) continuum in the Keck spectra is explainable by the smaller slit and sharper seeing.
In other words, both the broad H emission line, as well as the power-law continuum, are varying between the two set of spectra. However, when attempting to quantify those changes, we do not find them to be directly correlated. This is not too surprising, since any variation between broad H emission and power-law continuum are offset in time depending on the time-lag of a given object and would not show up at the same time in a single-epoch spectrum (see e.g., Figs. 7 & 8 in Park et al., 2012).
Aperture effects may play a role in our results: Keck spectra (1″1″ square), given the seeing, only include the unresolved emission from BLR, AGN power-law continuum, and NLR, while the SDSS spectra (1.5″ radius circular fiber) may additionally include more extended NLR flux. However, any aperture effect would artificially boost the ratio of broad-to-narrow flux in Keck spectra (both peak and integrated) compared to SDSS spectra, since Keck spectra are restricted to a smaller central area and thus focus on the unresolved emission. Thus, aperture effects cannot explain the opposite trend that we are observing in the majority of objects, namely, that we observe less broad H in the Keck spectra.
We note that a few objects (e.g., 0909+1330, 1312+2628, 1708+2153, 2140+0025) show significantly stronger blue continuum emission (Fig. 3–6). This rise in the blue wavelength range cannot simply be explained by the fact that the Keck spectra were not obtained at parallactic angle since this would have the opposite effect. Similarly, none of the SDSS spectra were taken at large airmasses, with the exception of 2140+0025 that was observed at an airmass of 1.3, which could have reduced the blue wavelengths emission artificially for that object in the SDSS spectrum. To further test whether the rise in the blue wavelengths emission in the Keck spectra compared to SDSS is an artifact of Keck flux calibration, we looked at the spatially-resolved spectra. The rise in the blue continuum is only present in the central spectra within the seeing limits, but not in the outer spectra, suggesting that it is a real trend. A stronger power-law continuum may indeed explain the Seyfert-type change observed for 0909+1330 (from 1.8 in SDSS to 1 in Keck) and 1708+2153 (from 1.5 in SDSS to 1 in Keck). (Note that the other two objects were classified as Seyfert-1 in both spectra). However, as mentioned above, part of this higher fraction of power-law continuum in the Keck spectra can simply be due to the smaller aperture and sharper seeing compared to SDSS.
| Data | Average |
|---|---|
| (1) | (2) |
| 1.07 0.03 | |
| FHWMHβ | 1.08 0.03 |
| H/[OIII] | 1.04 0.03 |
| H/H | 1.26 0.12 |
Note. — Col. (1): Comparison between values derived from the SDSS spectra vs. those derived from the Keck spectra for quantities listed in this column. Col. (2): Average and scatter.
IV.3. Extreme Seyfert-Type Changes
For three objects in the sample, the broad H component was very prominent in the SDSS spectra, but decreased significantly and virtually disappeared in the Keck spectra. All three were re-observed with the 3m Shane telescope of Lick observatory (Scott, 2013). Table 3 summarizes the Seyfert-type changes of these objects. Note that all Keck objects classified conservatively as type-1.9 could be a type-2 object; however, the spectra do not extend to H, so we cannot distinguish between the two. Especially in those cases where the Lick spectrum reveals a type-2 object, it is likely that the object was also a type-2 in the Keck spectrum. Also note that for 1423+2720, the SDSS spectrum has a low S/N which makes it difficult to model the underlying broad H line.
| Object | Class. | Class. | Class. | Notes |
|---|---|---|---|---|
| SDSS | Keck | Lick | ||
| (1) | (2) | (3) | (4) | (5) |
| 0847+1824 | 1 | 1.9 | 2 | Off-centered emission in SDSS image |
| Type-1 also in literature spectrum taken 1.8 years before SDSS | ||||
| 1038+4658 | 1.5 | 1.9 | 1.9 | Off-centered blob in SDSS image |
| 1423+2720 | 1.5 | 1.9 | 1.8 | Low S/N in SDSS spectrum |
Note. — Col. (1): Object (for more details see Table 4). Col. (2): Seyfert-type classification based on SDSS spectrum. Col. (3): Seyfert-type classification based on Keck spectrum. Col. (4): Seyfert-type classification based on Lick spectrum. Col. (5): Notes (see text for further discussion).
The continuum luminosity at 5100Å was compared for all objects in the sample in order to determine if there was a correlation between AGN luminosity and strongly variable objects, but no correlation was found.
For all objects, we carefully searched the literature for other optical spectra. 0847+1824 is the only object for which this search was successful: It was previously observed on 02-28-2004 (MJD 53063), before the SDSS observation, and from that spectrum, the AGN was a type-1 Seyfert (Ho & Kim, 2009).
Apart from variable accretion and/or obscuration, we briefly discuss a few other scenarios which could mimic changes in Seyfert type.
(i) Telescope offset: First of all, we note that apparent Seyfert-type changes could be caused by a slight mis-pointing of the Keck telescope, missing the AGN core and therefore the (bulk of the) broad emission lines. In all cases, the telescope was pointed at the center of the galaxy (as verified by guide star images), assuming that the AGN resides there. For a couple of extreme objects, the AGN might actually be offset from the center, as evidenced by the SDSS images; we will discuss them below. Note that for all objects for which the AGN core and BLR coincide with the center of the galaxy, the possibility of missing the BLR emission due to a telescope offset is negligible, given the seeing (1″ for the Keck observations) and the slit width used (1″, matching the typical seeing), as verified by standard-star observations. Keck telescope guiding is also much more accurate than 1″.
(ii) Galaxy mergers and/or recoiling SMBH: In the course of ongoing galaxy mergers, the AGN can appear offset from the apparent center of the merging system. It is therefore possible that an off-center AGN was captured by the wider, circular SDSS aperture, but missed during subsequent observation by the narrower Keck slit, aligned along the major axis of the galaxy and centered on the galactic nucleus. Alternatively, a rare gravitational wave recoil following the final coalescence of two SMBHs in a merger, can remove the newly formed single SMBH from the center of its host galaxy (e.g., see the review by Sperhake, 2015). The accretion disk and BLR would remain bound, and a recoiling SMBH would therefore appear as an AGN offset from the core of its host galaxy (Komossa, 2012), again leading to the possibility of missing the (bulk of the) BLR in the more narrow (and rectangular) Keck slit.
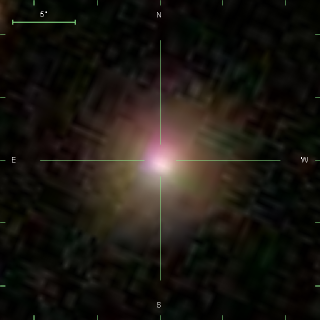
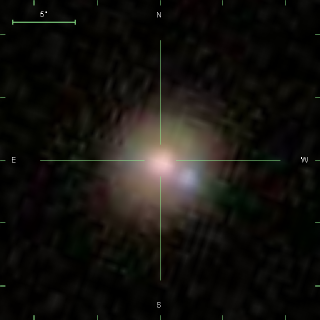
With the exception of a few cases (4/102, see Bennert et al., 2015); there are no signs for merger activity in the sample. However, we caution that merger signatures such as faint tidal tails might easily be missed in the low S/N SDSS images. Objects 0847+1824 and 1038+4658 show extended emission in the SDSS multi-color images, offset from the galaxy center (Fig. D), which might indicate the presence of an ongoing merger. While we cannot exclude the possibility that these are off-center AGNs, it is statistically unlikely to have off-centered AGNs in such a small sample, and follow-up spectroscopy would be needed to test such a scenario further. We note in passing that 0847+1824 seems to show a small kinematic offset between its narrow and broad H line (with the broad H line being blue-shifted by 100km s-1), which is, however, most likely mimicked by the asymmetric broad line profile.
(iii) Supernovae: A type IIn supernova has many of the same spectral features as a Seyfert galaxy (Filippenko, 1997). A nuclear supernova could have therefore mimicked the presence of an AGN. However, supernova spectra including the narrow emission lines evolve rapidly, and we do not see any other signs of dramatic changes in the continuum and narrow emission lines.
(iv) Stellar tidal disruption event: Stars can be tidally disrupted and accreted by SMBHs, producing a luminous accretion flare (e.g., Rees, 1988). If these occur in a gas rich environment, broad and narrow emission lines can be temporarily excited. While a few candidate events for this process have been identified recently from SDSS (e.g., Komossa et al., 2008), these events are rare, and are unlikely to occur in our small sample. In particular, we have checked the long-term Catalina lightcurves of all three sources, and none shows the characteristic lightcurve decline expected for a typical tidal disruption event.
We are left with mild changes in accretion or extinction as most likely explanation for the three changing-look AGN in our sample. Future spectroscopic monitoring of emission-line and continuum changes will enable us to distinguish between both possibilities. (Note that a difference in aperture between Keck and SDSS cannot explain the extreme Seyfert-type changes we observe in these three objects since it would have the opposite effect.)
IV.4. Comparison with the Catalina Sky Survey
To further shed light on the causes for the observed variability, we considered the optical light curves in the Catalina Sky Survey (CSS) (Drake et al., 2009). With the exception of 1104+4334 and 1206+4244, all objects in our sample are in the CSS archive. (Note that 1605+3305 is in the archive, but it does not have a light curve available.) For most objects, CSS light curves begin after the SDSS observations, but extend past the time of the Keck and Lick observations; the light curves start and end at approximately 5350056500 MJD (3000 days). The light curves of seven objects (0310-0049, 0904+5536, 1147+0902, 1355+3834, 1434+4839, 1535+5754, 1557+0830)333Note that 0301+0110 shows a highly variable light-curve, but upon further inspection, it becomes clear that that is an artifact of a bright nearby star. reveal large variability (0.5-1mag in one object) over time-scales from days to months to years. None of these objects are amongst our extreme subset of objects (see Table 4 for Seyfert types).
Since CSS photometry is aperture based (Drake et al., 2009), we cannot exclude that a variable seeing can mimic variability since more or less of the host galaxy would be included in an aperture centered on the AGN. However, especially the extreme variability in these seven objects is unlikely to be purely a seeing effect. Independent analysis, which is beyond the scope of this paper, is needed to further confirm the observed variability.
V. Summary
In this paper, we study the broad H emission-line variability in a sample of 102 local Seyfert-1 galaxies, selected from SDSS and re-observed 3-9 (on average 6.41.8) years later with LRIS on the 10m Keck-I telescope.
In the year time-frame between observations, 67/102 (66%) objects show at least some form of variability of either width and/or strength of the broad H line. For 39/102 (38%) objects, this variability is significant enough to result in a change in Seyfert type, following the standard Seyfert classification scheme. There is no correlation between the time between observations and the degree of the observed Seyfert-type transition, implying that the transitions happen on shorter time scales. Short-time variability on the scale of days and weeks is known for low-mass AGNs from reverberation mapping. Almost all objects (99/102) were observed as part of the CSS with 7/102 (7%) displaying significant variability on time scales of days to weeks.
Three (3%) objects are extreme cases for which the broad H component almost completely disappears. We discuss possible origins for these transitions. For two of these objects (0847+1824 and 1038+4658), SDSS images reveal extended emission off-centered from the galaxy center that could have been included in the SDSS spectra, but missed by the smaller-area Keck slit centered on the galaxy.
The study presented here is the first to provide statistical information on the frequency and strength of H line variability in a sample of low-redshift Seyfert galaxies.
Appendix A Table of Observations and Seyfert-Type Classification
| Object | R.A. | Dec. | z | Date | Class. | Date | Class. | Exp. time | Diff. | Date | Class. |
|---|---|---|---|---|---|---|---|---|---|---|---|
| (J2000) | (J2000) | SDSS | SDSS | Keck | Keck | Keck [s] | years | Lick | Lick | ||
| (1) | (2) | (3) | (4) | (5) | (6) | (7) | (8) | (9) | (10) | (11) | (12) |
| 00130951 | 00 13 35.38 | 09 51 20.9 | 0.062 | 08-17-2001 | 1 | 09-20-2009 | 1.5 | 600 | 8.09 | ||
| (52138) | (55094) | ||||||||||
| 0026+0009 | 00 26 21.29 | +00 09 14.9 | 0.060 | 08-26-2000 | 1 | 09-20-2009 | 1 | 1600 | 9.07 | ||
| (51782) | (55094) | ||||||||||
| 0038+0034 | 00 38 47.96 | +00 34 57.5 | 0.081 | 09-06-2000 | 1 | 09-20-2009 | 1.5 | 600 | 9.04 | ||
| (51793) | (55094) | ||||||||||
| 0109+0059 | 01 09 39.01 | +00 59 50.4 | 0.093 | 09-07-2000 | 1.5 | 09-20-2009 | 1.5 | 600 | 9.04 | ||
| (51794) | (55094) | ||||||||||
| 01210102 | 01 21 59.81 | 01 02 24.4 | 0.054 | 09-02-2000 | 1.5 | 01-21-2009 | 1 | 1200 | 8.39 | ||
| (51789) | (54852) | ||||||||||
| 0150+0057 | 01 50 16.43 | +00 57 01.9 | 0.085 | 09-06-2000 | 1 | 09-20-2009 | 1 | 600 | 9.04 | ||
| (51793) | (55094) | ||||||||||
| 02060017 | 02 06 15.98 | 00 17 29.1 | 0.043 | 09-25-2000 | 1 | 01-22-2009 | 1 | 1200 | 8.33 | ||
| (51812) | (54853) | ||||||||||
| 0212+1406 | 02 12 57.59 | +14 06 10.0 | 0.062 | 12-05-2000 | 1 | 09-20-2009 | 1 | 600 | 8.79 | ||
| (51883) | (55094) | ||||||||||
| 0301+0110 | 03 01 24.26 | +01 10 22.5 | 0.072 | 09-30-2000 | 1.5 | 09-20-2009 | 1.5 | 600 | 8.97 | ||
| (51817) | (55094) | ||||||||||
| 0301+0115 | 03 01 44.19 | +01 15 30.8 | 0.075 | 09-30-2000 | 1 | 09-20-2009 | 1 | 600 | 8.97 | ||
| (51817) | (55094) | ||||||||||
| 03100049 | 03 10 27.82 | 00 49 50.7 | 0.080 | 12-15-2001 | 1 | 09-20-2009 | 1 | 600 | 7.76 | ||
| (52258) | (55094) | ||||||||||
| 03360706 | 03 36 02.09 | 07 06 17.1 | 0.097 | 12-31-2000 | 1.8 | 09-20-2009 | 1.8 | 2400 | 8.72 | ||
| (51909) | (55094) | ||||||||||
| 03530623 | 03 53 01.02 | 06 23 26.3 | 0.076 | 12-30-2000 | 1.8 | 01-22-2009 | 1 | 1200 | 8.06 | ||
| (51908) | (54853) | ||||||||||
| 0731+4522 | 07 31 26.68 | +45 22 17.4 | 0.092 | 11-05-2004 | 1.5 | 09-20-2009 | 1.5 | 600 | 4.87 | ||
| (53314) | (55094) | ||||||||||
| 0735+3752 | 07 35 21.19 | +37 52 01.9 | 0.096 | 11-29-2000 | 1.5 | 09-20-2009 | 1.8 | 600 | 8.81 | ||
| (51877) | (55094) | ||||||||||
| 0737+4244 | 07 37 03.28 | +42 44 14.6 | 0.088 | 01-31-2004 | 1.5 | 09-20-2009 | 1.5 | 600 | 5.64 | ||
| (53035) | (55094) | ||||||||||
| 0802+3104 | 08 02 43.40 | +31 04 03.3 | 0.041 | 01-02-2003 | 1 | 01-21-2009 | 1 | 1200 | 5.97 | ||
| (52641) | (54852) | ||||||||||
| 0811+1739 | 08 11 10.28 | +17 39 43.9 | 0.065 | 12-18-2004 | 1.5 | 03-15-2010 | 1 | 2700 | 5.24 | ||
| (53357) | (55270) | ||||||||||
| 0813+4608 | 08 13 19.34 | +46 08 49.5 | 0.054 | 11-29-2000 | 1.8 | 01-14-2010 | 1 | 1200 | 9.13 | ||
| (51877) | (55210) | ||||||||||
| 0831+0521 | 08 31 07.62 | +05 21 05.9 | 0.035 | 01-07-2003 | 1.8 | 03-15-2010 | 1.9 | 600 | 7.18 | ||
| (52646) | (55270) | ||||||||||
| 0845+3409 | 08 45 56.67 | +34 09 36.3 | 0.066 | 02-02-2003 | 1.5 | 03-14-2010 | 1.5 | 3600 | 7.11 | ||
| (52672) | (55269) | ||||||||||
| 0846+2522 | 08 46 54.09 | +25 22 12.3 | 0.051 | 12-19-2004 | 1.5 | 01-22-2009 | 1.5 | 1200 | 4.09 | ||
| (53358) | (54853) | ||||||||||
| 0847+1824 | 08 47 48.28 | +18 24 39.9 | 0.085 | 12-07-2005 | 1 | 01-21-2009 | 1.9 | 1200 | 3.10 | 01-15-2013 | 2 |
| (53711) | (54852) | (56307) | |||||||||
| 0854+1741 | 08 54 39.25 | +17 41 22.5 | 0.065 | 12-25-2005 | 1.5 | 03-15-2010 | 1 | 600 | 4.22 | ||
| (53729) | (55270) | ||||||||||
| 0857+0528 | 08 57 37.77 | +05 28 21.3 | 0.059 | 01-31-2003 | 1 | 01-15-2010 | 1 | 600 | 6.96 | ||
| (52670) | (55211) | ||||||||||
| 0904+5536 | 09 04 36.95 | +55 36 02.5 | 0.037 | 12-30-2000 | 1.5 | 03-14-2010 | 1.5 | 600 | 9.20 | ||
| (51908) | (55269) | ||||||||||
| 0909+1330 | 09 09 02.35 | +13 30 19.4 | 0.051 | 04-01-2006 | 1.8 | 01-14-2010 | 1 | 600 | 3.79 | ||
| (53826) | (55210) | ||||||||||
| 0921+1017 | 09 21 15.55 | +10 17 40.9 | 0.039 | 02-15-2004 | 1.8 | 01-14-2010 | 1.8 | 700 | 5.91 | ||
| (53050) | (55210) | ||||||||||
| 0923+2254 | 09 23 43.00 | +22 54 32.7 | 0.033 | 12-23-2005 | 1 | 01-15-2010 | 1 | 600 | 4.06 | ||
| (53727) | (55211) | ||||||||||
| 0923+2946 | 09 23 19.73 | +29 46 09.1 | 0.063 | 01-19-2005 | 1.8 | 01-15-2010 | 1.8 | 600 | 4.99 | ||
| (53389) | (55211) | ||||||||||
| 0927+2301 | 09 27 18.51 | +23 01 12.3 | 0.026 | 12-26-2005 | 1.5 | 01-15-2010 | 1.5 | 600 | 4.05 | ||
| (53730) | (55211) | ||||||||||
| 0932+0233 | 09 32 40.55 | +02 33 32.6 | 0.057 | 02-25-2001 | 1.8 | 01-14-2010 | 1.5 | 600 | 8.88 | ||
| (51965) | (55210) | ||||||||||
| 0932+0405 | 09 32 59.60 | +04 05 06.0 | 0.059 | 12-21-2001 | 1.8 | 01-14-2010 | 1.9 | 600 | 8.07 | 03-11-2013 | 1.9 |
| (52264) | (55210) | (56362) | |||||||||
| 0936+1014 | 09 36 41.08 | +10 14 15.7 | 0.060 | 12-20-2003 | 1.5 | 03-15-2010 | 1 | 3600 | 6.23 | ||
| (52993) | (55270) | ||||||||||
| 0938+0743 | 09 38 12.27 | +07 43 40.0 | 0.022 | 04-04-2003 | 1 | 01-14-2010 | 1.8 | 600 | 6.78 | 01-15-2013 | 1.8 |
| (52733) | (55210) | (56307) | |||||||||
| 0948+4030 | 09 48 38.43 | +40 30 43.5 | 0.047 | 03-11-2003 | 1 | 01-15-2010 | 1.8 | 900 | 6.85 | ||
| (52709) | (55211) | ||||||||||
| 1002+2648 | 10 02 18.79 | +26 48 05.7 | 0.052 | 01-22-2006 | 1.8 | 01-15-2010 | 1.9 | 600 | 3.98 | ||
| (53757) | (55211) | ||||||||||
| 1029+1408 | 10 29 25.73 | +14 08 23.2 | 0.061 | 03-11-2004 | 1.5 | 01-15-2010 | 1.5 | 600 | 5.85 | ||
| (53075) | (55211) | ||||||||||
| 1029+2728 | 10 29 01.63 | +27 28 51.2 | 0.038 | 02-28-2006 | 1.8 | 01-15-2010 | 1.8 | 600 | 3.88 | ||
| (53794) | (55211) | ||||||||||
| 1029+4019 | 10 29 46.80 | +40 19 13.8 | 0.067 | 01-29-2004 | 1.5 | 01-14-2010 | 1.5 | 600 | 5.96 | ||
| (53033) | (55210) | ||||||||||
| 1038+4658 | 10 38 33.42 | +46 58 06.6 | 0.063 | 12-12-2002 | 1.5 | 01-14-2010 | 1.9 | 600 | 7.09 | 01-17-2013 | 1.9 |
| (52620) | (55210) | (56309) | |||||||||
| 1042+0414 | 10 42 52.94 | +04 14 41.1 | 0.052 | 03-06-2002 | 1.5 | 04-16-2009 | 1.5 | 1200 | 7.11 | ||
| (52339) | (54937) | ||||||||||
| 1043+1105 | 10 43 26.47 | +11 05 24.3 | 0.048 | 04-20-2004 | 1.8 | 04-16-2009 | 1.8 | 600 | 4.99 | ||
| (53115) | (54937) | ||||||||||
| 1049+2451 | 10 49 25.39 | +24 51 23.7 | 0.055 | 02-26-2006 | 1 | 04-16-2009 | 1 | 600 | 3.13 | ||
| (53792) | (54937) | ||||||||||
| 1058+5259 | 10 58 28.76 | +52 59 29.0 | 0.068 | 01-13-2003 | 1.5 | 01-14-2010 | 1.5 | 600 | 7.00 | ||
| (52652) | (55210) | ||||||||||
| 1101+1102 | 11 01 01.78 | +11 02 48.8 | 0.036 | 04-24-2004 | 1.5 | 04-16-2009 | 1.8 | 600 | 4.98 | ||
| (53119) | (54937) | ||||||||||
| 1104+4334 | 11 04 56.03 | +43 34 09.1 | 0.049 | 02-18-2004 | 1.8 | 01-14-2010 | 1.5 | 600 | 5.91 | ||
| (53053) | (55210) | ||||||||||
| 1110+1136 | 11 10 45.97 | +11 36 41.7 | 0.042 | 03-14-2004 | 1.5 | 03-15-2010 | 1 | 3600 | 6.00 | ||
| (53078) | (55270) | ||||||||||
| 1116+4123 | 11 16 07.65 | +41 23 53.2 | 0.021 | 12-30-2003 | 1.8 | 04-15-2009 | 1.8 | 850 | 5.29 | ||
| (53003) | (54936) | ||||||||||
| 1118+2827 | 11 18 53.02 | +28 27 57.6 | 0.060 | 02-27-2006 | 1.8 | 01-15-2010 | 1.9 | 900 | 3.88 | 03-11-2013 | 1.8 |
| (53793) | (55211) | (56362) | |||||||||
| 1132+1017 | 11 32 49.28 | +10 17 47.4 | 0.044 | 05-22-2003 | 1.5 | 01-15-2010 | 1 | 600 | 6.65 | ||
| (52781) | (55211) | ||||||||||
| 1137+4826 | 11 37 04.17 | +48 26 59.2 | 0.054 | 01-03-2003 | 1.5 | 01-14-2010 | 1.5 | 600 | 7.03 | ||
| (52642) | (55210) | ||||||||||
| 1139+5911 | 11 39 08.95 | +59 11 54.6 | 0.061 | 05-15-2002 | 1 | 01-14-2010 | 1 | 600 | 7.67 | ||
| (52409) | (55210) | ||||||||||
| 1140+2307 | 11 40 54.09 | +23 07 44.4 | 0.035 | 05-21-2006 | 1.8 | 01-15-2010 | 1.8 | 1200 | 3.66 | 01-13-2013 | 2 |
| (53876) | (55211) | (56305) | |||||||||
| 1143+5941 | 11 43 44.30 | +59 41 12.4 | 0.063 | 05-17-2002 | 1.5 | 03-14-2010 | 1 | 3000 | 7.82 | ||
| (52411) | (55269) | ||||||||||
| 1144+3653 | 11 44 29.88 | +36 53 08.5 | 0.038 | 03-13-2005 | 1 | 04-16-2009 | 1 | 600 | 4.09 | ||
| (53442) | (54937) | ||||||||||
| 1145+5547 | 11 45 45.18 | +55 47 59.6 | 0.053 | 04-30-2003 | 1 | 03-14-2010 | 1 | 3600 | 6.87 | ||
| (52759) | (55269) | ||||||||||
| 1147+0902 | 11 47 55.08 | +09 02 28.8 | 0.069 | 05-01-2003 | 1.5 | 01-15-2010 | 1.5 | 600 | 6.71 | ||
| (52760) | (55211) | ||||||||||
| 1205+4959 | 12 05 56.01 | +49 59 56.4 | 0.063 | 06-17-2002 | 1.8 | 01-14-2010 | 1.8 | 600 | 7.58 | ||
| (52442) | (55210) | ||||||||||
| 1206+4244 | 12 06 26.29 | +42 44 26.1 | 0.052 | 04-25-2004 | 1 | 03-14-2010 | 1 | 1100 | 5.88 | ||
| (53120) | (55269) | ||||||||||
| 1210+3820 | 12 10 44.27 | +38 20 10.3 | 0.023 | 04-13-2005 | 1.5 | 04-16-2009 | 1.5 | 600 | 4.01 | ||
| (53473) | (54937) | ||||||||||
| 1216+5049 | 12 16 07.09 | +50 49 30.0 | 0.031 | 05-19-2002 | 1.8 | 03-14-2010 | 1.8 | 900 | 6.82 | ||
| (52413) | (55269) | ||||||||||
| 1223+0240 | 12 23 24.14 | +02 40 44.4 | 0.024 | 01-09-2002 | 1 | 03-15-2010 | 1 | 600 | 8.18 | ||
| (52283) | (55270) | ||||||||||
| 1228+0951 | 12 28 11.41 | +09 51 26.7 | 0.064 | 04-02-2003 | 1.8 | 03-15-2010 | 1.8 | 600 | 6.95 | ||
| (52731) | (55270) | ||||||||||
| 1231+4504 | 12 31 52.04 | +45 04 42.9 | 0.062 | 02-27-2004 | 1.5 | 01-15-2010 | 1.5 | 1200 | 5.88 | ||
| (53062) | (55211) | ||||||||||
| 1241+3722 | 12 41 29.42 | +37 22 01.9 | 0.063 | 04-02-2006 | 1.5 | 01-15-2010 | 1.5 | 800 | 3.79 | ||
| (53827) | (55211) | ||||||||||
| 1246+5134 | 12 46 38.74 | +51 34 55.9 | 0.067 | 04-15-2002 | 1.8 | 01-15-2010 | 1.5 | 600 | 7.75 | ||
| (52379) | (55211) | ||||||||||
| 12500249 | 12 50 42.44 | 02 49 31.5 | 0.047 | 03-29-2001 | 1.5 | 04-16-2009 | 1.8 | 1200 | 8.05 | ||
| (51997) | (54937) | ||||||||||
| 1306+4552 | 13 06 19.83 | +45 52 24.2 | 0.051 | 04-22-2004 | 1 | 03-14-2010 | 1.5 | 3600 | 5.89 | ||
| (53117) | (55269) | ||||||||||
| 1307+0952 | 13 07 21.93 | +09 52 09.3 | 0.049 | 05-29-2006 | 1.8 | 03-15-2010 | 1.5 | 2400 | 3.79 | ||
| (53884) | (55270) | ||||||||||
| 1312+2628 | 13 12 59.59 | +26 28 24.0 | 0.060 | 02-28-2006 | 1 | 03-14-2010 | 1 | 2700 | 4.04 | ||
| (53794) | (55269) | ||||||||||
| 1313+3653 | 13 13 48.96 | +36 53 57.9 | 0.067 | 03-21-2006 | 1.8 | 03-14-2010 | 1.8 | 600 | 3.98 | ||
| (53815) | (55269) | ||||||||||
| 1323+2701 | 13 23 10.39 | +27 01 40.4 | 0.056 | 03-01-2006 | 1.8 | 04-16-2009 | 1.8 | 700 | 3.13 | ||
| (53795) | (54937) | ||||||||||
| 1353+3951 | 13 53 45.93 | +39 51 01.6 | 0.063 | 02-26-2004 | 1.8 | 03-14-2010 | 1.9 | 600 | 6.05 | 03-12-2013 | 1.8 |
| (53061) | (55269) | (56363) | |||||||||
| 1355+3834 | 13 55 53.52 | +38 34 28.5 | 0.050 | 03-31-2005 | 1.8 | 04-16-2009 | 1.8 | 300 | 4.04 | ||
| (53460) | (54937) | ||||||||||
| 14050259 | 14 05 14.86 | 02 59 01.2 | 0.054 | 06-18-2002 | 1 | 04-16-2009 | 1 | 1600 | 6.83 | ||
| (52443) | (54937) | ||||||||||
| 1416+0317 | 14 16 30.82 | +01 37 07.9 | 0.054 | 03-26-2001 | 1.5 | 03-15-2010 | 1.8 | 2700 | 8.97 | ||
| (51994) | (55270) | ||||||||||
| 1419+0754 | 14 19 08.30 | +07 54 49.6 | 0.056 | 06-12-2005 | 1.8 | 04-16-2009 | 1.8 | 900 | 3.84 | ||
| (53533) | (54937) | ||||||||||
| 1423+2720 | 14 23 38.43 | +27 20 09.7 | 0.064 | 05-26-2006 | 1.5 | 03-14-2010 | 1.9 | 1200 | 3.80 | 03-12-2013 | 1.8 |
| (53881) | (55269) | (56363) | |||||||||
| 1434+4839 | 14 34 52.45 | +48 39 42.8 | 0.037 | 04-04-2003 | 1 | 04-16-2009 | 1.5 | 600 | 6.03 | ||
| (52733) | (54937) | ||||||||||
| 1505+0342 | 15 05 56.55 | +03 42 26.3 | 0.036 | 05-26-2001 | 1.5 | 03-15-2010 | 1.5 | 1200 | 8.80 | ||
| (52055) | (55270) | ||||||||||
| 1535+5754 | 15 35 52.40 | +57 54 09.3 | 0.030 | 03-14-2002 | 1 | 04-15-2009 | 1 | 1200 | 7.09 | ||
| (52347) | (54936) | ||||||||||
| 1543+3631 | 15 43 51.49 | +36 31 36.7 | 0.067 | 08-24-2003 | 1 | 03-15-2010 | 1.5 | 1200 | 6.56 | ||
| (52875) | (55270) | ||||||||||
| 1545+1709 | 15 45 07.53 | +17 09 51.1 | 0.048 | 06-03-2006 | 1.8 | 04-15-2009 | 1 | 1200 | 2.57 | ||
| (53889) | (54936) | ||||||||||
| 1554+3238 | 15 54 17.42 | +32 38 37.6 | 0.048 | 07-05-2003 | 1.5 | 04-15-2009 | 1.5 | 1200 | 5.78 | ||
| (52825) | (54936) | ||||||||||
| 1557+0830 | 15 57 33.13 | +08 30 42.9 | 0.047 | 08-11-2004 | 1.5 | 04-15-2009 | 1.5 | 1200 | 4.68 | ||
| (53228) | (54936) | ||||||||||
| 1605+3305 | 16 05 02.46 | +33 05 44.8 | 0.053 | 05-17-2004 | 1 | 04-15-2009 | 1 | 1200 | 4.91 | ||
| (53142) | (54936) | ||||||||||
| 1606+3324 | 16 06 55.94 | +33 24 00.3 | 0.059 | 05-19-2004 | 1.5 | 04-15-2009 | 1.5 | 1200 | 4.91 | ||
| (53144) | (54936) | ||||||||||
| 1611+5211 | 16 11 56.30 | +52 11 16.8 | 0.041 | 05-22-2001 | 1.5 | 04-15-2009 | 1.8 | 1200 | 7.95 | ||
| (52051) | (54936) | ||||||||||
| 1636+4202 | 16 36 31.28 | +42 02 42.5 | 0.061 | 06-23-2001 | 1 | 03-14-2010 | 1 | 1200 | 8.72 | ||
| (52083) | (55269) | ||||||||||
| 1647+4442 | 16 47 21.47 | +44 42 09.7 | 0.025 | 05-22-2001 | 1.8 | 03-14-2010 | 1.5 | 4200 | 8.81 | ||
| (52051) | (55269) | ||||||||||
| 1655+2014 | 16 55 14.21 | +20 14 42.0 | 0.084 | 06-13-2004 | 1.8 | 09-20-2009 | 1.8 | 600 | 5.27 | ||
| (53169) | (55094) | ||||||||||
| 1708+2153 | 17 08 59.15 | +21 53 08.1 | 0.072 | 06-21-2004 | 1.5 | 09-20-2009 | 1 | 600 | 5.25 | ||
| (53177) | (55094) | ||||||||||
| 2116+1102 | 21 16 46.33 | +11 02 37.3 | 0.081 | 07-13-2002 | 1.8 | 09-20-2009 | 1.8 | 700 | 7.19 | ||
| (52468) | (55094) | ||||||||||
| 2140+0025 | 21 40 54.55 | +00 25 38.2 | 0.084 | 07-10-2002 | 1 | 09-20-2009 | 1 | 600 | 7.20 | ||
| (52465) | (55094) | ||||||||||
| 22150036 | 22 15 42.29 | 00 36 09.6 | 0.099 | 09-04-2000 | 1 | 09-20-2009 | 1 | 600 | 9.04 | ||
| (51791) | (55094) | ||||||||||
| 22210906 | 22 21 10.83 | 09 06 22.0 | 0.091 | 10-21-2001 | 1 | 09-20-2009 | 1 | 600 | 7.92 | ||
| (52203) | (55094) | ||||||||||
| 22220819 | 22 22 46.61 | 08 19 43.9 | 0.082 | 10-24-2001 | 1.5 | 09-20-2009 | 1.5 | 700 | 7.91 | ||
| (52206) | (55094) | ||||||||||
| 2233+1312 | 22 33 38.42 | +13 12 43.5 | 0.093 | 09-04-2002 | 1 | 09-20-2009 | 1.5 | 800 | 7.04 | ||
| (52521) | (55094) | ||||||||||
| 2254+0046 | 22 54 52.24 | +00 46 31.4 | 0.091 | 09-02-2000 | 1 | 09-20-2009 | 1 | 600 | 9.05 | ||
| (51789) | (55094) | ||||||||||
| 2327+1524 | 23 27 21.97 | +15 24 37.4 | 0.046 | 11-25-2001 | 1.5 | 09-20-2009 | 1.8 | 600 | 7.82 | ||
| (52238) | (55094) | ||||||||||
| 2351+1552 | 23 51 28.75 | +15 52 59.1 | 0.096 | 11-13-2001 | 1.8 | 09-20-2009 | 1.8 | 600 | 7.85 | ||
| (52226) | (55094) |
Note. — Col. (1): Target ID based on R.A. and Dec. used throughout the text. Col. (2): Right ascension. Col. (3): Declination. Col. (4): Redshift from SDSS-DR7. Col. (5): Date SDSS spectrum was taken (with Modified Julian Date (MJD) in brackets). Col. (6): Seyfert-type classification based on SDSS spectrum. Col. (7): Date Keck spectrum was taken (with MJD in brackets). Col. (8): Seyfert-type classification based on Keck spectrum. Note that because Keck spectra do not extend to H, we cannot differentiate between type-1.9 and type-2, and conservatively classify these objects in question as type-1.9. Col. (9): Exposure time of Keck observations in seconds. Note that the exposure time for all SDSS spectra is 54 seconds. Col. (10): Time between SDSS and Keck observations in years. Col. (11): Date Lick spectrum was taken (with MJD in brackets). Col. (12): Seyfert-type classification based on Lick spectrum.
| Object | flux | H flux | H peak flux | FeII | FWHMHβ | flux | H flux | H peak flux | FeII | |||
|---|---|---|---|---|---|---|---|---|---|---|---|---|
| SDSS | SDSS | SDSS | SDSS | SDSS | SDSS | Keck | Keck | Keck | Keck | Keck | Keck | |
| [km s-1] | [km s-1] | [km s-1] | [km s-1] | |||||||||
| (1) | (2) | (3) | (4) | (5) | (6) | (7) | (8) | (9) | (10) | (11) | (12) | (13) |
| 00130951 | 1783135 | 3462205 | 0.130.02 | 6510 | 81 | Y | 2111211 | 4275594 | 0.170.02 | 202 | 2.050.17 | Y |
| 0026+0009 | 964125 | 2276293 | 0.180.05 | 144 | 2.70.7 | N | 1527227 | 2920765 | 0.260.06 | 102 | 1.40.3 | Y |
| 0038+0034 | 2759133 | 7371321 | 0.080.01 | 23.21.8 | 1.540.09 | N | 3328211 | 7223593 | 0.090.01 | 101 | 0.630.04 | Y |
| 0109+0059 | 1677230 | 3392282 | 0.150.02 | 4.60.8 | 0.700.09 | Y | 1797268 | 3377355 | 0.110.01 | 4.10.8 | 0.610.06 | Y |
| 01210102 | 2070194 | 4069255 | 0.150.03 | 61 | 0.90.2 | Y | 1742106 | 3145145 | 0.100.01 | 110.9 | 1.670.09 | Y |
| 0150+0057 | 1799172 | 4816408 | 0.090.01 | 254 | 2.00.2 | N | 2057129 | 4212242 | 0.070.01 | 14 | 3.70.3 | Y |
| 02060017 | 2514483 | 5054761 | 0.120.03 | 185 | 1.680.18 | Y | 197999 | 4060148 | 0.100.01 | 343 | 4.70.3 | Y |
| 0212+1406 | 1947198 | 3776299 | 0.110.01 | 15.01.9 | 1.60.1 | Y | 1586129 | 2601242 | 0.150.01 | 17.71.7 | 2.60.2 | Y |
| 0301+0110 | 2078226 | 3751370 | 0.470.07 | 4.90.8 | 0.900.08 | Y | 1423160 | 3612442 | 0.420.06 | 6.771.08 | 1.160.11 | Y |
| 0301+0115 | 1510182 | 3928181 | 0.050.01 | 396 | 6.20.5 | Y | 1653105 | 3594200 | 0.090.01 | 16.21.6 | 2.730.17 | Y |
| 03100049 | 1713111 | 3152178 | 0.090.01 | 446 | 2.90.4 | Y | 155869 | 2843153 | 0.080.02 | 7012 | 4.90.8 | Y |
| 03360706 | 3189177 | 6827416 | 0.190.02 | 4.80.4 | 0.320.02 | Y | 2403164 | 7238552 | 0.160.04 | 3.61.3 | 0.240.06 | Y |
| 03530623 | 1725359 | 4209557 | 0.120.03 | 124 | 1.00.2 | Y | 1548225 | 3050312 | 0.130.01 | 204 | 2.120.15 | Y |
| 0731+4522 | 1778107 | 3291260 | 0.180.01 | 3.30.3 | 0.530.03 | N | 1885134 | 3715389 | 0.160.01 | 4.50.5 | 0.720.04 | Y |
| 0735+3752 | 3120303 | 4572712 | 0.180.06 | 73 | 0.370.13 | Y | 3996293 | 8070838 | 0.140.06 | 74 | 0.300.12 | N |
| 0737+4244 | 162474 | 4326133 | 0.220.01 | 3.80.2 | 0.410.02 | N | 169298 | 3361148 | 0.190.01 | 6.20.5 | 0.820.05 | Y |
| 0802+3104 | 2661265 | 5707652 | 0.100.02 | 347 | 2.00.4 | Y | 1772185 | 4430358 | 0.070.01 | 19.51.5 | 1.660.11 | Y |
| 0811+1739 | 177966 | 4325156 | 0.060.01 | 416 | 2.40.3 | Y | 1520150 | 3520253 | 0.110.02 | 319 | 2.60.5 | Y |
| 0813+4608 | 1270197 | 2992471 | 0.080.08 | 57 | 0.30.3 | Y | 143091 | 2483165 | 0.110.01 | 14.01.5 | 1.390.11 | Y |
| 0831+0521 | 1040328 | 1197550 | 0.100.02 | 1.30.6 | 0.320.08 | N | 0.110.06 | [0.06] | [0.32] | N | ||
| 0845+3409 | 2090294 | 3897865 | 0.160.02 | 9.71.7 | 0.690.07 | Y | 1718172 | 2820310 | 0.160.02 | 7.51.2 | 0.690.08 | Y |
| 0846+2522 | 2572244 | 7398410 | 0.090.02 | 203 | 1.040.14 | Y | 3394402 | 8304459 | 0.080.02 | 226 | 0.970.15 | Y |
| 0847+1824 | 1665193 | 3519282 | 0.400.04 | 8.01.1 | 1.190.08 | Y | 0.270.11 | [1.66] | [0.08] | N | ||
| 0854+1741 | 2729353 | 4642602 | 0.160.02 | 5.671.08 | 0.840.11 | Y | 1472269 | 2582563 | 0.220.01 | 51 | 1.360.04 | Y |
| 0857+0528 | 1959193 | 4307282 | 0.170.03 | 224 | 1.80.3 | Y | 1485120 | 349951 | 0.10.01 | 17.01.3 | 1.850.13 | Y |
| 0904+5536 | 264370 | 5724125 | 0.260.02 | 7.80.4 | 0.480.03 | Y | 248336 | 7540182 | 0.220.02 | 7.50.5 | 0.450.03 | Y |
| 0909+1330 | 1721251 | 4023416 | 0.120.02 | 184 | 2.000.19 | Y | 1687138 | 4418148 | 0.190.04 | 45.8 | 4.40.5 | Y |
| 0921+1017 | 2033157 | 4900498 | 0.230.04 | 4.60.9 | 0.310.05 | Y | 2317286 | 4432427 | 0.170.02 | 8.91.4 | 0.710.06 | Y |
| 0923+2254 | 2195254 | 3783545 | 0.510.13 | 4.10.8 | 0.670.15 | Y | 1824265 | 2924668 | 0.240.03 | 9.42.0 | 1.660.19 | Y |
| 0923+2946 | 2686222 | 5946522 | 0.130.02 | 5.91.1 | 0.240.03 | Y | 2936247 | 5650906 | 0.160.02 | 11.21.7 | 0.560.06 | Y |
| 0927+2301 | 2624226 | 7732647 | 0.100.03 | 175 | 1.00.2 | Y | 2112205 | 5377367 | 0.080.01 | 172 | 1.50.1 | Y |
| 0932+0233 | 2407429 | 6863625 | 0.130.01 | 102 | 0.500.04 | Y | 181472 | 4273168 | 0.130.01 | 12.541.04 | 1.050.07 | Y |
| 0932+0405 | 182975 | 5316427 | 0.260.02 | 2.50.2 | 0.240.02 | N | 0.10.4 | [0.41] | [0] | N | ||
| 0936+1014 | 2259153 | 4846228 | 0.090.01 | 9.90.8 | 1.350.07 | Y | 199580 | 3916123 | 0.100.01 | 17.021.07 | 2.800.14 | Y |
| 0938+0743 | 1663190 | 4813684 | 0.140.02 | 112 | 1.040.12 | N | 3723608 | 7110808 | 0.150.12 | 44 | 0.220.17 | N |
| 0948+4030 | 1768225 | 3460258 | 0.170.05 | 124 | 1.20.4 | Y | 3188438 | 6732548 | 0.120.01 | 11.01.8 | 0.570.05 | Y |
| 1002+2648 | 1944184 | 5721433 | 0.120.02 | 4.61.0 | 0.290.04 | Y | 0.120.04 | [2.23] | [0.15] | N | ||
| 1029+1408 | 2031338 | 5264381 | 0.140.02 | 9.82.0 | 0.800.08 | Y | 2456344 | 6499649 | 0.150.01 | 8.71.5 | 0.590.05 | Y |
| 1029+2728 | 2103233 | 4958547 | 0.230.06 | 4.11.5 | 0.320.08 | Y | 154428 | 3634152 | 0.250.03 | 5.071.06 | 0.590.06 | Y |
| 1029+4019 | 2515349 | 5985401 | 0.110.02 | 8.41.5 | 0.640.07 | Y | 2193387 | 5998547 | 0.120.01 | 6.51.3 | 0.520.04 | Y |
| 1038+4658 | 2621322 | 4750302 | 0.100.01 | 9.41.4 | 0.620.06 | Y | 0.100.14 | [2.75] | [0.14] | N | ||
| 1042+0414 | 1569194 | 4064166 | 0.340.03 | 6.61.0 | 0.570.04 | Y | 1518102 | 2724145 | 0.330.03 | 5.60.6 | 0.730.05 | Y |
| 1043+1105 | 2864149 | 6171230 | 0.210.04 | 10.51.7 | 0.610.06 | Y | 231328 | 6597152 | 0.130.01 | 4.70.2 | 0.250.02 | Y |
| 1049+2451 | 2368161 | 5181207 | 0.150.03 | 14.21.8 | 0.970.14 | Y | 2534135 | 5112203 | 0.150.01 | 15.11.2 | 1.040.07 | Y |
| 1058+5259 | 1987400 | 4928940 | 0.070.01 | 185 | 1.240.18 | N | 1896150 | 5372150 | 0.100.01 | 13.31.7 | 0.920.08 | Y |
| 1101+1102 | 2558125 | 6047295 | 0.140.03 | 7.61.2 | 0.620.13 | N | 3949170 | 8349597 | 0.130.01 | 3.50.3 | 0.200.01 | Y |
| 1104+4334 | 1873308 | 4319647 | 0.090.02 | 4.41.3 | 0.310.06 | Y | 1719160 | 4072395 | 0.120.01 | 9.41.2 | 0.840.07 | Y |
| 1110+1136 | 1878206 | 3860400 | 0.140.01 | 10.41.6 | 0.780.05 | Y | 137895 | 2898150 | 0.150.01 | 14.71.5 | 1.680.12 | Y |
| 1116+4123 | 2531294 | 6324692 | 0.250.04 | 10.21.9 | 0.560.07 | N | 3136315 | 6774740 | 0.270.04 | 6.61.3 | 0.390.05 | Y |
| 1118+2827 | 1908136 | 5910498 | 0.210.03 | 3.80.7 | 0.380.05 | N | 0.140.05 | [2.05] | [0.19] | N | ||
| 1132+1017 | 2028147 | 5782345 | 0.100.01 | 7.71.3 | 0.740.09 | Y | 190086 | 5341740 | 0.090.01 | 15.81.4 | 1.630.11 | Y |
| 1137+4826 | 1750357 | 3663647 | 0.340.05 | 5.81.4 | 0.940.14 | Y | 160692 | 3788222 | 0.450.06 | 6.80.9 | 1.000.09 | Y |
| 1139+5911 | 2333158 | 4262218 | 0.160.06 | 204 | 2.20.7 | Y | 2228111 | 3994221 | 0.090.01 | 22.21.7 | 1.730.11 | Y |
| 1140+2307 | 2710235 | 5014668 | 0.100.01 | 8.01.2 | 0.430.05 | N | 3324330 | 6376586 | 0.120.01 | 4.40.6 | 0.240.02 | N |
| 1143+5941 | 2002446 | 5629863 | 0.130.04 | 15.02.7 | 0.770.18 | Y | 1790128 | 5405424 | 0.080.01 | 384 | 2.000.08 | Y |
| 1144+3653 | 3016292 | 8301579 | 0.080.01 | 213 | 0.900.14 | N | 2933205 | 8009145 | 0.080.01 | 16.31.5 | 0.870.05 | N |
| 1145+5547 | 2078422 | 4298611 | 0.100.01 | 143 | 1.180.12 | Y | 1837208 | 4465391 | 0.150.01 | 7.491.06 | 0.710.05 | Y |
| 1147+0902 | 3733226 | 6475563 | 0.140.05 | 133 | 0.90.3 | N | 2896188 | 5285543 | 0.120.01 | 10.91.2 | 0.730.06 | Y |
| 1205+4959 | 3572201 | 8275650 | 0.110.02 | 3.90.4 | 0.240.03 | Y | 2678294 | 5552374 | 0.100.01 | 3.60.5 | 0.310.02 | Y |
| 1206+4244 | 1925167 | 3889211 | 0.150.02 | 243 | 2.40.3 | Y | 161492 | 3800144 | 0.170.02 | 363 | 3.60.3 | Y |
| 1210+3820 | 2499432 | 6413513 | 0.200.04 | 5.91.5 | 0.360.06 | N | 2831148 | 5300392 | 0.200.02 | 8.00.7 | 0.580.04 | Y |
| 1216+5049 | 3329180 | 8923422 | 0.110.02 | 2.30.3 | 0.190.03 | Y | 4487477 | 7810392 | 0.090.01 | 2.10.3 | 0.150.01 | Y |
| 1223+0240 | 2780160 | 5802220 | 0.050.02 | 20744 | 176 | Y | 2306107 | 5051168 | 0.100.01 | 696 | 5.70.4 | Y |
| 1228+0951 | 2289657 | 73031543 | 0.120.07 | 33 | 0.230.14 | Y | 2331456 | 6011495 | 0.120.04 | 3.21.6 | 0.280.10 | Y |
| 1231+4504 | 1551343 | 2872440 | 0.200.03 | 5.51.4 | 1.270.14 | Y | 1555168 | 3325394 | 0.160.02 | 9.11.2 | 1.910.16 | Y |
| 1241+3722 | 182993 | 4320219 | 0.130.02 | 7.90.9 | 0.690.08 | N | 1574100 | 3185197 | 0.110.01 | 6.00.8 | 0.700.07 | Y |
| 1246+5134 | 2402313 | 4403703 | 0.070.05 | 1011 | 0.60.5 | Y | 1141130 | 2270185 | 0.090.01 | 12.01.8 | 1.520.12 | Y |
| 12500249 | 2068323 | 5304732 | 0.170.03 | 92 | 0.890.13 | Y | 2417246 | 5771541 | 0.180.01 | 7.30.9 | 0.610.04 | Y |
| 1306+4552 | 1327148 | 3262237 | 0.150.02 | 183 | 1.90.2 | N | 1892297 | 4129772 | 0.220.04 | 2.80.8 | 0.270.05 | Y |
| 1307+0952 | 1616114 | 3748267 | 0.090.04 | 117 | 0.80.3 | N | 1630165 | 3586249 | 0.140.01 | 12.71.7 | 1.100.09 | N |
| 1312+2628 | 1585171 | 3131256 | 0.120.03 | 3210 | 2.80.5 | Y | 1572150 | 2924345 | 0.220.03 | 366 | 2.950.17 | Y |
| 1313+3653 | 2592217 | 5591402 | 0.140.02 | 4.80.5 | 0.340.03 | Y | 2115264 | 4920347 | 0.130.01 | 4.20.6 | 0.340.02 | Y |
| 1323+2701 | 4266349 | 10123299 | 0.0890.004 | 18.31.7 | 0.790.02 | Y | 2414376 | 5219782 | 0.100.01 | 5.91.2 | 0.540.06 | Y |
| 1353+3951 | 2037121 | 6308537 | 0.190.02 | 4.10.5 | 0.310.02 | N | 0.20.7 | [1.52] | [0.31] | N | ||
| 1355+3834 | 284279 | 5936245 | 0.280.05 | 3.30.3 | 0.360.06 | Y | 4034301 | 6371277 | 0.200.02 | 3.20.3 | 0.220.01 | N |
| 14050259 | 1873212 | 3518549 | 0.210.02 | 132 | 1.480.13 | Y | 1599140 | 2933260 | 0.160.02 | 11.11.4 | 1.480.12 | Y |
| 1416+0317 | 11853251 | 4022589 | 0.120.02 | 5.41.1 | 0.780.09 | Y | 1514233 | 3565550 | 0.110.02 | 2.20.5 | 0.400.05 | Y |
| 1419+0754 | 1940154 | 5517362 | 0.100.02 | 2.90.7 | 0.350.06 | N | 3006371 | 5780529 | 0.100.02 | 3.51.0 | 0.360.07 | Y |
| 1423+2720 | 3428264 | 7873621 | 0.110.03 | 124 | 0.50.1 | Y | 0.080.04 | [2.45] | [0] | Y | ||
| 1434+4839 | 2268171 | 4351534 | 0.080.02 | 357 | 2.70.6 | Y | 173185 | 4475222 | 0.090.01 | 6.00.4 | 0.580.03 | Y |
| 1505+0342 | 2280215 | 5028569 | 0.140.03 | 6.91.3 | 0.830.12 | N | 1956139 | 5782154 | 0.080.01 | 17.81.6 | 1.550.09 | Y |
| 1535+5754 | 2431311 | 4191565 | 0.090.03 | 165 | 1.40.4 | Y | 244293 | 5088127 | 0.080.01 | 16.21.3 | 1.410.07 | Y |
| 1543+3631 | 1527171 | 2849197 | 0.140.02 | 7.11.1 | 1.030.15 | Y | 1820168 | 3831248 | 0.090.01 | 4.00.5 | 0.470.03 | Y |
| 1545+1709 | 2158156 | 5555275 | 0.090.01 | 6.50.6 | 0.520.05 | N | 3588226 | 4612237 | 0.060.01 | 243 | 1.680.14 | N |
| 1554+3238 | 2067104 | 4887246 | 0.140.02 | 7.20.8 | 0.830.11 | N | 2523159 | 4148258 | 0.110.01 | 7.90.7 | 1.040.06 | Y |
| 1557+0830 | 13174214 | 5054185 | 0.180.03 | 11.91.5 | 0.870.09 | Y | 238891 | 4817156 | 0.170.02 | 15.11.4 | 1.090.08 | Y |
| 1605+3305 | 2153101 | 5079230 | 0.060.02 | 5413 | 2.91.0 | Y | 1960272 | 5302637 | 0.100.01 | 335 | 2.030.14 | Y |
| 1606+3324 | 2158170 | 5087393 | 0.100.01 | 3.80.5 | 0.340.04 | N | 205380 | 5088739 | 0.120.01 | 4.40.3 | 0.450.03 | Y |
| 1611+5211 | 1392207 | 3895486 | 0.160.03 | 4.81.1 | 0.710.10 | N | 2515410 | 7695964 | 0.120.03 | 2.91.1 | 0.270.07 | Y |
| 1636+4202 | 2367223 | 6655621 | 0.070.01 | 397 | 3.70.4 | Y | 2492230 | 4542523 | 0.100.01 | 243 | 2.450.19 | Y |
| 1647+4442 | 2227279 | 6228655 | 0.090.02 | 4.81.9 | 1.30.4 | N | 2921246 | 8325214 | 0.200.03 | 214 | 0.770.08 | N |
| 1655+2014 | N | N | ||||||||||
| 1708+2153 | 2829134 | 6055580 | 0.110.01 | 15.21.2 | 1.490.08 | Y | 2402122 | 7359245 | 0.130.02 | 6210 | 6.20.6 | Y |
| 2116+1102 | 279027 | 657764 | 0.09030.0002 | 2.250.02 | 0.18310.0003 | Y | 248442 | 7186248 | 0.0840.005 | 3.630.18 | 0.330.01 | Y |
| 2140+0025 | 1329104 | 2225127 | 0.530.09 | 7.11.1 | 1.470.12 | Y | 111464 | 2155127 | 0.290.04 | 172 | 3.70.4 | Y |
| 22150036 | 1877200 | 3330155 | 0.120.01 | 8.51.1 | 1.580.14 | Y | 163692 | 3966220 | 0.090.01 | 7.30.6 | 1.140.06 | Y |
| 22210906 | 2498394 | 6684539 | 0.100.01 | 214 | 1.200.10 | N | 2375131 | 6012224 | 0.120.01 | 242 | 1.450.11 | Y |
| 22220819 | 181188 | 3327319 | 0.250.02 | 2.50.2 | 0.550.03 | N | 1799168 | 2861343 | 0.20.02 | 2.50.3 | 0.660.03 | Y |
| 2233+1312 | 189766 | 4409236 | 0.190.02 | 6.70.4 | 0.900.06 | N | 2477135 | 5830318 | 0.160.01 | 5.70.5 | 0.530.04 | N |
| 2254+0046 | 1466200 | 2015195 | 0.560.09 | 3.90.8 | 1.260.17 | Y | 859194 | 1398286 | 0.590.07 | 4.71.1 | 1.660.18 | Y |
| 2327+1524 | 3267206 | 4098707 | 0.060.01 | 11.01.6 | 1.100.13 | N | 1924166 | 5807390 | 0.080.02 | 2.00.7 | 0.220.06 | N |
| 2351+1552 | 3533269 | 10437526 | 0.120.01 | 3.60.4 | 0.200.02 | N | 2974144 | 7803394 | 0.110.01 | 6.70.6 | 0.430.03 | N |
Note. — Col. (1): Target ID based on R.A. and Dec. used throughout the text. Col. (2): Second moment of broad H from SDSS spectrum (in km s-1). Col. (3): Full-width at half-maximum of broad H from SDSS spectrum (in km s-1). Col. (4): Integrated flux ratio of H/[OIII] from SDSS spectrum. Col. (5): Integrated flux ratio of H broad/narrow from SDSS spectrum. Col. (6): Peak flux ratio of H broad/narrow from SDSS spectrum. Col. (7): Whether or not FeII was subtracted from the SDSS spectrum during the fitting process. Col. (8): Second moment of broad H from Keck spectrum (in km s-1). Col. (9): Full-width at half-maximum of broad H from Keck spectrum (in km s-1). Col. (10): Integrated flux ratio of H/[OIII] from Keck spectrum. Col. (11): Integrated flux ratio of H broad/narrow from Keck spectrum. Col. (12): Peak flux ratio of H broad/narrow from Keck spectrum. Col. (13): Whether or not FeII was subtracted from the Keck spectrum during the fitting process.
Note that values in brackets are estimated from upper limits on the broad H flux for objects classified as Sy 1.9 or Sy 2, that is without an obvious broad H component. No width (FWHM or ) of broad H is given in those cases. Also note that for object 1655+2014 the signal-to-noise ratio was too low in both SDSS and Keck spectra to produce a reliable fit to the H region. No values are given for this object and it is not included in the quantitative analysis.
Appendix B SDSS vs. Keck Spectra Comparison
Appendix C Fits to SDSS and Keck Spectra
References
- Adelman-McCarthy et al. (2008) Adelman-McCarthy, J. K., Agueros, M. A., Allam, S. S., et al. 2008, ApJ, 175, 297
- Antonucci & Cohen (1983) Antonucci, R. R. J. & Cohen, R. D. 1983, ApJ, 271, 564
- Arcavi et al. (2014) Arcavi, I. , Gal-Yam, A., Sullivan, M., et al. 2014, ApJ, 793, 38
- Aretxaga et al. (1999) Aretxaga, I., Joguet, B., Kunth, D., Melnick, J, & Terlevich, R. J. 1999, ApJ, 519, L123
- Barth et al. (2015) Barth, A. J., Bennert, V. N., Canalizo, G., et al. 2015, ApJS, 217, 26
- Bennert et al. (2011) Bennert, V. N., Auger, M. W., Treu, T., Woo, J. H., Malkan, M. A. 2011, ApJ, 726, 59
- Bennert et al. (2015) Bennert, V. N., Treu, T., Auger, M. W., et al. 2015, ApJ, 809, 20
- Bentz et al. (2007) Bentz, M. C., Denney, K. D., Cackett, E. M., et al. 2007, ApJ, 662, 205
- Bentz et al. (2013) Bentz, M. C., Denney, K. D., Grier, C. J., et al. 2013, ApJ, 767, 149
- Bochkarev (2006) Bochkarev, N. G., 2006, ASPC, 360, 285
- Boroson & Green (1992) Boroson, T. A., & Green, R. F. 1992, ApJS, 80, 109
- Denney et al. (2009) Denney, K. D., Peterson, B. M., Dietrich, M., Vestergaard, M. & Bentz, M. C. 2009, ApJ, 692, 246
- Denney et al. (2014) Denney, K. D., Rosa, G. D., Croxall, K., et al. 2014, ApJ, 796, 134
- Dimitrijević et al. (2007) Dimitrijević, M. S., Popović, L. Č., Kovačević, J., Dačić, M., & Ilić, D. 2007, MNRAS, 374, 1181
- Drake et al. (2009) Drake, A. J., Djorgovski, S. G., Mahabal, A., et al. 2009, ApJ, 696, 870
- Elitzur, Ho, & Trump (2014) Elitzur, M., Ho, L. C., & Trump, J. R. 2014, MNRAS, 438, 3340
- Eracleous & Halpern (2001) Eracleous, M., & Halpern, J. P. 2001, ApJ, 554, 240
- Ferrarese & Merritt (2000) Ferrarese, L., & Merrit, D. 2000, ApJ, 539, L9
- Filippenko (1997) Filippenko, A. V. 1997, ARA&A, 35, 309
- Gebhardt et al. (2000) Gebhardt, K., Bender, R., Bower, G., et al. 2000, ApJ, 539, L13
- Goad & Korista (2014) Goad, M. R. & Korista, K. T. 2014, MNRAS, 444, 43
- Goodrich (1989) Goodrich, R. W., 1989, ApJ, 340, 190
- Graham (2016) Graham, A. 2016, Galactic Bulges, Astrophysics and Space Science Library, Volume 418, E. Laurikainen, R.F. Peletier, and D.A. Gadotti (eds.), Springer Publishing
- Harris et al. (2012) Harris, C. E., Bennert, V. N., Auger, M. W., et al. 2012, ApJS, 201, 29
- Hicks & Malkan (2008) Hicks, E. K. S., & Malkan, M. A. 2008, ApJS, 174, 31
- Ho & Kim (2009) Ho, L. C., & Kim, M. 2009, ApJS, 184, 398
- Kaspi et al. (2005) Kaspi, S., Maoz, D., Netzer, H., et al. 2005, ApJ, 629, 61
- Kollatschny & Fricke (1985) Kollatschny, W. & Fricke, K. J., 1985, A&A, 146, L11
- Komossa (2012) Komossa, S., 2012, Advances in Astronomy, Vol. 2012, id. 364973
- Komossa et al. (2008) Komossa, S., Zhou, H., Wang, T., et al., 2008, ApJ, 678, L13
- Korista & Goad (2004) Korista, K. T. & Goad, M. R. 2004, ApJ, 606, 749
- Kormendy & Ho (2013) Kormendy, J., & Ho, L. C. 2013, ARAA, 51, 511
- Kormendy & Richstone (1995) Kormendy, J., & Richstone D. 1995, ARA&A, 33, 581
- Kovacevic et al. (2010) Kovacevic J., Popovic L.C., Dimitrijevic M.S. 2010, ApJS, 189, 15
- LaMassa et al. (2015) LaMassa, S. M., Cales, S., Moran, E. C., et al. 2015, ApJ, 800, 144
- Leighly et al. (2015) Leighly, K. M., Cooper, E., Grupe, D., et al., 2015, ApJ, 809, L13
- Lyutyi, Oknyanskii & Chuvaev (1984) Lyutyi, V. M., Oknyanskii, V. L., & Chuvaev, K. K. 1984, SvAL, 10, 335
- MacLeod et al. (2015) MacLeod, C. L., Ross, N. P., Lawrence, A. et al. 2015, ApJ, submitted (arXiv:1509.08393)
- Magorrian et al. (1998) Magorrian, J., Tremaine, S., Richstone, D. et al. 1998, AJ, 115, 2285
- McGill et al. (2008) McGill, K. L., Woo, J. H., Treu, T., & Malkan, M. A. 2008, ApJ, 673, 703
- Merloni et al. (2015) Merloni, A., Dwelly, T., Salvato, M., et al. 2015, MNRAS, 452, 69
- Nicastro (2000) Nicastro, F., 2000, ApJ, 530, L65
- Osterbrock (1977) Osterbrock, D. E. 1977, ApJ, 215, 733
- Osterbrock (1981) Osterbrock, D. E. 1981, ApJ, 249, 462
- Osterbrock (1989) Osterbrock, D. E. 1989, Astrophysics of Gaseous Nebulae and Active Galactic Nuclei (University Science Books: Mill Valley)
- Osterbrock & Koski (1976) Osterbrock, D.E., & Koski, A.T. 1976, MNRAS, 176, 61
- Pancoast et al. (2014) Pancoast, A., Brewer, B. J., Treu, T., et al. 2014, MNRAS, 445, 3073
- Park et al. (2012) Park, D., Woo, J. H., Treu, T., et al. 2012 ApJ, 747, 30
- Park et al. (2015) Park, D., Woo, J. H., Bennert, V. N., et al. 2015, ApJ, 799, 164
- Parker et al. (2015) Parker, M. L., Fabian, A. C., Matt, G., et al., 2015, MNRAS, 447, 72
- Penston & Perez (1984) Penston, M. V. & Perez, E. 1984, MNRAS, 211, 33
- Peterson et al. (2013) Peterson, B., Denney, K. D., De Rosa, G., et al. 2013, 779, 2
- Rees (1988) Rees, M.J., 1988, Nature, 333, 523
- Rosenblatt et al. (1994) Rosenblatt, E. I., Malkan, M. A., Sargent, W. L. W., & Readhead, A. C. S. 1994, ApJS, 93, 73
- Ruan et al. (2015) Ruan, J. J., Anderson, S. F., Cales, S. L. et al., 2015, ApJ, submitted (arXiv:1509.03634)
- Runnoe et al. (2016) Runnoe, J. C., Cales, S., Ruan, J. F. et al., 2016, MNRAS, 455, 1691
- Scott (2013) Scott, B. 2013, Time Variation of the Broad H and H Emission Lines in Active Galactic Nuclei, Cal Poly Digital Commons
- Shapovalova, Popovic & Burenkov et al. (2010) Shapovalova, A. I., Popovic, L. C., & Burenkov, A. N. et al. 2010, A&A, 509, A106
- Shappee et al. (2014) Shappee, B. J., Prieto, J. L., Grupe, D., et al. 2014, ApJ, 788, 48
- Shen et al. (2008) Shen, J., Vanden Berk, D. E., Schneider, D. P., Hall, P. B. 2008, ApJ, 135, 928
- Shen et al. (2011) Shen, Y., Richards, G. T., Strauss, M. A., et al. 2011, ApJS, 194, 45
- Sperhake (2015) Sperhake, U., 2015, Astrophysics & Space Science Proceedings, 40, 185
- Storchi-Bergmann et al. (1993) Storchi-Bergmann, T., Baldwin, J. A., & Wilson, A. S. 1993, ApJ, 410, L11
- Tohline & Osterbrock (1976) Tohline, J. E., & Osterbrock, D. E. 1976, ApJ, 210, L117
- Trippe et al. (2008) Trippe, M. L., Crenshaw, D. M., Deo, R., & Dietrich, M. 2008, AJ, 135, 2048
- Valdez et al. (2004) Valdez, F., Gupta, R., Rose, J. A., Singh, H. P., & Bell, D. J. 2004, ApJS, 152, 251
- van der Marel & Franx (1993) van der Marel, R. P. & Franx, M. 1993 ApJ, 407, 525
- van der Marel et al. (1998) van der Marel, R. P., Cretton, N., de Zeeuw, P. T., & Rix, H. 1998, ApJ, 493, 613
- Wandel et al. (1999) Wandel, A., Peterson, B. M., & Malkan, M. A. 1999, ApJ, 526, 579
- Woo et al. (2006) Woo, J. H., Treu, T., Malkan, M. A., & Blanford, R. D. 2006 ApJ, 645, 900
Appendix D SDSS Multi-Color Images for 0847+1824 & 1038+4658