Performance of new 8-inch photomultiplier tube used for the Tibet muon-detector array
Abstract
A new hybrid experiment has been constructed to measure the chemical composition of cosmic rays around the “knee” in the wide energy range by the Tibet AS collaboration at Tibet, China, since 2014. They consist of a high-energy air-shower-core array (YAC-II), a high-density air-shower array (Tibet-III) and a large underground water-Cherenkov muon-detector array (MD). In order to obtain the primary proton, helium and iron spectra and their “knee” positions in the energy range lower than eV, each of PMTs equipped to the MD cell is required to measure the number of photons capable of covering a wide dynamic range of 100 - photoelectrons (PEs) according to Monte Carlo simulations. In this paper, we firstly compare the characteristic features between R5912-PMT made by Japan Hamamatsu and CR365-PMT made by Beijing Hamamatsu. This is the first comparison between R5912-PMT and CR365-PMT. If there exists no serious difference, we will then add two 8-inch-in-diameter PMTs to meet our requirements in each MD cell, which are responsible for the range of 100 - 10000 PEs and 2000 - 1000000 PEs, respectively. That is, MD cell is expected to be able to measure the number of muons over 6 orders of magnitude.
1 Introduction
The energy spectrum of cosmic rays is well described by a power law over a wide energy range covering more than 10 decades; this is regarded as a remarkable feature of the nonthermal acceleration mechanism of high-energy cosmic rays. The power index suddenly steepens from approximately -2.7 to -3.1 at around 4 eV, resulting in a distinctive “knee” shape in the spectrum[1][2]. The origin of the “knee” is an outstanding problem in astroparticle physics[3][4]. A lot of models have been proposed such as a change of acceleration mechanisms at the sources of cosmic rays (supernova remnants, pulsars, etc.), to a single-source assumption or effects due to propagation inside the galaxy (diffusion, drift, escape from the Galaxy), and some unknown new processes in the atmosphere during air-shower development[5][6][7][8][9]. Hence, in order to resolve the origin of the knee, it is needed to observe the break point of the spectral index for individual chemical component[3][10][11].
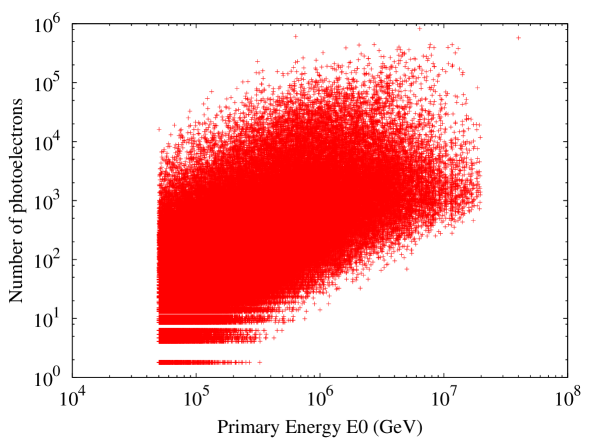
In 2014, an important upgrade of the Tibet AS project was completed. They consist of an air-shower-core array (YAC-II), a high-density air-shower array (Tibet-III) and a large underground water-Cherenkov muon-detector array (MD)[12][13]. For an air shower event, the Tibet-III provides the arrival direction () and the air shower size () which are interrelated to primary energy, the YAC-II measures the high energy electromagnetic particles in the core region so as to obtain the characteristic parameters of air-shower cores, at the same time, the underground MDs record the high-energy muons above 1 GeV. The MD array now consists of 5 pools set up 2.5 meters underground, each with 16 cells, covering a total area of 4500 . Each cell of the MD array is composed of a concrete water tank with a cubic form of 7.2 m wide, 7.2 m long, 1.5 m deep and two 20-inch PMTs (R3600) are mounted downward on the ceiling. The method for obtaining the light-component spectrum of primary cosmic rays at the “knee” energies with the Tibet experiment is described in the paper[12][14]. In order to explicitly observe the break point of the spectrum for individual chemical component, we need to observe primary particles with energy up to eV. According to Monte Carlo simulation, a set of two PMTs in each MD cell is required to measure the number of photons over a wide dynamic range from 100 to photoelectrons (PEs), as shown in Fig.1.
In this paper, we firstly compare the characteristic features between R5912-PMT made by Japan Hamamatsu and CR365-PMT made by Beijing Hamamatsu. This is the first comparison between R5912-PMT and CR365-PMT. Since it is the first time for Beijing Hamamatsu to produce this type of 8-inch-in-diameter PMTs, so it is needed to test the performance of PMTs whether they are intend to satisfy our request, also to provide valuable feedback to the company producing them. Then, we use a set of two PMTs and measure the linearity of the PMT response as a function of the light intensity to meet our requirements.
2 The experimental setup
In order to study the performance of these PMTs, the following quantities have been measured:
1)photoelectron spectra ,
2)gain as a function of high voltage,
3)dark count rate,
4)linearity of PMT output signals,
5)dynamic range of PMT.
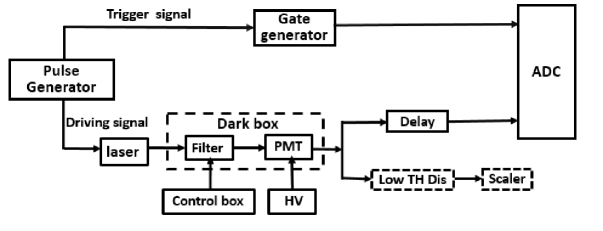
The entire test system is mainly composed of Pulse Generator (Agilent Technologies 81160A), Laser (PiL044SM-SN-513B), Filter, High Voltage power supply (CAEN N1470), Gate Generator (ORTEC GG8020), Low Threshold Discriminator (CAEN N845), Scaler (ORTEC 772 counter), ADC (Lecroy 2249A, the resolution is 0.25 pC/count), and data acquisition (DAQ) computer. The test system is schematically shown in Fig. 2. The light source used for this test was a pico second laser (Pil044SM-SN-513B) which has very narrow pulse width and high stability. Signal frequency applied to the laser is controlled by the pulse generator (fixed) and the light intensity is controlled by the control box (variable). At the same time, the pulse generator generates the NIM signals to use as triggers. Before reaching the PMT, the light passed through neutral density attenuation filters. With different filters, we were able to change the light intensity by more than 5 orders of magnitude. When we measure 1),2), 4)and 5), the signals from the PMT are then fed into a charge-integrating ADC in a camac crate where they are measured and then read out by the DAQ computer; when we measure 3), the signals from the PMT are then fed into a low threshold discriminator and then into a scaler. All the analysis is then done on the computer.
3 Results
Using this test system, the single photoelectron (SPE) spectra, multi photoelectrons spectra, gain as a function of voltage, dark count rate at 1/3 photoelectron (PE) threshold and linearity of PMT output signals are measured for CR365 and R5912. Details of each test are described in the following sections.
3.1 Single photoelectron spectra
In order to get the absolute gain of the PMT at a certain voltage, the SPE spectrum is measured. Fig. 3 shows the SPE spectra for CR365 at 1500 V and R5912 at 1350 V corresponding to 1.5 gain. The first peak is the pedestal and the second peak is due to 1 photoelectron events. To quantify the resolution of the single photoelectron spectrum, the peak to valley ratio is used. The peak to valley ratio is the ratio of the maximum value of the histogram of the SPE spectrum to the minimum value between the pedestal and the maximum. The SPE peak to valley ratio for CR365 and R5912 are both close to 2 which indicate that both PMTs have a good charge resolution for detecting single photoelectron.
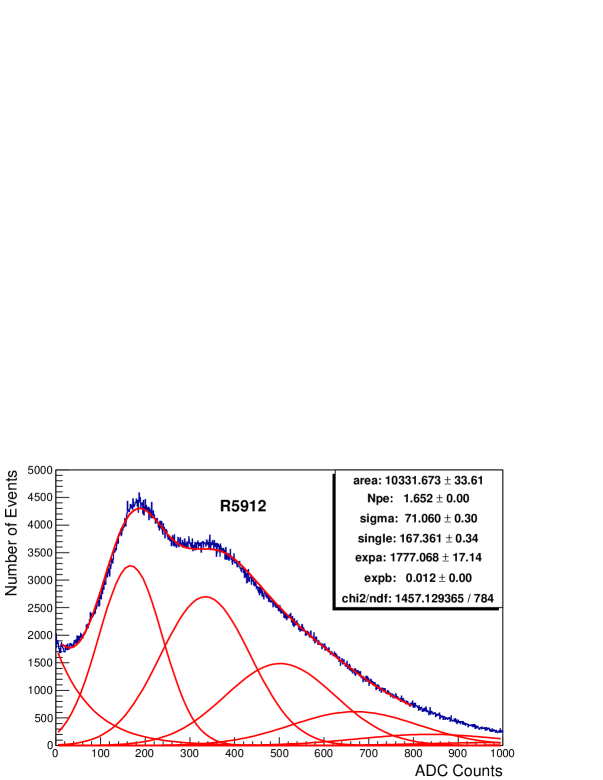
3.2 Multi photoelectron spectra
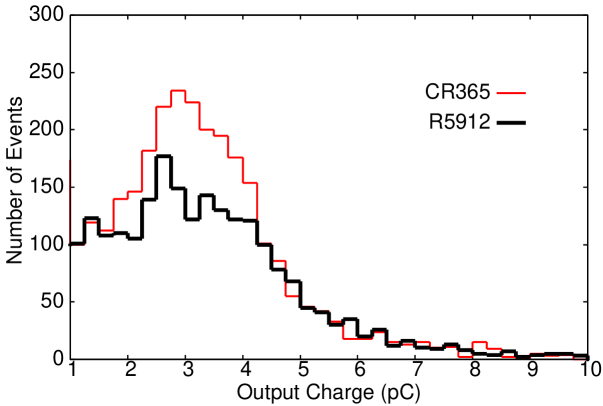
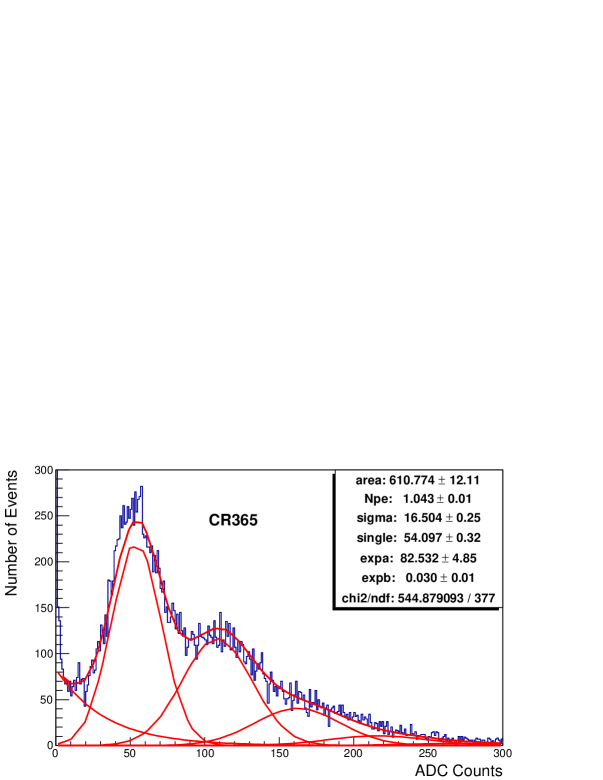
We also measured multiple photoelectrons (multi-PEs) spectra for CR365 and R5912 both at 1800V as shown in Fig. 4 and Fig. 5. Here, the resolution of ADC is 0.25 pC/count. A multi-gaussian fit was carried out in equation (1), is the average multi-PEs number, is standard deviation of multi-PEs, C is the ADC count of multi-PEs[15]. From Fig. 4 and Fig. 5, we find the multi-PEs spectra of CR365 and R5912 can be well reproduced by this multi-gaussian function. It means that both PMTs have a good charge resolution for detecting multi photoelectrons.
| (1) |
3.3 Gain as a function of high voltage
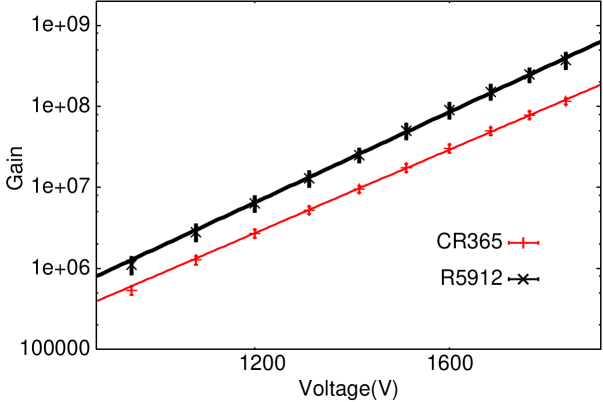
An important feature is the gain curve with respect to the supplied high voltage (HV). To get the gain as a function of high voltage, the laser light intensity has been fixed while the PMT HV has been varied. The relationship between gain (G) and input high voltage (V) is described by
| (2) |
with and to be determined from measurements. The fit parameters are =8.960.10 for R5912, =8.270.06 for CR365, respectively. The absolute gain for each PMT was measured at a known voltage from the SPE spectrum, and this can be used to convert this relative gain measurement into an absolute one. Fig. 6 shows the absolute gain for CR365 and R5912 which is about three times of that CR365 at 1800V.
3.4 Dark count rate
The dark count rate is the rate at which signals above a certain threshold are observed in a PMT while no light incident on the photocathode. There is a correlation between dark pulse rate and the lifetime of a PMT, and the smaller noise of a PMT, the longer its lifetime becomes. To check the dark noise, the data of R5912 and CR365 have been compared. Of course, to know the magnitude of the 1/3 PE threshold for a PMT, the absolute gain of the PMT must be known. The anode dark rate after 2 hours in dark at a gain of 1.5 are both less than 3k Hz when the thresholds are set at 1/3 photoelectron.
3.5 Linearity of PMT
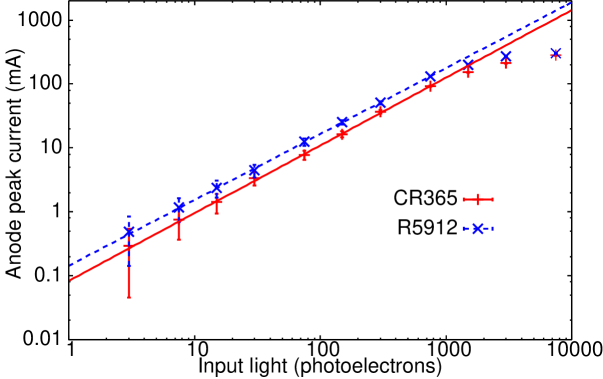
In order to extend the dynamic range of MD from 100 PEs to PEs, the linearity of the PMT output signals is essentially important. In this work, the linearity of R5912 and CR365 is measured by using laser light source and filters as shown in Fig.2. The light intensity is varied by use of different neutral density transmission filters and the corresponding response is fitted with a function y=a where x is the relative transmission. Fig.7 shows the linear behavior for CR365 at 1500V and R5912 at 1350V as a function of input light corresponding to 1.5 gain. The points show the experimental data. The lines are fitting lines. The fitting slope of CR365 is b=1.050.01 and the result of R5912 is b=1.030.01. In this paper, the maximum linear current is defined as the peak current where the deviation from the ideal linear current reaches 5%. From this figure, we can find that a peak linear current of CR365 is approximately 100 mA and R5912 almost achieved about 130 mA. In order to compare the characteristics of the 8-inch PMTs obviously, we selected two PMTs with a relatively high gain in the above tests. However, if we want to measure the number of photoelectrons up to , we will select proper PMTs with a lower gain in the following tests, as discussed in the next section.
3.6 Extend the dynamic range of MD
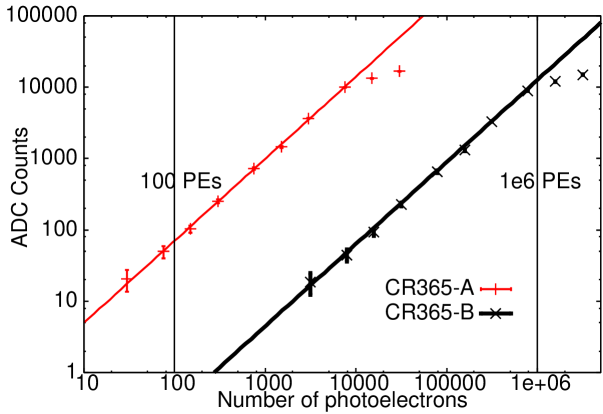
Monte Carlo simulations indicate that the highest energy showers may give rise to peak signals as large as PEs. The PMTs, therefore, must be linear up to such large signals. In order to extend the dynamic range of MD from 100 PEs to PEs, we are planning to add two 8-inch PMTs in each MD cell which are responsible for the range of 100 - 10000 PEs and 2000 - 1000000 PEs, respectively. First of all, we selected a CR365-A PMT with a gain at 1500V to ensure the linearity in the dynamic range of 100 - 10000 PEs. Then, with the increase of amount of incident light, we use a 1% filter to reduce the the input light of CR365-B which also has a gain at 1500V to realize a linear measurement of 2000 - 1000000 PEs. Fig.8 is the output signal of two CR365-PMTs versus input light which can meet our requirements. That is, the MD is expected to have the wide dynamic range in 6 orders of magnitude.
4 Conclusion
In this paper, we compared the characteristic features between PMT R5912 and PMT CR365. Our test experiments confirmed that there exists no serious difference between PMT CR365 and PMT R5912, and CR365 is within the specifications given by Beijing Hamamatsu. This is the first comparison between R5912 and CR365. We then tested the linearity of the PMT response by varying the light intensities and found that they satisfy our requirements with respect to the MD having the wide dynamic range in 6 orders of magnitude. In the near future, we will test the performance stability of this type of PMT.
Acknowledgments
The authors would like to express their thanks to the members of the Tibet AS collaboration for the fruitful discussion. This work is supported by the Grants from the National Natural Science Foundation of China (11533007, 11078002 and 11275212) and the Chinese Academy of Sciences (H9291450S3, 2013T2J0006) and the Key Laboratory of Particle Astrophysics, Institute of High Energy Physics, CAS. The Knowledge Innovation Fund (H95451D0U2 and H8515530U1) of IHEP, China also provide support to this study.
References
- [1] Kulikov and Khristiansen, JETP, 35: 635, (1958).
- [2] M. Amenomori et al., ApJ, 678: 1165, (2008).
- [3] J.R. Hörandel, Astropart. Phys., 19: 193, (2003).
- [4] J.R. Hörandel, Astropart. Phys., 21: 241, (2004).
- [5] Berezhko, E. G., & Ksenofontov, L. G, J. Exp. Theor. Phys., 89: 391 (1999).
- [6] Erlykin, A. D., & Wolfendale, A. W., Astropart. Phys., 23: 1 (2005).
- [7] Ptuskin, V. S., et al., A&A, 268: 726 (1993).
- [8] Wigmans, R., Astropart. Phys., 19: 379 (2003).
- [9] Nikolsky, S. I., & Romachin, V. A., Phys. At. Nuclei, 63: 1799, (2000).
- [10] M. Amenomori et al., Phys. Lett. B, 632: 58, (2006).
- [11] M. Shibata, Y. Katayose, J.Huang and D. Chen, ApJ, 716: 1076-1083, (2010).
- [12] J. Huang, L.M. Zhai, D. Chen, et al., Astropart. Phys., 66: 18-30, (2015).
- [13] LIU Jin-Sheng, et al., Chinese Physics C, Vol. 39: No.8, 086004 (2015).
- [14] L.M. Zhai, et al., J. Phys. G: Nucl. Part. Phys., 42: 045201 (2015).
- [15] E.H. Bellamy et al. Nuclear Instruments and Methods in Physics Research A, 339: 468-476 (1994).