Folding of Protein L with implications for collapse in the denatured state ensemble
Abstract
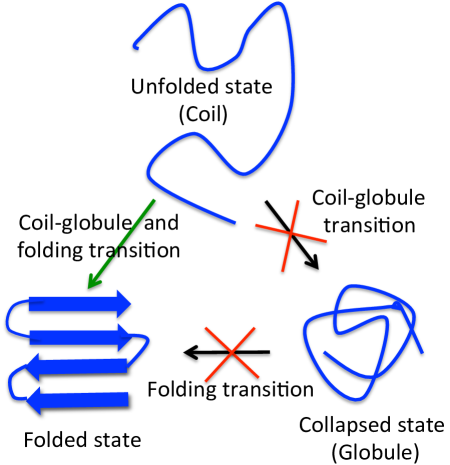
A fundamental question in protein folding is whether the coil to globule collapse transition occurs during the initial stages of folding (burst-phase) or simultaneously with the protein folding transition. Single molecule fluorescence resonance energy transfer (FRET) and small angle X-ray scattering (SAXS) experiments disagree on whether Protein L collapse transition occurs during the burst-phase of folding. We study Protein L folding using a coarse-grained model and molecular dynamics simulations. The collapse transition in Protein L is found to be concomitant with the folding transition. In the burst-phase of folding, we find that FRET experiments overestimate radius of gyration, , of the protein due to the application of Gaussian polymer chain end-to-end distribution to extract from the FRET efficiency. FRET experiments estimate 6Å decrease in when the actual decrease is 3Å on Guanidinium Chloride denaturant dilution from 7.5M to 1M, and thereby suggesting pronounced compaction in the protein dimensions in the burst-phase. The 3Å decrease is close to the statistical uncertainties of the data measured from SAXS experiments, which suggest no compaction, leading to a disagreement with the FRET experiments. The transition state ensemble (TSE) structures in Protein L folding are globular and extensive in agreement with the -analysis experiments. The results support the hypothesis that the TSE of single domain proteins depend on protein topology, and are not stabilised by local interactions alone.
Introduction
There is an ongoing debateZiv09PCCP ; Sosnick11COSB ; Haran12COSB ; Thirumalai13COSB ; Udgaonkar13ABB on whether the denatured ensemble of single domain proteins undergoes a coil to globule transition during the burst-phase of folding as the denaturant concentration is diluted to lower values. Proteins are heteropolymers and behave like random coils at high temperatures or denaturant concentrationsTanford66JBC ; Kohn04PNAS ; Hofmann12PNAS . An interesting question is whether proteins akin to polymers undergo a collapse transition in the burst-phase of folding as the conditions are made conducive for foldingBryngelson90Biopolymer ; Chan91ARBBC ; OBrien08PNAS . Single domain proteins unlike polymers are finite sized, and are composed of a specific sequence of amino acids which are hydrophobic and hydrophilic in character. The finite size effects and heteropolymer character are the reasons attributed to the marginal stability of proteins, and the near overlap of the collapse and folding transition temperatures, which makes them fold efficientlyCamacho93PNAS ; Li04PRL .
The collapse transition in proteins is generally studied using single molecule fluorescence resonance energy transfer (FRET), and small angle X-ray scattering (SAXS) experiments. Although FRET and SAXS experiments agree that proteins like Cytochrome cKathuria14JMB ; Lapidus07BiophysicsJ ; Hagen00JMB ; Shastry98ACS and MonellinReddy15Biochemistry ; Jha09PNAS ; Kimura05PNAS collapse during the burst-phase of folding, their results disagree for Protein L. FRET experiments for Protein LSherman06PNAS ; Merchant07PNAS ; Waldauer08HFSP infer collapse, whereas SAXS experimentsPlaxco99NSB ; Yoo12JMB conclude no collapse in the burst-phase of folding on dilution of Guanidine Hydrochloride . Both FRET and SAXS estimate the radius of gyration, , of the protein to infer the size of the protein in the unfolded ensemble. The difference in the predictions of FRETSherman06PNAS ; Merchant07PNAS and SAXSYoo12JMB ; Plaxco99NSB experiments for Protein L during the burst-phase of folding is statistically significant. The reasons for the disagreement between these experiments for Protein L are not completely clear. Understanding the impact of various approximations used in these methods to estimate the size of the protein can not only aid in resolving the disagreement between FRET and SAXS but also to understand the problem of protein collapse better.
Single domain proteins close to the melting temperature or the mid-point denaturant concentration generally fold in a 2-state manner through an ensemble of transition state structures (TSE). -analysis experiments for Protein LScalley97Biochemistry ; Gu97JMB ; Kim98JMB ; Kim00JMB predict that the TSE is polarised with only the N-terminal -hairpin present. Whereas the -analysis experimentsYoo12JMB2 predict that the TSE is globular and extensive with both the N and C-termini -hairpins present along with some non-native interactions in the C-terminal -hairpin. The -analysis experiments support that the TSE and the folding pathways for the single domain proteins depend on the protein topologyBaxa08JMB , whereas the -analysis experiments conclude that the TSE is mostly stabilised by local interactionsNaganathan10PNAS .
Various aspects of Protein L folding such as folding pathways, transition state structures, and properties of the unfolded ensemble are studiedKoga01JMB ; Karanicolas02ProtSci ; Clementi03JMB ; Ejtehadi04PNAS ; Brown04ProtSci ; Yang08BMC ; Voelz10JACS ; Chen14PCCP using both coarse-grained and atomistic simulations. In this manuscript, we study the burst-phase folding of Protein L to understand the origin of discrepancy between the FRETSherman06PNAS ; Merchant07PNAS and SAXSPlaxco99NSB ; Yoo12JMB experiments using the native-centric self-organised polymer model with side chains (SOP-SC)Hyeon06Structure ; Liu11PNAS and molecular dynamics simulations. The effect of on Protein L conformations is taken into account using the molecular transfer model (MTM)OBrien08PNAS ; Liu12JPCB .
The computed FRET efficiency, , for Protein L in the burst-phase of folding is in quantitative agreement with the FRET experiments of Eaton et al.Merchant07PNAS , and only in partial agreement with the experiments of Haran et al.Sherman06PNAS . The FRET experiments are found to overestimate compared to the actual values computed directly from the simulations owing to the use of the Gaussian polymer chain end-to-end distribution function to extract from . The deviation between FRET-extracted and actual increased with . As a result, FRET experimentsMerchant07PNAS estimate Å decrease in and infer protein collapse in the burst-phase, when the actual decrease is Å as is diluted from 7.5M to 1M.
The equilibrium computed as a function of is in near quantitative agreement with the SAXS experimentsYoo12JMB . The SAXS experimentsYoo12JMB infer no protein collapse as the burst-phase at = 4.0M and 0.67M are not statistically different. In the simulations, the burst-phase at = 4M and 1M are Å and Å, respectively, a difference of Å, which is well within the standard deviation 4Å. From this analysis, which is similar to the SAXS analysis, we can infer no collapse as the change in protein dimensions are not statistically significant, leading to a disagreement with the FRET experiments.
The TSE of Protein L at the melting temperature is inferred using calculationsDu98JCP . The TSE is found to be globular and extensive with both the N and C termini -hairpins present resembling a topology similar to that of the folded structure. The results are in agreement with the -analysis experimentsYoo12JMB2 and only in partial agreement with the -analysis experimentsScalley97Biochemistry ; Gu97JMB ; Kim98JMB ; Kim00JMB . The inferred TSE support the hypothesis that the transition state structures of single domain homologous proteins are extensive and depend on the protein topologyBaxa15PNAS .
Methods
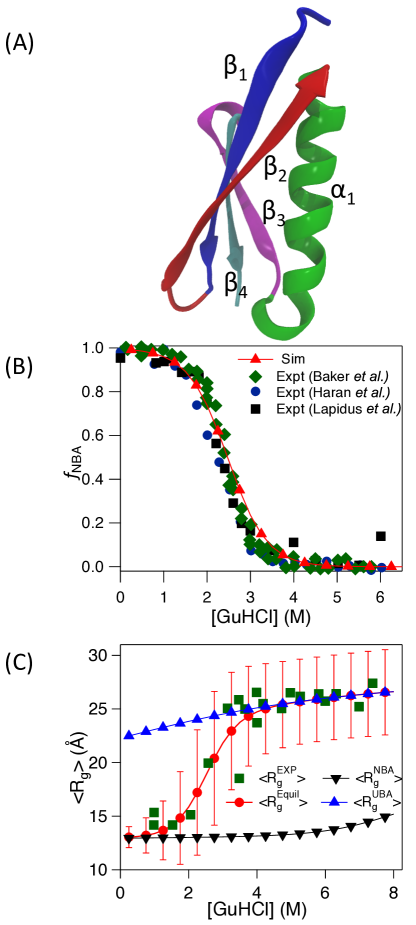
Self Organised polymer-Side Chain (SOP-SC) Model: We used the SOP-SC (self-organized polymer-side chain) modelHyeon06Structure ; Liu11PNAS in which each amino acid residue is represented by two beads. One bead is at the Cα position representing the backbone atoms, and the other bead is at the center of mass of the side chain representing the side chain atoms. The effective energy of a protein conformation in the SOP-SC model is a sum of bonded and non-bonded interactions. The bonded interactions () are present between a pair of connected beads. The non-bonded interactions are a sum of native () and non-native () interactions (see Supporting Information (SI) for more details). The native interactions for protein L are identified using the crystal structureNeill01ActaCry (Protein Data Bank ID: 1HZ6) (Fig 1A). The number of residues in the crystal structure, . The native interactions between the beads representing the amino acid side chains interact via a residue dependent Betancourt-Thirumalai statistical potentialBetancourt99ProtSci .
The coarse-grained force-field in the SOP-SC model for a protein conformation given by the co-ordinates in the absence of denaturants, , is
| (1) |
Description of the various energy terms in Equation 1 and the parameters used in the energy function are given in the SI. These parameters are identical to the values previously used to successfully study the folding properties of the proteins UbiquitinReddy15JPCB and GFPReddy12PNAS . We used the same force-field to study the properties of different proteins, and as a result this force-field satisfies the criterion of a transferable force-field.
Molecular Transfer Model: To simulate Protein L folding thermodynamics and kinetics in the presence of we used the Molecular Transfer Model (MTM)OBrien08PNAS ; Liu12JPCB . In the presence of a denaturant of concentration , the effective coarse-grained force field for the protein using MTM is given by
| (2) |
where is given by Eq. 1, is the protein-denaturant interaction energy in a solution with denaturant concentration [C], and is given by
| (3) |
where (=) is the number of beads in coarse-grained Protein L, is the transfer free energy of bead , is the solvent accessible surface area (SASA) of the bead in a protein conformation described by positions , is the SASA of the bead in the tripeptide . The radii for amino acid side chains to compute are given in Table S2 in Ref.Reddy15JPCB . The experimentalAuton04Biochem ; OBrien08PNAS ; OBrien09Biochem transfer free energies , which depend on the chemical nature of the denaturant, for backbone and side chains are listed in Table S3 in Ref.Liu11PNAS . The values for are listed in Table S4 in Ref.Liu11PNAS .
Simulations and Data Analysis: Low friction Langevin dynamics simulationsVeitshans97FoldDes are used to generate protein conformations as a function of in conditions. To compute thermodynamic properties of the protein in a denaturant solution of concentration , is treated as perturbation to in Eq. 2, and Weighted Histogram MethodKumar92JCompChem ; OBrien08PNAS ; Liu12JPCB is used to compute average value of various physical quantities at any [C]. Brownian dynamics simulationsErmak78JChemPhys are used with the full Hamiltonian (Eq. 2) to simulate the burst-phase folding kinetics of the protein in a denaturant solution of concentration (see SI for details).
We computed structural overlap functionGuo96JMB , , and radius of gyration, , to monitor protein L folding kinetics. The structural overlap function is defined as . Here, is the number of pairs of beads in the SOP-SC model of Protein L assuming that the bead centers are separated by at least 2 bonds, is the distance between the pair of beads, and being the corresponding distance in the folded state, is the Heaviside step function, and Å. Using as an order parameter, we calculated the fraction of molecules in the NBA, as a function of (see SI for details and Fig. S2). , is calculated using , where is the vector connecting the beads and . The extent of long-range contacts in the TSE structures compared to the coarse-grained PDB structure is analysed using the relative contact orderPlaxco98JMB ; Klimov98JMB , , which is defined as , where is the number of pairs of beads with native interactions in the protein conformation (see SI), and is the number of residues separating the contact pair .
Results and Discussion
Thermodynamics of Protein L folding: The protein in the folded state has one -helix () and four -strands ( - ) (Fig. 1A and S1A). Low friction Langevin dynamics simulations performed at different temperatures, , ranging from to show that folding occurs in a two-state manner (see SI, Fig. S1). The melting temperature, , of protein L obtained from the heat capacity, , plot is (Fig. S1), and the value observed in experimentsGillespie00PNAS is . The difference in between experiments and simulations can be attributed to the simplified coarse-grained SOP-SC model. At , the protein transitions between the native basin of attraction (NBA) and the unfolded basin of attraction (UBA) (Fig. S2). Protein L folding thermodynamics and kinetics in the presence of the denaturant is studied using the molecular transfer model (MTM)OBrien08PNAS ; Liu12JPCB . In order to compare the denaturant-dependent folding properties of the protein computed from simulations with the experiments, a simulation temperature at which theoretically obtained free energy difference between the NBA and UBA, matches with the experimentallyKim00JMB measured value, (= -4.6 kcal/mole), at is used. This is the only adjustable parameter in the model, which is equivalent to matching the energy scales between the simulations and experiments.
The structural overlap parameter, (see methods), is used to distinguish between the NBA and UBA protein conformations (Fig. S2). The protein conformations with belong to the NBA, and conformations with belong to the UBA (Fig. S2B). The fraction of molecules in NBA, , as a function of computed from simulations is in quantitative agreement with the experimentsKim00JMB ; Sherman08Biophys ; Waldauer08HFSP (Fig. 1B). The mid-point at which the protein unfolds is . The average radius of gyration, , of Protein L as a function of is in quantitative agreement with the SAXS experimentsYoo12JMB (Fig. 1C). The standard deviation of in the protein unfolded state, Å, indicates that fluctuates between 22Å30Å. As is diluted from 8M to 4M, the decreases from Å to Å almost linearly with a slope of 0.42 ÅM-1. The experimental dataYoo12JMB fits equally well with a horizontal line or a line with slope 0.33 ÅM-1. The average of the protein conformations in the UBA basin, , as a function of show that the size of the protein decreases from Å to Å as is diluted from 7.5M to 0.25M.
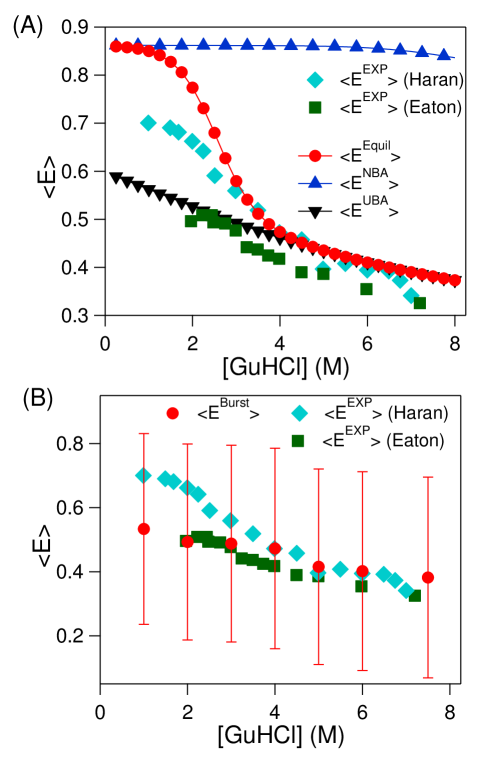
Denaturant-dependent FRET efficiency: Average FRET efficiency, , as a function of is computed from the Langevin dynamics simulations (Fig. 2A). In FRET experimentsSherman06PNAS ; Merchant07PNAS , the donor (AlexaFluor 488) and acceptor (AlexaFluor 594) dyes are attached near the N and C termini of Protein L. All-atom simulationsZerze15BiophysJ have shown that the dyes have negligible effect on the size of disordered protein structures. The is calculated using
| (4) |
where is the end-to-end distance, , probability distribution function of the protein, Å is the contour length of the protein, and Å is the Forster radius for the donor-acceptor dyes used in the experimentsSherman06PNAS ; Merchant07PNAS .
The equilibrium transitions from lower values () to higher values () as the protein folds from an unfolded state upon dilution (Fig. 2A). The large standard-deviation, , for (Fig. S3) indicates that the protein in the UBA basin samples conformations with large size fluctuations in agreement with the data (Fig. 1C). The average FRET effeciency computed for the UBA ensemble, , to study whether the protein collapses in the early stages of folding is in quantitative agreement with the experiments of Eaton et al.Merchant07PNAS , where as they are in disagreement with the experiments of Haran et al.Sherman06PNAS for the denaturant concentrations (Fig. 2A). gradually increases from 0.37 to 0.6 as is diluted from 8M to 0.25M pointing to an average decrease in the size of the protein (Fig. 2A).
The average FRET efficiency is also computed from the initial 0.25 of the Brownian dynamics simulations performed to study the folding kinetics of Protein L. The initial of the folding trajectories are used to check whether the protein decreases in size in the burst-phase of folding when is diluted from 7.5M to lower concentrations. The initial unfolded protein conformation to initiate the folding simulations in various are obtained from simulations performed at . 20 independent simulations starting from different initial protein conformations are performed for each . computed for the early stages of folding is in quantitative agreement with the experiments of Eaton et al.Merchant07PNAS for all , and deviates from the values obtained from the experiments of Haran et al.Sherman06PNAS for the range (Fig. 2B). increases from 0.38 to 0.53 as is diluted from 7.5M to 1.0M signifying that the protein on an average decreases in size. The standard deviation of burst-phase FRET efficiency, , show that varies between 0.2 and 0.8 indicating that the protein in the initial stages of folding samples conformations with a significant variation in size (Fig. 2B). The plot as a function of time shows that it varies in the range 15Å 30Å during the initial hundreds of microseconds after folding is initiated for and conditions (Fig. S4).
FRET overestimates radius of gyration in high : We mimicked the FRET experimentsMerchant07PNAS ; Sherman06PNAS to estimate from . The Gaussian polymer chain end-to-end probability distribution is given by
| (5) |
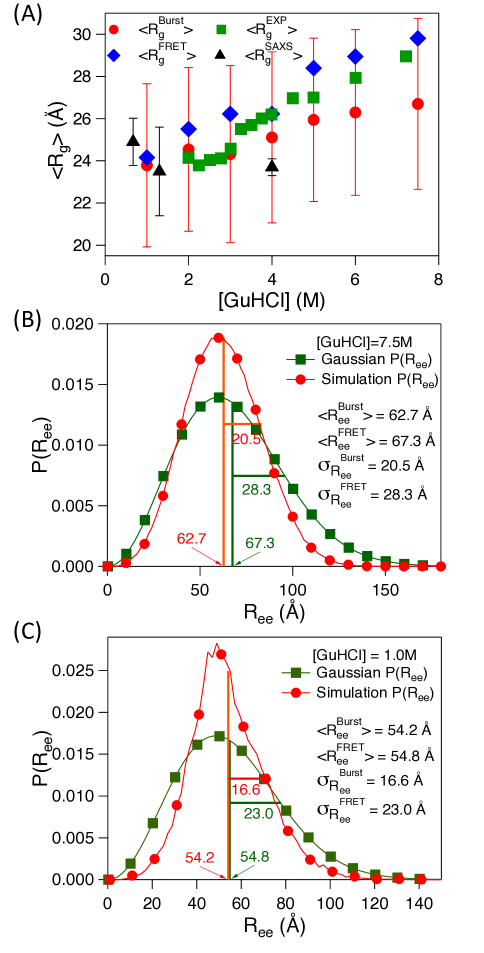
The given by Eq. 5 is used in Eq. 4 to estimate the average end-to-end distance square, , from . is calculated using the relationpolymerphysics , . values estimated from (Fig. 2B) using equations 4 and 5 at different are in near quantitative agreement with the experimentallyMerchant07PNAS estimated values (Fig. 3A). On diluting from 7.5M to 1M, decreases from Å to Å, nearly a 6Å change in the size of the protein, which is in agreement with the experimentsMerchant07PNAS of Eaton et al. However, deviates from the values computed directly from the protein conformations obtained from the simulation trajectories (Fig. 3A). decreases from Å to Å, a decrease of only Å upon dilution from 7.5M to 1M (Fig. 3A). This shows that FRET overestimates the size of the protein especially in higher , and this gives rise to the appearance of pronounced compaction in the dimensions of the protein in the burst-phase as is diluted. The standard deviation, Å, of shows that at all , the protein samples conformations with varying from Å to Å (Fig. 3A), and the 3Å decrease in upon dilution is within the . The deviation between and at high was also emphasised in the work of O’Brien et al.OBrien09JCP and the reasons for the deviation are attributed to the use of Gaussian chain to extract . The problems associated with the use of Gaussian chain to extract information about protein dimensions is also highlighted in previous other studiesSinha07JMB ; Laurence05PNAS ; Goldenberg03JMB ; Zhou02JPCB . The deviation between and increases with , and the reasons for the discrepancy can be understood using the relation , where is the standard deviation in .
and estimated from the Gaussian polymer chain to compute deviate from the values computed directly from the initial of the Protein L folding trajectories (Fig. 3B and C). At high , and estimated from the Gaussian chain are 67.3Å and 28.3Å, respectively, which deviate from the and values 62.7Å and 20.5Å respectively (Fig. 3B), computed directly from the simulations. As a result FRET overestimates
compared to in high (Fig. 3A). As decreases, the deviation between and decreases (Fig. S5). In low , the values computed from the Gaussian chain , and computed from simulations are in good agreement, where as the values deviate from (Fig. 3C). Due to this the deviation between and is small in low , and increases with (Fig. 3 and S5).
To conclude, during the burst-phase of folding, for Protien L decreases from Å to Å, a decrease of Å upon dilution from 7.5M to 1M (Fig. 3A). However, FRET overestimates the size of the protein in high due to the application of the Gaussian polymer chain to estimate . During the burst-phase estimated from FRET decreases from Å to Å upon dilution from 7.5M to 1M (Fig. 3A). Due to the 6Å decrease in , FRET experimentsMerchant07PNAS ; Sherman06PNAS suggest pronounced compaction in the protein size during the burst-phase of folding.
Disagreement between FRET and SAXS experiments on Protein L compaction in burst-phase folding: In simulations, the average radius of gyration in the burst-phase folding, , decreased by Å when is diluted from 7.5M to 1M. The Å decrease in is close to statistical uncertainties of the data obtained from SAXS experimentsYoo12JMB for Protein L. The data from SAXS experiments for can fit a horizontal line or a line with slope 0.33 ÅM-1 equally wellYoo12JMB . Using this slope to compute the change upon dilution from 7.5M to 1M gives a decrease of Å. The SAXS experimentsYoo12JMB report that of Protein L in the burst phase upon dilution to 1.3M and 0.67M are Å and 24.9Å, respectively which are statistically not different from the value at M. In the simulations, at = 4M and 1M are Å and Å, respectively, a difference of Å, which is well within 4Å. This analysis similar to the SAXS analysis leads to the conclusion of minimal Protein L compaction within statistical uncertainties on dilution in agreement with the SAXS experimentsYoo12JMB , and disagreement with the FRET experimentsSherman06PNAS ; Merchant07PNAS .
Recent FRET experimentsWatkins15PNAS on polyethylene glycol (PEG) showed that FRET efficiency decreased as is increased when hydrophilic PEG is unlikely to expand on increasing . This led to questions about the interpretation of the FRET data to study protein collapse in low . We find that the computed variation in and as a function of for Protein L to be in quantitative agreement with at least one of the FRET experimentsMerchant07PNAS (Fig. 2) and also in agreement with SAXS experimentsYoo12JMB within the statistical uncertainties (Fig. 1C and 3A). The results points to the use of Gaussian polymer chain statistics to extract from FRET efficiency data to be the cause for the discrepancy between the SAXS and FRET experiments in estimating .
The coil-globule transition in Protein L is concomitant with the folding transition: In polymers the ratio of the radius of gyration to the hydrodynamic radius, , can point to the coil-globule collapse transition. The ratio for a polymer in a good solventOono83JCP is , where as the ratio in a poor solventpolymerphysics is . We used the Kirkwood-Riseman approximationKirkwood48JCP to compute the hydrodynamic radius of the protein, which is given by , where is the number of beads in the coarse-grained protein, and are the position vectors of beads and . The ratio for the burst-phase folding decreases from to as is diluted from 7.5M to 1M indicating that this is not a coil-globule transition observed in polymers (Fig. 4). The single domain proteins which are finite in size compared to polymers are predicted to have a near overlap of the collapse and folding transition temperaturesCamacho93PNAS ; Li04PRL . In agreement, the equilibrium ratio of decreases from to as the folding transition occurs (Fig. 4). The ratio does not approach 0.77 as the protein folds because the Kirkwood-Riseman approximationKirkwood48JCP used to compute does not hold for the protein in the folded state as it assumes all the beads are equally bathed by the solvent.
The absence of coil-globule transition in the burst-phase of protein L folding does not imply that the collapse transition or significant protein compaction is universally absent in the burst-phase folding of all single domain proteins. Both FRET and SAXS experiments agree that the protein MonellinReddy15Biochemistry ; Jha09PNAS ; Kimura05PNAS shows compaction during the burst-phase of folding. Although both the experimental techniques observe compaction in the case of Cytochrome cKathuria14JMB ; Lapidus07BiophysicsJ ; Hagen00JMB ; Shastry98ACS , the FRET experiments show that this compaction, a sub- event, is barrier limited and it is due to the formation of marginally stable partially folded structuresKathuria14JMB . ExperimentsHofmann12PNAS show that for the protein CyclophilinA, the ratio decreases from a value between 1.1-1.2 to a value between 0.9-1.0 as is diluted from 8M to 0M indicating a coil-globule transition in the burst-phase of folding.
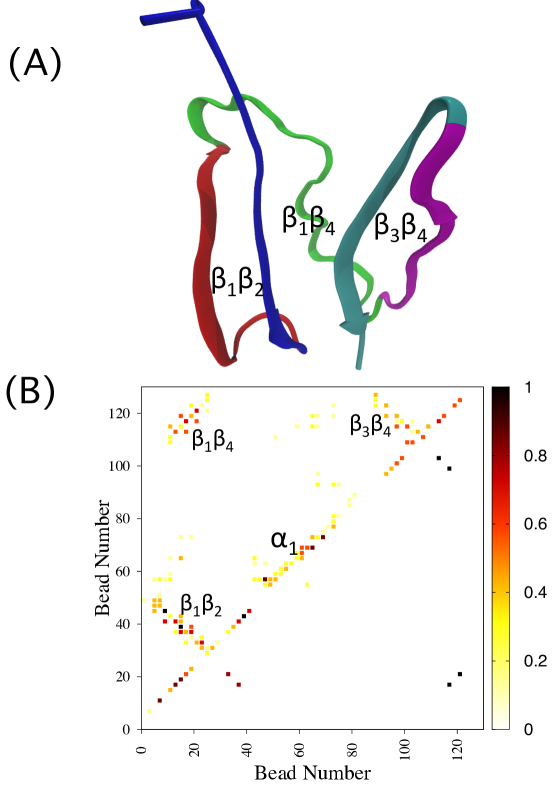
Transition State Ensemble (TSE): The transition state ensemble of Protein L at the melting temperature, , is identified using the analysisDu98JCP (see SI for details). 12 out of 108 putative transition state structures (TSE) which satisfy the condition, are labeled as TSE (Fig. S6). The transition state structures (TSE) are globular, extensive and homogenous, with most of the secondary and tertiary contacts formed (Fig. 5). The -analysis experimentsYoo12JMB2 predict that TSE contains all the four -sheet strands (). The TSE from simulations show that both the and -termini hairpins and , and the contacts between the strands are present in the structures in agreement with the -analysis experimentsYoo12JMB2 (Fig. 5B).
The -analysis experiments on two residue pairs, K28-E32 and A35-T39, present in the helical region of the protein gave -values 0.26 and , respectively, indicating that contacts between these pairs of residues is largely absent, and concluded that helix is mostly not present in the TSEYoo12JMB2 . The contact map of the TSE obtained from the simulations show that the side chains of the residue pairs K28-E32 and A35-T39 form contacts with a probability of 0.41 and 0.08, respectively. The simulations further indicate that a cluster of residues between S31 and A37 present approximately at the center of the helix containing 3 Ala residues (A33, A35 and A37) can form stable contacts in the TSE (Fig. 5B).
The -analysis experimentsPandit06JMB ; Baxa08JMB predict a relationship between the relative contact order, RCO (see methods), of the native protein topology and TSE, , which shows the extent of long-range contacts present in the TSE compared to the native-state. The TSE structures extracted from the simulations show , which is in reasonable agreement with the value of 0.75 estimated from -analysis experimentsYoo12JMB2 . The simulations using the coarse-grained protein model support the basic topology of the TSE structures predicted by the -analysis experiments.
The folding simulations of only the C-terminal hairpin () using atomistic models predicted the presence of non-native contacts, a 2 amino acid register shift, in the TSEYoo12JMB2 . We do not observe this 2 amino acid register shift in the C-terminal hairpin because the SOP-SC model includes only native-interactions. The predicted TSE is only in partial agreement with the -analysis experimentsKim00JMB ; Kim98JMB ; Scalley97Biochem ; Gu97JMB which predicted a polarised structure with only hairpin. The results support the hypothesis that folding pathways and TSE of single domain proteins are influenced by the topology of the folded structure in agreement with the experimentsBaxa15PNAS .
Concluding Remarks: In summary, we have studied Protein L folding in the presence of the denaturant Guanidine Hydrochloride using the SOP-SC coarse-grained model and molecular dynamics simulations. The effect of on the protein is taken into account using the molecular transfer modelOBrien08PNAS ; Liu12JPCB . The study mainly focussed on whether there is a coil-globule collapse transition in the burst-phase of folding after the denaturant concentration is diluted to lower values. The main findings of this study is the coil-globule transition in Protein L is concomitant with the folding transition. It is not observed during the burst phase. The FRET experiments overestimate the of the protein at high concentrations owing to the use of the Gaussian polymer chain end-to-end distribution function to extract from FRET efficiency. As a result, in the burst-phase of folding, FRET observes pronounced compaction in the size of the protein as is diluted. The actual decrease in the size of the protein (Å) observed during the burst-phase is close to statistical uncertainties of the data measured from SAXS experimentsYoo12JMB , and these experiments conclude that there is no collapse leading to a discrepancy with the FRET experiments.
It is highly desirable to formulate a method to accurately extract the distances between the donor and acceptor dyes used in the FRET experiments. However, it is a non-trivial inverse problem as we seek to accurately extract a probability distribution of the distances between the dyes from the average FRET efficiency measured in experiments, especially in cases like Protein L where the compaction in protein dimensions is small on denaturant dilution. Previous studiesOBrien09JCP have shown that even other polymer models such as the self-avoiding chain or the worm-like-chain model are also not very accurate quantitatively to predict the small subtle changes in the protein dimensions.
The results presented in this manuscript clearly point out the aspects of the Gaussian chain model, which leads to over estimating the size of the protein when used to analyse the FRET data. The results show that the Gaussian chain model fails in accurately capturing the width of the protein end-to-end probability distribution, which is essential to compute the radius of gyration. For any method to be quantitatively accurate it should capture the peak position as well as the width of the probability distribution accurately, and this is a challenging task because we need to estimate probability distribution from an average value, and also the method should be reliable enough to work on proteins with different amino acid composition and native folds.
To check the accuracy of the distance between the dyes extracted from the FRET efficiency data using the Gaussian polymer model assumption, a self-consistency check can be performed to see if the assumption is valid or not for the protein under studyOBrien09JCP . If the dyes are attached at locations and in the protein, and is the average distance square extracted from FRET efficiency, and similarly if is the average distance square extracted from FRET efficiency with dyes at positions and , then the relation should hold if the protein behaves as a Gaussian chain. If the relation is not satisfied, then one should be cautious in quantitatively inferring results about the protein dimensions assuming that the protein in the unfolded state behaves as a Gaussian chain.
The magnitude of protein compaction in the burst-phase folding of single domain proteins upon denaturant dilution is not uniform, and it should depend on protein length, sequence and composition of amino acids. For example SAXS experiments on Protein LYoo12JMB and UbiquitinJacob04JMB infer no compaction in the protein dimensions in the burst-phase, while experiments on Cytochrome cKathuria14JMB and MonellinKimura05PNAS observe compaction. The key features in the single domain proteins responsible for compaction in protein dimensions on denaturant dilution needs to be identified. In addition to temperature and denaturants, force can also be used to unfold proteins and study protein folding. ExperimentsFernandez04Science and simulationsBest05Science ; Hyeon09PNAS show that a protein unfolded by force when allowed to refold in the presence of lower quenching forces undergoes a rapid compaction in the initial stages of folding. This compaction of the protein is driven by entropy because the protein in the stretched state is in a low entropic state and upon force quench undergoes rapid compaction in the first stage of folding until entropy is maximisedHyeon09PNAS . The extent of protein compaction in the initial stages of folding also depends on the experimental probes used to study protein folding.
The transition state structures inferred from the analysis are globular and extensive with both the C and N-termini hairpins and , and interactions between the strands . These results are in agreement with the -analysis experimentsYoo12JMB2 and support the hypothesis that for single domain globular proteins the transition state structures depend on the protein native-state topology and are not stabilised by local interactions alone.
Acknowledgement: GR acknowledges startup grant from Indian Institute of Science-Bangalore, and funding from Nano mission, Department of Science and Technology, India. Hiranmay Maity acknowledges research fellowship from Indian Institute of Science-Bangalore.
Supporting Information: Description of the simulation methods; Table S1; Figures S1-S6. This material is available free of charge via the Internet at http://pubs.acs.org
References
- (1) G. Ziv, D. Thirumalai, and G. Haran. Collapse transition in proteins. Phys. Chem. Chem. Phys., 11:83–93, 2009.
- (2) Tobin R. Sosnick and Doug Barrick. The folding of single domain proteins - have we reached a consensus? Curr. Opin. Struct. Biol., 21(1):12–24, 2011.
- (3) Gilad Haran. How, when and why proteins collapse: the relation to folding. Curr. Opin. Struct. Biol., 22(1):14–20, 2012.
- (4) D Thirumalai, Zhenxing Liu, Edward P O’Brien, and Govardhan Reddy. Protein folding: From theory to practice. Curr. Opin. Struct. Biol., 23(1):22–29, 2013.
- (5) Jayant B. Udgaonkar. Polypeptide chain collapse and protein folding. Arch. Biochem. Biophys., 531(1-2, SI):24–33, 2013.
- (6) C Tanford, K Kawahara, and S Lapanje. Proteins in 6M Guanidine Hydrochloride - Demonstration of random coil behavior. J. Biol. Chem., 241(8):1921–&, 1966.
- (7) J.E. Kohn, I.S. Millett, J. Jacob, B. Zagrovic, T.M. Dillon, N. Cingel, R.S. Dothager, S. Seifert, P. Thiyagarajan, T.R. Sosnick, M.Z. Hasan, V.S. Pande, I. Ruczinski, S. Doniach, and K.W. Plaxco. Random-coil behavior and the dimensions of chemically unfolded proteins. Proc. Natl Acad Sci USA, 101(34):12491–12496, 2004.
- (8) H Hofmann, A Soranno, A Borgia, K Gast, D Nettels, and B Schuler. Polymer scaling laws of unfolded and intrinsically disordered proteins quantified with single molecule spectroscopy. Proc. Natl. acad. sci., 109:16155–16160, 2012.
- (9) J D Bryngelson and P G Wolynes. A Simple Statistical Field-Theory of Heteropolymer collapse with application t o protein folding. Biopolymers, 30(1-2):177–188, 1990.
- (10) H S Chan and K A Dill. Polymer principles in protein-structure and stability. Annu. Rev. Biophys. Biophys. Chem., 20:447–490, 1991.
- (11) E. P. O’Brien, G. Ziv, G. Haran, B. R. Brooks, and D. Thirumalai. Effects of denaturants and osmolytes on proteins are accurately predicted by the molecular transfer model. Proc. Natl. Acad. Sci. USA, 105:13403–13408, 2008.
- (12) C. J. Camacho and D. Thirumalai. Kinetics and thermodynamics of folding in model proteins. Proc. Natl Acad Sci USA, 90(13):6369–6372, 1993.
- (13) M S Li, D K Klimov, and D Thirumalai. Finite size effects on thermal denaturation of globular proteins. Phys. Rev. Lett., 93(26), 2004.
- (14) Sagar V. Kathuria, Can Kayatekin, Raul Barrea, Elena Kondrashkina, Rita Graceffa, Liang Guo, R. Paul Nobrega, Srinivas Chakravarthy, C. Robert Matthews, Thomas C. Irving, and Osman Bilsel. Microsecond Barrier-Limited Chain Collapse Observed by Time-Resolved FRET and SAXS. J. Mol. Biol., 426(9):1980–1994, 2014.
- (15) Lisa J. Lapidus, Shuhuai Yao, Kimberly S. McGarrity, David E. Hertzog, Emily Tubman, and Olgica Bakajin. Protein hydrophobic collapse and early folding steps observed in a microfluidic mixer. Biophys. J., 93(1):218–224, 2007.
- (16) S J Hagen and W A Eaton. Two-state expansion and collapse of a polypeptide. J. Mol. Biol., 301(4):1019–1027, 2000.
- (17) M C R Shastry, J M Sauder, and H Roder. Kinetic and structural analysis of submillisecond folding events in cytochrome c. Accounts Chem. Res., 31(11):717–725, 1998.
- (18) Rama Reddy Goluguri and Jayant B. Udgaonkar. Rise of the Helix from a Collapsed Globule during the Folding of Monellin. Biochemistry, 54(34):5356–5365, 2015.
- (19) Santosh Kumar Jha and Jayant B. Udgaonkar. Direct evidence for a dry molten globule intermediate during the unfolding of a small protein. Proc. Natl. Acad. Sci. U. S. A., 106(30):12289–12294, 2009.
- (20) T Kimura, T Uzawa, K Ishimori, I Morishima, S Takahashi, T Konno, S Akiyama, and T Fujisawa. Specific collapse followed by slow hydrogen-bond formation of beta-sheet in the folding of single-chain monellin. Proc. Natl. Acad. Sci., 102(8):2748–2753, 2005.
- (21) E. Sherman and G. Haran. Coil-globule transition in the denatured state of a small protein. Proc. Natl. Acad. Sci. USA, 103:11539–11543, 2006.
- (22) K. A. Merchant, R. B. Best, J. M. Louis, I. V. Gopich, and W. A. Eaton. Characterizing the unfolded states of proteins using single-molecule FRET spectroscopy and molecular simulations. Proc. Natl. Acad. Sci. USA, 104:1528–1533, 2007.
- (23) Steven A. Waldauer, Olgica Bakajin, Terry Ball, Yujie Chen, Stephen J. DeCamp, Michaela Kopka, Marcus Jaeger, Vijay R. Singh, William J. Wedemeyer, Shimon Weiss, Shuhuai Yao, and Lisa J. Lapidus. Ruggedness in the folding landscape of protein L. HFSP J., 2(6):388–395, 2008.
- (24) K W Plaxco, I S Millett, D J Segel, S Doniach, and D Baker. Chain collapse can occur concomitantly with the rate-limiting step in protein folding. Nat. Struct. Biol., 6(6):554–556, 1999.
- (25) Tae Yeon Yoo, Steve P. Meisburger, James Hinshaw, Lois Pollack, Gilad Haran, Tobin R. Sosnick, and Kevin Plaxco. Small-Angle X-ray Scattering and Single-Molecule FRET Spectroscopy Produce Highly Divergent Views of the Low-Denaturant Unfolded State. J. Mol. Biol., 418(3-4):226–236, 2012.
- (26) M L Scalley, Q Yi, H D Gu, A McCormack, J R Yates, and D Baker. Kinetics of folding of the IgG binding domain of peptostreptoccocal protein L. Biochemistry, 36(11):3373–3382, 1997.
- (27) H D Gu, D Kim, and D Baker. Contrasting roles for symmetrically disposed beta-turns in the folding of a small protein. J. Mol. Biol., 274(4):588–596, 1997.
- (28) D E Kim, Q Yi, S T Gladwin, J M Goldberg, and D Baker. The single helix in protein L is largely disrupted at the rate-limiting step in folding. J. Mol. Biol., 284(3):807–815, DEC 4 1998.
- (29) D E Kim, C Fisher, and D Baker. A breakdown of symmetry in the folding transition state of protein L. J. Mol. Biol., 298(5):971–984, 2000.
- (30) Tae Yeon Yoo, Aashish Adhikari, Zhen Xia, Tien Huynh, Karl F. Freed, Ruhong Zhou, and Tobin R. Sosnick. The Folding Transition State of Protein L Is Extensive with Nonnative Interactions (and Not Small and Polarized). J. Mol. Biol., 420(3):220–234, 2012.
- (31) Michael C. Baxa, Karl F. Freed, and Tobin R. Sosnick. Quantifying the structural requirements of the folding transition state of protein A and other systems. J. Mol. Biol., 381(5):1362–1381, 2008.
- (32) Athi N. Naganathan and Victor Munoz. Insights into protein folding mechanisms from large scale analysis of mutational effects. Proc. Natl. Acad. Sci. U. S. A., 107(19):8611–8616, 2010.
- (33) N Koga and S Takada. Roles of native topology and chain-length scaling in protein folding: A simulation study with a Go-like model. J. Mol. Biol., 313(1):171–180, 2001.
- (34) J. Karanicolas and C. L. Brooks III. The origins of asymmetry in the folding transition states of protein L and protein G. Protein Sci., 11:2351–2361, 2002.
- (35) C Clementi, A E Garcia, and J N Onuchic. Interplay among tertiary contacts, secondary structure formation and side-chain packing in the protein folding mechanism: All-atom representation study of protein L. J. Mol. Biol., 326(3):933–954, 2003.
- (36) M R Ejtehadi, S P Avall, and S S Plotkin. Three-body interactions improve the prediction of rate and mechanism in protein folding models. Proc. Natl. Acad. Sci. U. S. A., 101(42):15088–15093, 2004.
- (37) S Brown and T Head-Gordon. Intermediates and the folding of proteins L and G. Protein Sci., 13(4):958–970, 2004.
- (38) Qingwu Yang and Sing-Hoi Sze. Predicting protein folding pathways at the mesoscopic level based on native interactions between secondary structure elements. BMC Bioinformatics, 9, 2008.
- (39) Vincent A. Voelz, Vijay R. Singh, William J. Wedemeyer, Lisa J. Lapidus, and Vijay S. Pande. Unfolded-State Dynamics and Structure of Protein L Characterized by Simulation and Experiment. J. Am. Chem. Soc., 132(13):4702–4709, 2010.
- (40) Tao Chen and Hue Sun Chan. Effects of desolvation barriers and sidechains on local-nonlocal coupling and chevron behaviors in coarse-grained models of protein folding. Phys. Chem. Chem. Phys., 16(14):6460–6479, 2014.
- (41) C. B. Hyeon, R. I. Dima, and D. Thirumalai. Pathways and kinetic barriers in mechanical unfolding and refolding of RNA and proteins. Structure, 14:1633–1645, 2006.
- (42) Zhenxing Liu, Govardhan Reddy, Edward P O’Brien, and D Thirumalai. Collapse kinetics and chevron plots from simulations of denaturant-dependent folding of globular proteins. Proc. Natl. Acad. Sci. USA, 108(19):7787–7792, 2011.
- (43) Zhenxing Liu, Govardhan Reddy, and D. Thirumalai. Theory of the Molecular Transfer Model for Proteins with Applications to the Folding of the src-SH3 Domain. J. Phys. Chem. B, 116(23):6707–6716, 2012.
- (44) R Du, V S Pande, A Y Grosberg, T Tanaka, and E S Shakhnovich. On the transition coordinate for protein folding. J. Chem. Phys., 108(1):334–350, 1998.
- (45) Michael C. Baxa, Wookyung Yu, Aashish N. Adhikari, Liang Ge, Zhen Xia, Ruhong Zhou, Karl F. Freed, and Tobin R. Sosnick. Even with nonnative interactions, the updated folding transition states of the homologs Proteins G & L are extensive and similar. Proc. Natl. Acad. Sci. U. S. A., 112(27):8302–8307, 2015.
- (46) J W O’Neill, D E Kim, D Baker, and K Y J Zhang. Structures of the B1 domain of protein L from Peptostreptococcus magnus with a tyrosine to tryptophan substitution. Acta Crystallogr. Sect. D-Biol. Crystallogr., 57(4):480–487, 2001.
- (47) M. R. Betancourt and D. Thirumalai. Pair potentials for protein folding: Choice of reference states and sensitivity of predicted native states to variations in the interaction schemes. Prot. Sci., 8:361–369, 1999.
- (48) Govardhan Reddy and D Thirumalai. Dissecting Ubiquitin folding using the Self-Organized Polymer model. J. Phys. Chem. B, 119(34):11358–11370, 2015.
- (49) Govardhan Reddy, Zhenxing Liu, and D. Thirumalai. Denaturant-dependent folding of GFP. Proc. Natl. Acad. Sci. USA, 109:17832–17838, 2012.
- (50) M. Auton and D. W. Bolen. Additive transfer free energies of the peptide backbone unit that are independent of the model compound and the choice of concentration scale. Biochemistry, 43:1329–1342, 2004.
- (51) E. P. O’Brien, B. R. Brooks, and D. Thirumalai. Molecular Origin of Constant m-Values, Denatured State Collapse, and Residue-Dependent Transition Midpoints in Globular Proteins. Biochemistry, 48:3743–3754, 2009.
- (52) T. Veitshans, D. Klimov, and D. Thirumalai. Protein folding kinetics: Timescales, pathways and energy landscapes in terms of sequence-dependent properties. Fold Des, 2(1):1–22, 1997.
- (53) S Kumar, J M Rosenberg, D Bouzida, R H Swendsen, and P A Kollman. The weighted histogam analysis method for free-energy calculations on biomolecules. 1. the method. J. Comput. Chem., 13:1011–1021, 1992.
- (54) D. L. Ermak and J. A. Mccammon. Brownian dynamics with hydrodynamic interactions. J Chem Phys, 69(4):1352–1360, 1978.
- (55) Z. Guo and D. Thirumalai. Kinetics and thermodynamics of folding of a de novo designed four helix bundle. J. Mol. Biol., 263:323–343, 1996.
- (56) K W Plaxco, K T Simons, and D Baker. Contact order, transition state placement and the refolding rates of single domain proteins. J. Mol. Biol., 277(4):985–994, 1998.
- (57) D K Klimov and D Thirumalai. Lattice models for proteins reveal multiple folding nuclei for nucleation-collapse mechanism. J. Mol. Biol., 282(2):471–492, 1998.
- (58) B Gillespie and K W Plaxco. Nonglassy kinetics in the folding of a simple single-domain protein. Proc. Natl. Acad. Sci. U. S. A., 97(22):12014–12019, 2000.
- (59) Eilon Sherman, Anna Itkin, Yosef Yehuda Kuttner, Elizabeth Rhoades, Dan Amir, Elisha Haas, and Gilad Haran. Using fluorescence correlation spectroscopy to study conformational changes in denatured proteins. Biophys. J., 94(12):4819–4827, 2008.
- (60) Guel H. Zerze, Robert B. Best, and Jeetain Mittal. Modest Influence of FRET Chromophores on the Properties of Unfolded Proteins. Biophys. J., 107(7):1654–1660, 2014.
- (61) Michael Rubinstein and Ralph H Colby. Polymer physics. OUP Oxford, 2003.
- (62) E. P. O’Brien, G. Morrison, B. R. Brooks, and D. Thirumalai. How accurate are polymer models in the analysis of Forster resonance energy transfer experiments on proteins? J. Chem. Phys., 130:124903, 2009.
- (63) Kalyan K Sinha and Jayant B Udgaonkar. Dissecting the non-specific and specific components of the initial folding reaction of barstar by multi-site fret measurements. J. Mol. Biol., 370(2):385–405, 2007.
- (64) T A Laurence, X X Kong, M Jager, and S Weiss. Probing structural heterogeneities and fluctuations of nucleic acids and denatured proteins. Proc. Natl. Acad. Sci. U. S. A., 102(48):17348–17353, 2005.
- (65) David P Goldenberg. Computational simulation of the statistical properties of unfolded proteins. J. Mol. Biol., 326(5):1615–1633, 2003.
- (66) Huan-Xiang Zhou. Dimensions of denatured protein chains from hydrodynamic data. J. Phys. Chem. B, 106(22):5769–5775, 2002.
- (67) Herschel M. Watkins, Anna J. Simon, Tobin R. Sosnick, Everett A. Lipman, Rex P. Hjelm, and Kevin W. Plaxco. Random coil negative control reproduces the discrepancy between scattering and FRET measurements of denatured protein dimensions. Proc. Natl. Acad. Sci. U. S. A., 112(21):6631–6636, 2015.
- (68) Y Oono and M Kohmoto. Renormalization-group thoery of transport-properties of polymer-solutions .1. Dilute-solutions. J. Chem. Phys., 78(1):520–528, 1983.
- (69) J G Kirkwood and J Riseman. The intrinsic viscosities and diffusion constants of flexible macromolecules in solution. J. Chem. Phys., 16(6):565–573, 1948.
- (70) Adarsh D. Pandit, Abhishek Jha, Karl F. Freed, and Tobin R. Sosnick. Small proteins fold through transition states with native-like topologies. J. Mol. Biol., 361(4):755–770, 2006.
- (71) M L Scalley, Q Yi, H D Gu, A McCormack, J R Yates, and D Baker. Kinetics of folding of the IgG binding domain of peptostreptoccocal protein L. Biochemistry, 36(11):3373–3382, 1997.
- (72) J Jacob, B Krantz, R S Dothager, P Thiyagarajan, and T R Sosnick. Early collapse is not an obligate step in protein folding. J. Mol. Biol., 338(2):369–382, 2004.
- (73) JM Fernandez and HB Li. Force-clamp spectroscopy monitors the folding trajectory of a single protein. Science, 303(5664):1674–1678, 2004.
- (74) RB Best and G Hummer. Comment on “Force-clamp spectroscopy monitors the folding trajectory of a single protein”. Science, 308(5721):498b, APR 22 2005.
- (75) Changbong Hyeon, Greg Morrison, David L. Pincus, and D. Thirumalai. Refolding dynamics of stretched biopolymers upon force quench. Proc. Natl. Acad. Sci. U. S. A., 106(48):20288–20293, 2009.