The interaction studied via femtoscopy in p + Nb reactions at
Abstract
We report on the first measurement of and correlations via the femtoscopy method in p+Nb reactions at , studied with the High Acceptance Di-Electron Spectrometer (HADES). By comparing the experimental correlation function to model calculations, a source size for pairs of and a slightly smaller value for of is extracted. Using the geometrical extent of the particle emitting region, determined experimentally with correlations as reference together with a source function from a transport model, it is possible to study different sets of scattering parameters. The correlation is proven sensitive to predicted scattering length values from chiral effective field theory. We demonstrate that the femtoscopy technique can be used as valid alternative to the analysis of scattering data to study the hyperon-nucleon interaction.
I Introduction
The study of the hyperon-nucleon and hyperon-nucleon-nucleon interaction has become more and more crucial in recent years due to its
connection to the modelling of astrophysical objects like neutron stars Petschauer et al. (2015); Schulze et al. (2006); Weissenborn et al. (2012a, b). In the inner core of these objects the
appearance of hyperons is a probable scenario since their creation is often energetically favoured in comparison with a purely nucleonic matter
composition.
However, the appearance of these additional degrees of freedom leads to a softening of the matter equation of state (EOS)
Djapo et al. (2010) being usually too strong making the EOS incompatible with the observation of two
neutron stars of two solar masses Demorest et al. (2010); Antoniadis et al. (2013). This leads to the ’hyperon puzzle’. Many attempts were made to solve this puzzle, e.g. by introducing three-body forces leading to an additional repulsion that can counterbalance the large gravitational
pressure and finally allow for larger star masses Yamamoto et al. (2013, 2014). To constrain the parameter space of such models a detailed knowledge of the hyperon-nucleon
interaction (HNI) is mandatory.
Experimentally, the existence of hypernuclei Hashimoto and Tamura (2006) tells us that the HNI is attractive. An average value of MeV is
extracted from hypernuclear data Hashimoto and Tamura (2006) on the basis of a dispersion relation for hyperons in a baryonic medium at nuclear saturation density (). But more detailed information in dense systems would be needed, for example measurements as a function of the
hyperon-nucleon relative momentum. Another way to study experimentally the HNI is through scattering experiments where the hyperon-nucleon cross
section can be measured. Scattering lengths and effective ranges have been extracted from the available scattering data measured in
the 60ies Sechi-Zorn et al. (1968); Eisele et al. (1971); Alexander et al. (1968). Together with the hypernuclear data, this is so far the only possibility to constrain model predictions. Unfortunately, the statistics provided by scattering data is rather scarce, especially in the low momentum region, which is also the most sensitive region for the determination of the scattering length. Theoretical calculations using a chiral effective field theory (EFT) approach based on QCD motivated symmetries were performed at leading order (LO) and next-to-leading order (NLO), and values of the scattering length and effective range were computed Haidenbauer et al. (2013).
The results are rather different, but both confirm the attractiveness of the interaction for low hyperon momenta. In contrast to the LO results, the NLO solution claims the presence of a negative phase shift in the spin singlet channel for momenta larger than . This translates into a repulsive core of the interaction present at small distances. Unfortunately, phase shifts can only be extracted from theoretical calculations but are not measurable experimentally in the case. This means that other techniques must be developed to verify the existence of a repulsive core for the HNI.
The possible presence of a repulsive core in the HNI could be also very important for the fate of neutron stars leading already to a certain repulsion in the EOS. With the inclusion of three body interactions it is possible to make the hyperon matter even stiffer, eventually being able to overcome the two solar mass barrier set by measurements Lonardoni et al. (2015). The three body forces are poorly constrained and more work is needed to describe them properly.
This work presents an alternative to scattering experiments, using the femtoscopy technique to study the scattering lengths and effective ranges for
hyperon-nucleon pairs produced in p+Nb collisions at 3.5 GeV kinetic energy.
Furthermore, the results could provide additional constraints to theoretical model calculations.
Femtoscopy is based on the investigation of the correlation function of a particle pair at low relative momentum. The correlation signal present in this region is sensitive to the spatio-temporal extension of the particle emitting source created for example in relativistic heavy-ion collisions Pratt (1986); Lisa et al. (2005). Particle correlations are induced by quantum statistics in case of identical particles as well as final state interactions (FSI). Knowing the interaction of the particle pair precisely allows a detailed study of the geometrical extension of the emission region Henzl et al. (2012); Agakishiev et al. (2011); Kotte et al. (2005); Aggarwal et al. (2007); Adams et al. (2005); Aamodt et al. (2011). On the other hand, by reversing the paradigm, it is possible to study FSI if the size of the particle source is established. This is especially interesting in the case where the interaction strength is not that well known Adams et al. (2006); Anticic et al. (2011); Chung et al. (2003); Agakishiev et al. (2010); Adamczyk et al. (2015a, b); Shapoval et al. (2015); Kisiel et al. (2014). We use the latter possibility for the investigation of the interaction strength by comparing the experimentally obtained correlation function to a model containing results of scattering parameters calculated in the EFT framework at LO and NLO. With the HADES setup the correlation function was already measured in Ar+KCl reactions Agakishiev et al. (2010).
In this work, we first reconstruct the size of the emission region which is created in p+Nb reactions by studying the correlation function of proton pairs. The interaction between protons is well understood and additionally these baryon pairs obey similar kinematics as the pairs.
The Ultrarelativistic Quantum Molecular Dynamics (UrQMD) Bass et al. (1998); Bleicher et al. (1999) transport model is then used to compare the to the source sizes. This procedure allows to fix the source size and perform an investigation on the sensitivity of the method to different scattering length and effective range values.
The work is organized in the following way: in section II the experiment is shortly presented, and in section III the correlation technique
is discussed. Section IV shows the data selection and section V the results obtained for the and correlation function.
II The Experiment
The High-Acceptance Di-Electron Spectrometer (HADES) Agakishiev et al. (2009) is a fixed target experiment located in Darmstadt, Germany, at the GSI
Helmholtzzentrum für Schwerionenforschung. Originally designed to measure low mass di-electrons originating from the decay of
vector mesons, HADES is also well suited to measure charged hadrons with a good efficiency. The beams are provided by the synchrotron SIS18 with energies between for heavy ions and up to for protons.
Secondary pion beams with momenta up to are also available at this facility.
The detector system has an almost full azimuthal coverage, while the polar angles are covered from to . The momentum resolution is .
The multiwire drift chambers (MDCs) - two planes in front of and two behind the superconducting magnet (toroidal field) employed for charged particle tracking - and the Multiplicity and Electron Trigger Array (META) consisting of electromagnetic shower detectors (Pre-Shower) and Time-Of-Flight scintillator walls (TOF and TOFINO) are the detector components which have been mainly employed in the analysis steps presented here. The hit points of the MDCs together with the bending of the tracks inside of the magnetic field deliver the momentum information and the particle identification via the specific energy loss () for charged particles. The Time-Of-Flight wall is also used to set the online trigger conditions.
In this analysis, data collected with a proton beam with a kinetic beam energy of incident on a twelve-fold
segmented niobium target () with a beam intensity of are studied. The nuclear interaction probability for this target was .
A first-level trigger (LVL1) was set requiring at least three hits in the Time-Of-Flight wall (M3). In the whole run
events were collected.
III Correlation function
The observable used in femtoscopy to study the particle emitting source or/and the particle interaction is the two-particle correlation function. This is the probability to find two particles with momenta and simultaneously compared to the product of the single particle probabilities, and it reads:
| (1) |
The probabilities are related to the inclusive invariant spectra and . Whenever the value of deviates from unity, one measures a correlation between the particles. One of the goals is to use this correlation signal to conclude about the spatio-temporal extension of the particle emitting source. Eq. (1) can be reformulated as Lisa et al. (2005)
| (2) |
where is the relative momentum of the pair defined as , being and the momenta of the two particles in the pair rest frame (PRF).
For identical particles is linked to the one-dimensional Lorentz scalar , also commonly used in femtoscopy analyses.
is the distribution of pairs from the same event and is a reference sample of uncorrelated pairs. Usually, the latter is
obtained by using an event mixing technique where the particles of interest are combined from different events.
By construction, such a sample is free from two-particle correlations and represents the product of the single particle probabilities as in Eq.
(1). The factor is determined by normalizing to unity in the range of relative momenta
between for and for pairs. The intervals were chosen in a region where the theoretical models deliver for the expected p+Nb source size. Thus the chosen large relative momentum region should be free of any ’femtoscopic’ correlations.
The correlation function defined in Eq. (2) is integrated over all emission directions. For a more
detailed study of the correlation signal including information about the emission direction, the longitudinally co-moving
system (LCMS) can be used. The LCMS is defined as the rest frame along the beam axis where the z-component of the total
momentum of the pair vanishes . The correlation function is calculated with the cartesian ”Bertsch-Pratt” or ”out-side-long” conventions
Lisa et al. (2005). The ”long” component () is the longitudinal component pointing along the beam axis, whereas
”out” () and ”side” () are located transversely to the beam direction by defining that the ”out”
component is aligned with the total transverse momentum of the pair and ”side” being perpendicular to ”out” and ”long”. In the following, we will use the abbreviation ”osl” for labelling.
III.1 Femtoscopic and non-femtoscopic correlations
To gain information about the size of the particle emitting source, it is common to use certain approximations about the emission process and particle momenta involved in the reaction. Following Lisa et al. (2005) Eq. (1) can be rewritten as
| (3) |
where the function represents the two-particle emission or source function containing the distribution of the
relative distances of the pairs in the PRF (indicated by ∗). is the pair relative wave function. The
shape of the correlation function is determined by the wave function, which includes the particles interaction and their
quantum statistics in case of identical particles. For example, for correlations one has to take into account the Coulomb
and strong interaction together with the anti-symmetrization of the wave function Koonin (1977). The interplay of these three effects
and the separation of the protons upon emission lead to a complex structure in the correlation function.
The Coulomb interaction between the particles and the Pauli exclusion
principle lead to a suppression of the correlation signal at very low which increases by decreasing the
source size. The attractive strong interaction in the s-wave channel leads to a positive correlation signal. As a result of all three effects, a characteristic bump structure appears around . The peak height of this bump increases for smaller proton source sizes.
In case of pairs, the correlation signal is dominated by their attractive interaction only and expected to be always positive. An analytical model describing the correlation between non-identical baryon pairs was developed by Lednický and Lyuboshitz Lednicky and Lyuboshits (1982).
An example employing it for correlations can be found in Adams et al. (2006).
The model is based on an effective range expansion of the complex scattering amplitude , where is the total spin of the particle pair, is the scattering length and the effective range. For a Gaussian emission profile of the source with radius the correlation function has the form Lednicky and Lyuboshits (1982),
| (4) | ||||
where is the imaginary (real) part of the complex scattering amplitude, and analytical functions resulting from averaging the square of the wave function over a Gaussian source description.
The factor contains the fraction of pairs emitted in a certain total spin state . We assume unpolarized emission that translates into
for the singlet state and for the triplet state.
Besides the already discussed femtoscopic correlations, there are additional correlations present, e.g. correlations induced
by energy- and momentum conservation. These additional correlations are usually washed out in large systems created in nucleus-nucleus collisions but show up for small systems like p+p, or p+A Abelev et al. (2013), where the particle multiplicities are lower.
The inclusive particle spectra from the same event fulfill the constraints set by kinematics. But in the mixed event sample this condition is not strictly matched. Hence, in the ratio of Eq. (2), an additional correlation is visible at large , where the correlation function should be flat. For this reason these correlations are called long range correlations (LRC).
This LRC could also have an influence at low momenta , where an interplay between femtoscopy and momentum conservation effects
takes place. We account for LRC by introducing an additional correction correlation function which takes care about such momentum conservation effects as explained in section IV.3.
IV Data Analysis
IV.1 Track Selection
Particle tracks are selected requiring a good match between the track segment from the
outer MDC and a META hit point. This selection is applied to get rid of fake and split tracks
(one track reconstructed as two tracks) which would introduce a fake positive correlation in the interesting
region of low relative momenta. Another effect which distorts the correlation function stems from track merging. Particles in pairs of interest are emitted with small spatial separations and very homogeneously meaning with very similar momenta and small opening angles. At a
certain opening angle, the detector starts to merge two distinct tracks into one track because of the finite detector granularity.
This effect introduces an artificial suppression of the yield in the same event distribution for low values of . This is not
the case for the mixed event sample, where only distinct tracks are combined by construction.
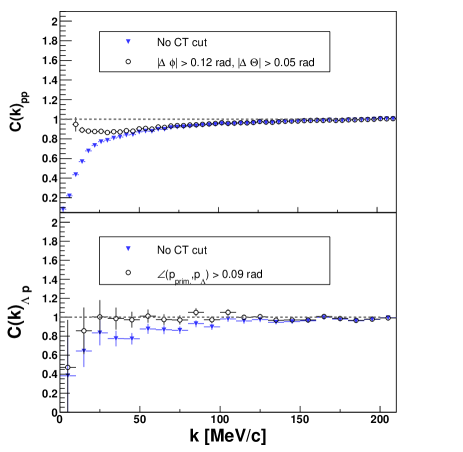
To get rid of this track merging effect, different correction methods depending on the pair under investigation were used.
For pairs the following cuts on the azimuthal and polar relative angles were applied: .
For the pair it is only
possible to introduce a one-dimensional cut because of the limited statistics. The proton has a similar mass as the , thus in the decay most of the decay momentum is transferred to the proton keeping its flight direction similar to the momentum vector and
as a consequence it also points back to the primary vertex. Hence, the primary and secondary protons are emitted with a small opening
angle, leading possibly to track merging.
To reject such pairs, a minimum opening angle of between the primary and the secondary proton is applied. Both cuts were tested with the help of Monte Carlo simulations using the UrQMD as an event generator for and the Giessen Boltzmann-Uehling-Uhlenbeck (GiBUU) Buss et al. (2012) transport code for pairs since GiBUU offers the possibility of scaling the production cross sections for channels including hyperons. The events were filtered through the Geometry and Tracking (GEANT3) package and thus taking
the detector response into account. The effect of the close pair rejection on the correlation function for both types of pairs is illustrated in Fig.
1, where it is clearly visible that the merging is reduced after the cuts are applied. Only statistical errors are shown. Any remaining correlations are corrected for by introducing a new correlation function described in section IV.3. The chosen cut values and their stability were tested by varying them by and the deviations on the final outcomes are included in the systematic error.
IV.2 Protons and Lambda hyperons
Proton identification is carried out by means of the specific energy loss information measured in the MDCs () as well as in TOF or TOFINO () as a function of the momentum and polarity of the particle. Fig. 2 shows the distribution of the specific energy loss versus momentum times polarity of charged particles together with the two-dimensional graphical cuts used for the particle selection.
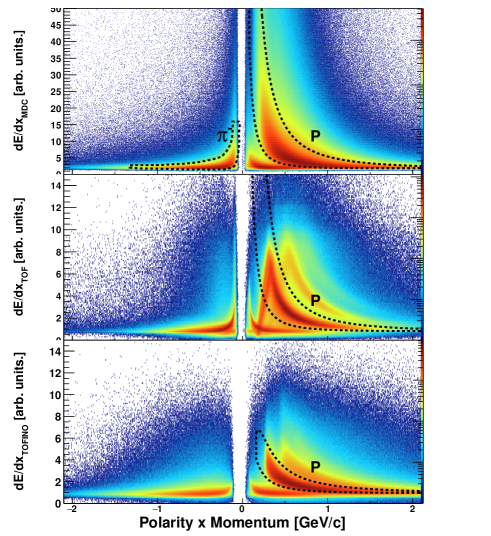
Since TOF/TOFINO have different polar angle coverages and characteristic resolutions Agakishiev et al. (2009), they are treated separately and two additional graphical cuts are employed to select protons.
For the analysis only the energy loss information from the MDCs is used for particle identification
to minimize the loss of statistics due to additional particle identification (PID) cuts. This results in a slightly worse proton purity (see Tab. 2).
The hyperon is identified via its charged decay products Agakishiev et al. (2014), where the branching ratio of this decay channel is
Olive et al. (2014).
Because of the relatively long lifetime of the (), it is possible to apply topological cuts to
suppress the combinatorial background mainly stemming from direct pairs. Four classes of topological cuts are used: (i) a
cut on the distance of closest approach between the daughter tracks , (ii) a cut on the distance of closest
approach of the daughter tracks to the primary vertex , (iii) a cut on the flight distance
of the hyperon evaluated as the distance between the secondary and primary vertex ,
(iv) a cut on the ”pointing angle” between the spatial vector pointing from the primary to the secondary vertex and
the momentum vector. The cuts are optimized by requiring large purities () minimizing
at the same time the signal losses. The pointing angle and
the distance of closest approach of the daughter tracks were fixed to and for all the investigated cut combinations.
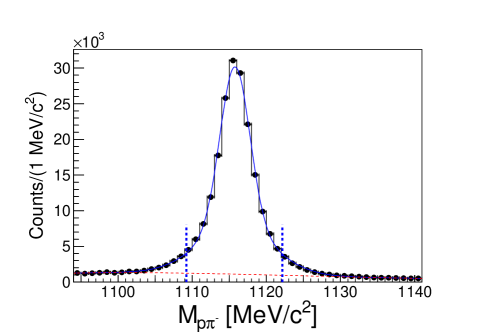
The candidates are constructed with the invariant mass of pairs passing these topological cuts and selected in a interval around the nominal PDG mass Olive et al. (2014). Three different sets of topological cuts were tested to study the effect of different
signal purities in the data sample on the correlation.
A summary of the cut combinations and their corresponding purities can be found in Tab. 1.
| S/(S+B) | ||||
|---|---|---|---|---|
| 1 | 7 | 15 | 52 | 86.1 |
| 2 | 7 | 25 | 57 | 89.6 |
| 3 | 10 | 28 | 61 | 92.5 |
An example of the signal obtained for the most selective cut combination (combination 3) is shown in Fig.
3. To obtain the purity , the background and signal are fitted simultaneously with a polynomial
function for the background and two Gaussians for the signal peak. The number of reconstructed s with this cut combination after the background subtraction
amounts to .
For identified particle pairs the relative momenta are calculated in the PRF to obtain the same event distribution . For the reference sample the event mixing technique is used. The events are selected according to the z-vertex position with a bin width of for pairs and for pairs. This ensures that only events with similar geometrical acceptances are mixed. Additionally, for both types of pairs the events have been grouped in four multiplicity classes of bin width 2 for the multiplicity range and one class for in order to mix only events with similar particle content and kinematics. Such a constrained mixing have been proved important in Kampfer et al. (1993) in case of cluster correlations.
IV.3 Corrections
As discussed in section III, besides the femtoscopic correlations also correlations of non-femtoscopic origin can show up in the correlation function. In the case of p+Nb collisions one deals with a small system which translates into a participant number of Agakishiev et al. (2014). Since the average particle multiplicity per event is , the total energy-momentum conservation for all registered particles is for event mixing more likely to be violated than in reactions. To disentangle correlation signals which are induced by energy and momentum conservation effects, semi-classical transport model simulations are used. These models are free from femtoscopic correlations but include correlations due to kinematic effects. The simulated events were filtered through the HADES acceptance and analyzed with the same cuts as for the experimental data. We used the same transport model predictions as were already used to determine the close track efficiency shown in section IV.1 (UrQMD for , GiBUU for ).
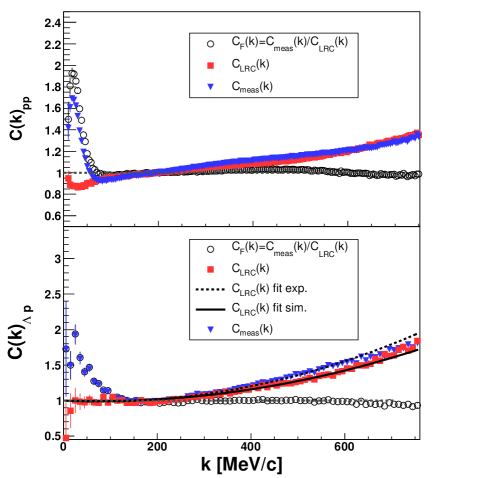
The results of the calculations are depicted in Fig. 4. Both models reproduce the correlations reasonably well at large relative momenta. For this reason, a new variable is defined as the double ratio of the measured correlation function and the correlation function obtained from the simulated data,
| (5) |
Because the simulated correlation function suffers from larger statistical errors compared to the case at low , the baseline is fitted with a polynomial function in the range of . The employed polynomial is
| (6) |
The obtained fit function is extrapolated to the region of low and used to compute the ratio
from Eq. (5). The result of the fit with the polynomial function (6) does not exhibit any significant differences when compared at low relative momenta to the experimental (dashed curve in Fig. 4, bottom panel) as well as to the simulated (solid curve in Fig. 4, bottom panel) correlation function baseline.
The HADES detector measures the single-particle momentum with a finite resolution which depends on the single-particle momentum itself
and the emission polar angle Agakishiev et al. (2009) resulting in an uncertainty of the relative momentum . A smearing of the pair momentum leads to a broadening of the correlation signal and thus to a systematic underestimation of the extracted source size. This is accounted for by a correction factor Adams et al. (2005):
| (7) |
where is the measured correlation function of Eq. (5) corrected for LRC and is the correlation signal for a perfect momentum reconstruction. The ideal correlation function and the smeared correlation function are obtained from Monte Carlo mixed event samples for which the known ideal (input) momenta of the particles are subjected to the HADES momentum reconstruction procedure. To account for the smearing the following correlation functions are defined:
| (8) |
| (9) |
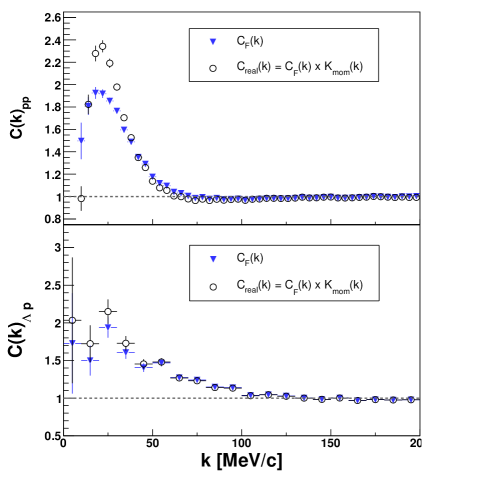
where is calculated with the ideal input momenta and by using the reconstructed momenta. are the mixed event distributions and are weighted by a correlation weight. The weight factor is obtained by solving Eq. (3) assuming a Gaussian source profile and using the proper interaction for the pairs Day (1981); Bodmer and Usmani (1985). The source parameters are chosen such that the smeared correlation function (9) matches the experimental data. The relation (9) takes the effect of momentum smearing into account: The particles are correlated according to the ideal momentum , however the detector reconstructs it with a finite resolution. The smeared correlation signal in Eq. (9) is obtained by weighting the smeared momentum distributions with the function evaluated for the ideal momentum. The influence of the corrections due to the momentum resolution on the correlation functions is shown in Fig. 5.
Particle misidentification reduces the correlation strength. This effect is corrected for by using following relation Anticic et al. (2011); Agakishiev et al. (2010):
| (10) |
where and are the purity corrected and uncorrected correlation functions, respectively. Purity correction is the last correction step and for this reason is identical to of Eq. (7). The parameter is the product of the PID purity of particles and .
Eq. (10) is valid under the assumption that residual correlations between the particles can be
neglected. Such correlations emerge when the originally correlation between a parent pair is transferred partly to the daughter pair after the weak decay of one or both particles of the parent pair. We benefit from the rather low kinetic beam energy of , where the number of higher lying and long living baryon resonances is limited Agakishiev et al. (2015a, 2013). In the case it is ruled out by the available phase space in the final state that both protons originate from weak decays (e.g. ). The fraction of protons stemming from a decay compared to the total number of protons is about 0.003 estimated with UrQMD simulations, thus this feed down can be neglected. This means that the proton correlation function is constructed with direct protons only.
The main feed down to is coming from decay. hyperons decay electromagnetically into the () Olive et al. (2014) final state and close to
the production vertex because of the very short lifetime. This means that the measured yield is a superposition of directly produced plus the component coming from the feed down of . The ratio of directly produced to all measured was
predicted by a statistical model analysis in p+Nb reactions to be on the basis of the measured particle multiplicities Agakishiev et al. (2015b). To consider possible deviations from this predicted ratio we changed the value within a range of and included the deviation of the source size in the systematic errors.
To model possible residual correlations having their origin from pairs we have to take two aspects into account. Firstly, the experimental information on the interaction is rather scarce due to the difficulty to detect the photon from the decay. Secondly, the interaction needs for its description a larger parameter space than because of two different total isospin configurations (), and the configuration couples inelastically to the channel. We studied residual correlations of with the help of Stavinskiy et al. (2007); Kisiel et al. (2014) by calculating the correlation function for a source size of . After the decay into a nearly flat uncorrelated behaviour is extracted. This means that the already small correlation is washed out after the decay. Experimental studies confirm the smaller interaction of by measuring the energy dependence of the total cross section of and Abdel-Bary et al. (2010). The data is sufficiently described with a phase space
parametrization whereas for the case also final-state interactions had to be taken into account.
Finally, the parameters for the corrections were obtained with help of the UrQMD event generator. The events where analyzed with the same graphical cut selections as applied for experimental data using the specific energy loss for the proton identification. The number of correctly identified protons by this procedure determined and the purity calculated. The proton purity differs for the and cases because we use only the MDC energy loss information for the proton identification in the pair. The (primary) purity is obtained from the invariant mass spectrum by calculating the background beneath the peak in a region around the pole mass times the fraction of directly produced stated above. The obtained purities are listed in Tab. 2.
| 0.99 | 0.99 | 0.98 | |
| (comb. 1) | 0.86 0.82 | 0.97 | 0.68 |
V Results and Discussion
V.1 Source size extraction
After applying all corrections to the correlation functions the first goal is to determine the size of the source where the particles are emitted from. The source size for the and pairs can be extracted either by fitting the experimental correlation function or
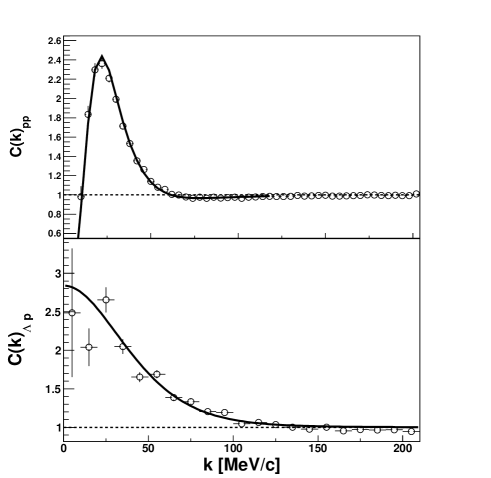
with the help of UrQMD simulations. First, the fitting method is applied and the source size is extracted with help of solving Eq. (3) numerically for and the Lednický model of Eq. (4) for . Both models assume a Gaussian source profile , and for the interaction we use the strong interaction potential from
Day (1981). The scattering length and effective ranges for the interaction have been used from a NLO calculation for a
cutoff of (, , , ) Haidenbauer et al. (2013).
Fig. 6 shows the results from the fits that allow to extract the radii.
For pairs a source size of is obtained. The systematic errors are all quadratically added and estimated by variations of the close track
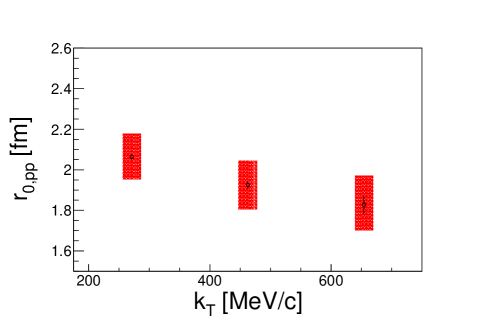
rejection cuts, normalization of the correlation function, momentum resolution correction within 20 , and changing the interaction potential between the protons. For pairs it is also possible to investigate the source size as a function of the transverse momentum of the pair. Fig. 7 shows the source radius as a function of in an interval of . At higher transverse momenta we see a slow drop of the source size of
about . Such a decrease of the source radius is commonly measured in heavy-ion collisions where it arises from a collective expansion of the particle emitting system inducing a correlation of coordinate and momentum space. But also in smaller and elementary systems a dependence on the transverse momentum is measured, see Nigmatkulov et al. (2016) and references therein. The rather moderate drop of the source size could be an effect of the decreasing cross section in this momentum region such that rescattering of protons becomes less important going to larger values which is reflected in smaller source sizes. Such a behaviour was also investigated in e()+A reactions Stavinsky et al. (2004).
For the source size we obtained a value of . The source size is smaller than the source extracted from correlations. Such an observation was also made in the Ar+KCl system Agakishiev et al. (2010).
In the p+Nb case, this is mainly due to the different scattering cross-sections for and in the nucleus and to the different production processes. Indeed the scattering probability for is smaller than the (especially proton-neutron) scattering Olive et al. (2014) which could lead to different emission times for protons. In a different study by HADES using a statistical model approach to describe the particle multiplicities of the p+Nb system Agakishiev et al. (2015b) it was also seen that the strangeness correlation radius is smaller than the correlation radius determined for non-strange particles .
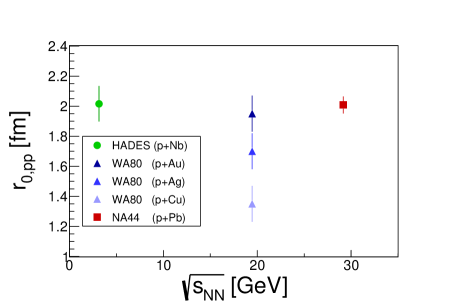
The obtained Gaussian radii may be compared to measurements from other experiments. For the radius only data from heavy-ion collisions are available, which are difficult to compare with, since the emission regions in AA collisions are larger than in pA collisions. The invariant one-dimensional radii were measured by WA80 at SPS Awes et al. (1995) (, p+(Au,Ag,Cu,C)), NA44 at SPS Boggild et al. (1999) (, p+Pb), and in the Fermilab H2-Ne bubble chamber experiment Azimov et al. (1984) (, p+Ne) where radii between were derived depending on the momentum interval of the emitted pair. In Fig. 8 we compare the HADES source radius obtained for p+Nb collisions to the measurements of WA80 and NA44 for medium size and large target nuclei. The derived source sizes sizes range from 1.4 to 2 fm and show a dependence on the target mass number in case of the WA80 data. Comparing similar systems sizes of p+Nb and p+Ag could hint to a energy dependence of the source radius on the beam energy. More data would be needed to clarify if such a trend exists.
V.2 Final State Interaction
In order to extract the strength of the FSI, the source size must be fixed.
The UrQMD simulation is used to determine the and source for p+Nb reactions at GeV.
If the simulated source size is found to be consistent with the results from the fit shown in Fig. 6,
the UrQMD results for the source can be used to fix in the Lednický model and test
the final state interaction.
Polar acceptance cuts are applied to the UrQMD output to include the constraints by the HADES acceptance.
Since UrQMD is free from femtoscopy effects, an afterburner code, CRAB (v3.0) Wang and Pratt (1999), is used to include
them. In CRAB the same potential was
incorporated as the one used for the fitting of the experimental correlation function.
A comparison of the 1D and projections of the 3D correlation function calculated with UrQMD+CRAB and the experimental data are displayed in Fig. 9. As can be seen in Fig. 9, UrQMD+CRAB delivers a good description of the correlation signal for the 1D as well as for the 3D cases, hence the particle emission for protons is well implemented in the model, at least integrated over .
For the determination of the source size the
UrQMD model was slightly modified. UrQMD uses the additive quark model (AQM) Goulianos (1983) for calculations of hyperon-nucleon (and the respective
excited resonances) scattering cross sections. The derived AQM cross sections are independent of the energy involved in the scattering process. In
particular, for the elastic cross section of the value predicted by the AQM amounts to .
However, measurements of the elastic cross section show a strong rise for lower momenta. Because we deal with
low-energetic hyperons at SIS18 beam energies, the cross section for elastic scattering was changed using
the parametrization obtained from the EFT-based LO and NLO calculations Haidenbauer et al. (2013).
The LO as well as the NLO results take the rising of the total cross section into account.
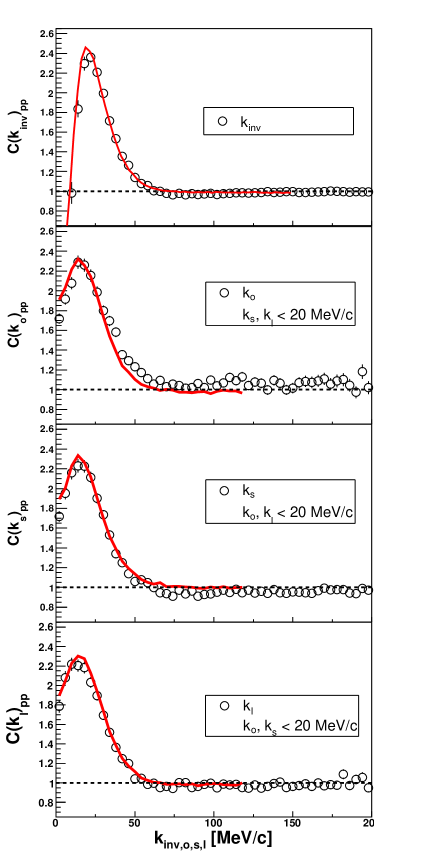
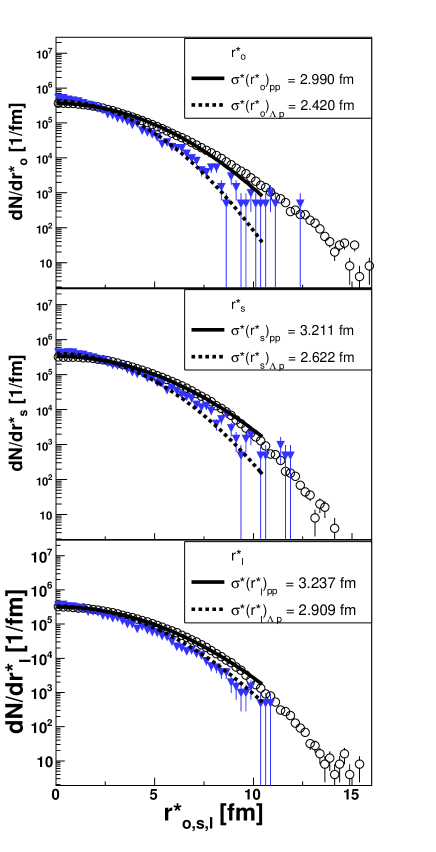
To investigate the source size distribution the relative pairs distances in the LCMS are calculated and then boosted to the PRF Lisa et al. (2005). The distribution of the relative coordinates in the PRF are depicted in Fig. 10 for (blue triangles) and , respectively (open circles). Also in the UrQMD calculations, the difference in the distributions for and pairs points to different emission processes. To extract the radii, the distributions shown in Fig. 10 are fitted with a Gaussian function in the range :
| (11) |
The widths are related to the source size in the o,s,l directions as . The fit results are shown by the full lines in Fig. 10.
A 1D emission width can be defined by averaging over all three emission directions Kisiel (2010):
| (12) |
A ratio between the 1D radius obtained for and p pairs is defined () and found to be equal to and for the two different assumptions
on the cross section. The two results are rather similar which means that the source function does not strongly depend on the details of the scattering. The source size measurement with pairs together with the above obtained source ratios allows to calculate the source size to , which are very similar to the one obtained by fitting the correlation function directly. The errors of these source radii are dominated by the errors of the source size.
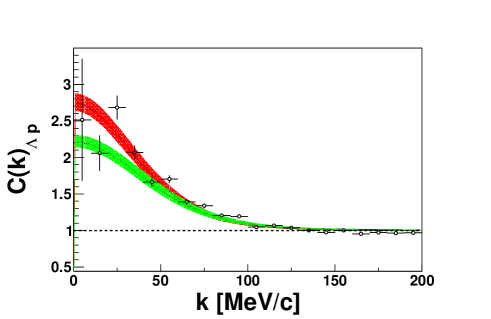
With the knowledge of the source radii we are in the position to test the L0 and NLO predictions of scattering parameters. The values of the NLO scattering lengths and effective ranges were already mentioned in section V.1. For the LO parameters we take the results calculated at the same cutoff value of as for the NLO case (, , , ) Haidenbauer et al. (2013). A comparison of the correlation functions using the LO (green band) and NLO (red band) scattering parameters is shown in Fig. 11.
It is obvious, that the two theoretical correlation functions differ at low relative momenta where their behaviours are mainly governed by the scattering length, and the effective range plays a minor role.
The coloured bands associated to the theoretical calculations are obtained by varying the source radius within
the errors. Unfortunately, the statistics analyzed here is not sufficient to draw a definite conclusion. However, the method appears sensitive to different scattering length parameters and represents an alternative to scattering experiments used to study the hyperon-nucleon interaction in details.
In particular, there are no scattering data available at all in the region of very low relative hyperon-nucleon momentum ().
VI Summary
To summarize, we presented the hitherto first measurement of the correlation function in pA reactions. The correlation signal was used as a benchmark to test the possibility of fixing the source size on the basis of UrQMD calculations. This way, the source was estimated. The final state interaction strength between was investigated by comparing the experimental correlation function to model calculations using scattering parameters from EFT computations. The statistics was not enough to clearly distinguish between model predictions (an increase by a factor ten would be sufficient) but it was shown that the femtoscopy method is able to provide data which can be investigated with a theoretical framework with the necessary sensitivity to study carefully final state interactions if the size of the particle emitting region is known beforehand. The femtoscopy technique to study interactions between particles can be applied to many colliding systems at very different energies, which can help to improve the understanding of hyperon-nucleon interactions. With the planned update of the HADES setup including a electromagnetic calorimeter the measurement of the correlation function is accessible and it is a planned analysis in the HADES strangeness program.
VII Acknowledgments
The authors are grateful to M. Bleicher and for the stimulating discussions. The HADES collaboration gratefully acknowledges the support by the grants
LIP Coimbra, Coimbra (Portugal) PTDC/FIS/113339/ 2009 SIP JUC Cracow, Cracow (Poland) NCN grant 2013/ 10/M/ ST2/00042, N N202 286038 28-JAN-2010, NN202198639 01-OCT-2010 Helmholtz-Zentrum Dresden-Rossendorf (HZDR), Dresden (Germany) BMBF 06DR9059D, TU München, Garching (Germany), MLL München DFG EClust 153 VH-NG-330 BMBF 06MT9156 TP5 GSI TMKrue 1012 NPI AS CR, Rez, Rez (Czech Republic) MSMT LC07050 GAASCR IAA100480803 USC - S. de Compostela, Santiago de Compostela (Spain) CPAN: CSD2007-00042 Goethe-University, Frankfurt (Germany) HA216/EMMI HIC for FAIR (LOEWE) BMBF: 06FY9100I GSI FE EU Contract No. HP3-283286.
References
- Petschauer et al. (2015) S. Petschauer, J. Haidenbauer, N. Kaiser, U.-G. Mei ner, and W. Weise, (2015), arXiv:1507.08808 [nucl-th] .
- Schulze et al. (2006) H. J. Schulze, A. Polls, A. Ramos, and I. Vidana, Phys. Rev. C73, 058801 (2006).
- Weissenborn et al. (2012a) S. Weissenborn, D. Chatterjee, and J. Schaffner-Bielich, Progress in strangeness nuclear physics. Proceedings, ECT Workshop on Strange Hadronic Matter, Trento, Italy, September 26-30, 2011, Nucl. Phys. A881, 62 (2012a), arXiv:1111.6049 [astro-ph.HE] .
- Weissenborn et al. (2012b) S. Weissenborn, D. Chatterjee, and J. Schaffner-Bielich, Phys. Rev. C85, 065802 (2012b), [Erratum: Phys. Rev.C90,no.1,019904(2014)], arXiv:1112.0234 [astro-ph.HE] .
- Djapo et al. (2010) H. Djapo, B.-J. Schaefer, and J. Wambach, Phys. Rev. C81, 035803 (2010), arXiv:0811.2939 [nucl-th] .
- Demorest et al. (2010) P. Demorest, T. Pennucci, S. Ransom, M. Roberts, and J. Hessels, Nature 467, 1081 (2010), arXiv:1010.5788 [astro-ph.HE] .
- Antoniadis et al. (2013) J. Antoniadis et al., Science 340, 6131 (2013), arXiv:1304.6875 [astro-ph.HE] .
- Yamamoto et al. (2013) Y. Yamamoto, T. Furumoto, N. Yasutake, and T. A. Rijken, Phys. Rev. C88, 022801 (2013), arXiv:1308.2130 [nucl-th] .
- Yamamoto et al. (2014) Y. Yamamoto, T. Furumoto, N. Yasutake, and T. A. Rijken, Phys. Rev. C90, 045805 (2014), arXiv:1406.4332 [nucl-th] .
- Hashimoto and Tamura (2006) O. Hashimoto and H. Tamura, Prog. Part. Nucl. Phys. 57, 564 (2006).
- Sechi-Zorn et al. (1968) B. Sechi-Zorn, B. Kehoe, J. Twitty, and R. A. Burnstein, Phys. Rev. 175, 1735 (1968).
- Eisele et al. (1971) F. Eisele, H. Filthuth, W. Foehlisch, V. Hepp, and G. Zech, Phys. Lett. B37, 204 (1971).
- Alexander et al. (1968) G. Alexander, U. Karshon, A. Shapira, G. Yekutieli, R. Engelmann, H. Filthuth, and W. Lughofer, Phys. Rev. 173, 1452 (1968).
- Haidenbauer et al. (2013) J. Haidenbauer, S. Petschauer, N. Kaiser, U. G. Meissner, A. Nogga, and W. Weise, Nucl. Phys. A915, 24 (2013), arXiv:1304.5339 [nucl-th] .
- Lonardoni et al. (2015) D. Lonardoni, A. Lovato, S. Gandolfi, and F. Pederiva, Phys. Rev. Lett. 114, 092301 (2015), arXiv:1407.4448 [nucl-th] .
- Pratt (1986) S. Pratt, Phys. Rev. D33, 1314 (1986).
- Lisa et al. (2005) M. A. Lisa, S. Pratt, R. Soltz, and U. Wiedemann, Ann. Rev. Nucl. Part. Sci. 55, 357 (2005), arXiv:nucl-ex/0505014 [nucl-ex] .
- Henzl et al. (2012) V. Henzl et al., Phys. Rev. C85, 014606 (2012), arXiv:1108.2552 [nucl-ex] .
- Agakishiev et al. (2011) G. Agakishiev et al. (HADES), Eur. Phys. J. A47, 63 (2011).
- Kotte et al. (2005) R. Kotte et al. (FOPI), Eur. J. Phys. A23, 271 (2005), arXiv:nucl-ex/0409008 [nucl-ex] .
- Aggarwal et al. (2007) M. M. Aggarwal et al. (WA98), (2007), arXiv:0709.2477 [nucl-ex] .
- Adams et al. (2005) J. Adams et al. (STAR), Phys. Rev. C71, 044906 (2005), arXiv:nucl-ex/0411036 [nucl-ex] .
- Aamodt et al. (2011) K. Aamodt et al. (ALICE), Phys. Lett. B696, 328 (2011), arXiv:1012.4035 [nucl-ex] .
- Adams et al. (2006) J. Adams et al. (STAR), Phys. Rev. C74, 064906 (2006), arXiv:nucl-ex/0511003 [nucl-ex] .
- Anticic et al. (2011) T. Anticic et al. (NA49), Phys. Rev. C83, 054906 (2011), arXiv:1103.3395 [nucl-ex] .
- Chung et al. (2003) P. Chung et al., Phys. Rev. Lett. 91, 162301 (2003), arXiv:nucl-ex/0212028 [nucl-ex] .
- Agakishiev et al. (2010) G. Agakishiev et al. (HADES), Phys. Rev. C82, 021901 (2010), arXiv:1004.2328 [nucl-ex] .
- Adamczyk et al. (2015a) L. Adamczyk et al. (STAR), Phys. Rev. Lett. 114, 022301 (2015a), arXiv:1408.4360 [nucl-ex] .
- Adamczyk et al. (2015b) L. Adamczyk et al. (STAR), Nature (2015b), 10.1038/nature15724, arXiv:1507.07158 [nucl-ex] .
- Shapoval et al. (2015) V. M. Shapoval, B. Erazmus, R. Lednicky, and Yu. M. Sinyukov, Phys. Rev. C92, 034910 (2015), arXiv:1405.3594 [nucl-th] .
- Kisiel et al. (2014) A. Kisiel, H. Zbroszczyk, and M. Szymanski, Phys. Rev. C89, 054916 (2014), arXiv:1403.0433 [nucl-th] .
- Bass et al. (1998) S. Bass, M. Belkacem, M. Bleicher, M. Brandstetter, L. Bravina, et al., Prog.Part.Nucl.Phys. 41, 255 (1998), arXiv:nucl-th/9803035 [nucl-th] .
- Bleicher et al. (1999) M. Bleicher et al., J. Phys. G25, 1859 (1999), arXiv:hep-ph/9909407 [hep-ph] .
- Agakishiev et al. (2009) G. Agakishiev et al. (HADES Collaboration), Eur.Phys.J. A41, 243 (2009), arXiv:0902.3478 [nucl-ex] .
- Koonin (1977) S. E. Koonin, Phys. Lett. B70, 43 (1977).
- Lednicky and Lyuboshits (1982) R. Lednicky and V. L. Lyuboshits, Sov. J. Nucl. Phys. 35, 770 (1982), [Yad. Fiz.35,1316(1981)].
- Abelev et al. (2013) B. Abelev et al. (ALICE), Phys. Rev. D87, 052016 (2013), arXiv:1212.5958 [hep-ex] .
- Buss et al. (2012) O. Buss, T. Gaitanos, K. Gallmeister, H. van Hees, M. Kaskulov, O. Lalakulich, A. B. Larionov, T. Leitner, J. Weil, and U. Mosel, Phys. Rept. 512, 1 (2012), arXiv:1106.1344 [hep-ph] .
- Agakishiev et al. (2014) G. Agakishiev et al. (HADES), Eur. Phys. J. A50, 81 (2014), arXiv:1404.3014 [nucl-ex] .
- Olive et al. (2014) K. Olive et al. (Particle Data Group), Chin.Phys. C38, 090001 (2014).
- Kampfer et al. (1993) B. Kampfer et al., Phys. Rev. C48, 955 (1993).
- Day (1981) B. D. Day, Phys. Rev. C 24, 1203 (1981).
- Bodmer and Usmani (1985) A. R. Bodmer and Q. N. Usmani, Phys. Rev. C31, 1400 (1985).
- Agakishiev et al. (2015a) G. Agakishiev et al. (HADES), Phys. Lett. B742, 242 (2015a), arXiv:1410.8188 [nucl-ex] .
- Agakishiev et al. (2013) G. Agakishiev et al. (HADES), Phys. Rev. C87, 025201 (2013), arXiv:1208.0205 [nucl-ex] .
- Agakishiev et al. (2015b) G. Agakishiev et al. (HADES), (2015b), arXiv:1512.07070 [nucl-ex] .
- Stavinskiy et al. (2007) A. Stavinskiy, K. Mikhailov, B. Erazmus, and R. Lednicky, (2007), arXiv:0704.3290 [nucl-th] .
- Abdel-Bary et al. (2010) M. Abdel-Bary et al. (COSY-TOF), Eur. Phys. J. A46, 27 (2010), [Erratum: Eur. Phys. J.A46,435(2010)], arXiv:1008.4287 [nucl-ex] .
- Nigmatkulov et al. (2016) G. A. Nigmatkulov et al., Phys. Lett. B753, 458 (2016).
- Stavinsky et al. (2004) A. V. Stavinsky et al. (CLAS), Phys. Rev. Lett. 93, 192301 (2004), arXiv:hep-ex/0405064 [hep-ex] .
- Awes et al. (1995) T. Awes et al., Zeitschrift für Physik C65, 207 (1995).
- Boggild et al. (1999) H. Boggild et al. (NA44), Phys. Lett. B458, 181 (1999), arXiv:nucl-ex/9906006 [nucl-ex] .
- Azimov et al. (1984) S. A. Azimov et al., Phys. Rev. D29, 1304 (1984).
- Wang and Pratt (1999) F. Wang and S. Pratt, Phys. Rev. Lett. 83, 3138 (1999).
- Goulianos (1983) K. A. Goulianos, Phys. Rept. 101, 169 (1983).
- Kisiel (2010) A. Kisiel, Phys. Rev. C81, 064906 (2010).