Modes of decay in neutron-rich nuclei
Abstract
We calculate the ground, first intrinsic excited states and density distribution for neutron-rich thorium and uranium isotopes, within the framework of relativistic mean field(RMF) approach using axially deformed basis. The total nucleon densities are calculated, from which the cluster-structures inside the parent nuclei are determined. The possible modes of decay, like -decay and -decay are analyzed. We find the neutron-rich isotopes are stable against -decay, however they are very much unstable against -decay. The life time of these nuclei predicted to be tens of second against -decay.
PACS Number(s): 23.40.-s, 23.60.+e, 24.75.+i
1 Introduction
Since the discovery of -decay in 1896 by Becquerel, it has been remained a powerful tool to study the nuclear structure. The -decay theory was proposed by Gamow, Condon and Gurney in 1928. In simple quantum mechanical view -decay is a quantum tunneling through Coulomb barrier, which is forbidden by the classical mechanics. The -decay is not the only decay mode found in the heavy nuclei, we can find other exotic decay modes like -decay, spontaneous fission and - decay [1, 2, 3, 4, 5, 6, 7, 8, 9]. In -decay , smaller nuclei like 16O, 12C, 20Ne and many other nuclei emits from a bigger nucleus. In the superheavy region of the nuclear chart, the prominent modes are the -decay and spontaneous fission along the -stability line. In 1934 E. Fermi and his collaborators showed a huge amount of energy is produced when heavy elements like uranium and thorium are irradiated with slow neutrons [10]. The theory of the fission process was given by Meitner in 1939 [11]. In this process a parent nucleus goes from the ground state to scission point through a deformation and then split into two daughter nuclei. This decay process can be described as an interplay between the nuclear surface energy [12, 13, 14] coming from the strong interaction and the Coulomb repulsion.
Recently, uranium and thorium isotopes have attracted a great attention in nuclear physics due to the thermally fissile nature of some of their isotopes. These thermally fissile materials have tremendous importance in energy production. Till date, the known thermally fissile nuclei are 233U, 235U and 239Pu. Out of which only 235U has a long life time and the only thermally fissile isotope available in nature [15]. Thus, presently it is an important area of research to look for any other thermally fissile nuclei apart from 233U, 235U and 239Pu. Interestingly, Satpathy, Patra and Choudhury [15] showed that uranium and thorium isotopes with neutron number N=154-172 have thermally fissile property. They show that these nuclei have low fission barrier with a significantly large barrier width, which makes stable against the spontaneous fission. As these nuclei are stable against spontaneous fission, thus the prominent decay modes may be the emission of -, - and -particles from the neutron-rich thermally fissile (uranium and thorium) isotopes.
The paper is organized as follows: In Sec. 2, a brief formalism on RMF is given. The results obtained from our calculations for density distributions along with neutron-proton asymmetry for Th and U isotopes are discussed in Sec. 3. In this section, various decay modes are calculated using either empirical formula or by using the well known double folding formalism with M3Y nucleon-nucleon potential. Finally, a concluding remark is given in Sec. 4.
2 Relativistic Mean Field Formalism
We investigated these decays in the framework of an axially deformed relativistic mean field (RMF) formalism [16, 17, 18, 19, 20, 23, 24] with the well known NL3 parameter set [25] for all our calculations. We start with the relativistic Lagrangian density of nucleon-meson many-body system, which describes the nucleons as Dirac spinors interacting through the exchange of scalar mesons (), isoscalar vector mesons () and isovector mesons ().
| (1) | |||||
The field for the -meson is denoted by , that for
the -meson by and for the isovector -meson by
. denotes the electromagnetic field.
The are the Dirac spinors for the nucleons whose third component
of isospin is denoted by . Here , , and
are the coupling constants for
, , mesons and photon, respectively. ,
and are the parameters for the nonlinear terms of -
and -mesons. M is the mass of the nucleon and ,
and are the masses of the , and
-mesons, respectively. ,
and are the field tensors for the ,
and the photon fields, respectively[23].
From the classical Euler-Lagrangian equation, we get the Dirac-equation
and Klein- Gordan equation for the nucleon and meson field respectively.
The Dirac-equation for the nucleon is solved by expanding the Dirac
spinor into lower and upper component, while the mean field equation
for the Bosons are solved in deformed harmonic oscillator basis
with as the initial deformation parameter. The nucleon equation
along with different meson equation form a coupled set of equations,
which can be solved by iterative method. Various types of densities
such as baryon (vector), scalar, isovector and proton (charge) densities
are given as
| (2) | |||||
| (3) | |||||
| (4) | |||||
| (5) |
The calculations are simplified under the shadow of various symmetries like conservation of parity, no-sea approximation and time reversal symmetry, which kills all spatial components of the meson fields and the anti-particle states contribution to nuclear observable. The center of mass correction is calculated with the non-relativistic approximation, which gives (in MeV). The quadrupole deformation parameter is calculated from the resulting quadropole moments of the proton and neutron. The binding energy and charge radius are given by well known relation [21, 22, 23].
The effect of pairing interactions is added in the BCS formalism. We consider only T=1 channel of pairing correlation, i.e., pairing between proton-proton and neutron-neutron. In such case, a nucleon of quantum state pairs with another nucleons having same value with quantum state , which is the time reversal partner of other. The inclusion of pairing correlation of the form or to the relativistic lagrangian violates the particle number conservation [26]. The general expression for pairing interaction to the total energy in terms of occupation probabilities and is written as [27, 26]:
| (6) |
with pairing force constant. The variational approach with respect to the occupation number gives the BCS equation [27]:
| (7) |
with .
The densities with occupation number is defined as:
| (8) |
For the pairing gap () of proton and neutron is taken from the phenomenological formula of Madland and Nix [28]:
| (9) | |||
| (10) |
where, , MeV, , and .
The chemical potentials and are determined by the particle numbers for neutrons and protons. The pairing energy of the nucleons using equation (7) and (8) can be written as:
| (11) |
In constant pairing gap calculation, for a particular value of pairing gap and force constant , the pairing energy diverges, if it is extended to an infinite configuration space. In fact, in all realistic calculations with finite range forces, the contribution of states of large momenta above the Fermi surface (for a particular nucleus) to decreases with energy. Therefore, the pairing window in all the equations are extended upto the level as a function of the single particle energy. The factor 2 has been determined so as to reproduce the pairing correlation energy for neutrons in 118Sn using Gogny force [23, 26, 29]. In numerical calculations, the number of oscillator shell for Fermions and Bosons NF = NB = 20 are used to evaluate the physical observable with the pairing gaps of eqns. (9) and (10) in the BCS pairing scheme.
3 Mode of decays
In this manuscript, we will discuss about various modes of decay encountered by superheavy nuclei both in the -stability line as well as away from it. This is important, because the utility of superheavy and mostly the nuclei which are away from stability lines depend very much on their life time. For example, we do not get 233U and 239Pu in nature, because of their short life time, although these two nuclei are extremely useful for energy production. That is why 235U is the most necessary isotope in the uranium series for its thermally fissile nature in the energy production in fission process both for civilian as well as for military use. The common modes of instability for such heavy nuclei are spontaneous fission, -, - and -decay. All these decays depend on the internal structure of the nucleus, mostly on the density distributions of protons, neutrons or as a whole. Thus, before going to discuss the decay modes, we will highlight some features of the density distributions for some selected cases.
3.1 Spherical density distribution for some selected nuclei
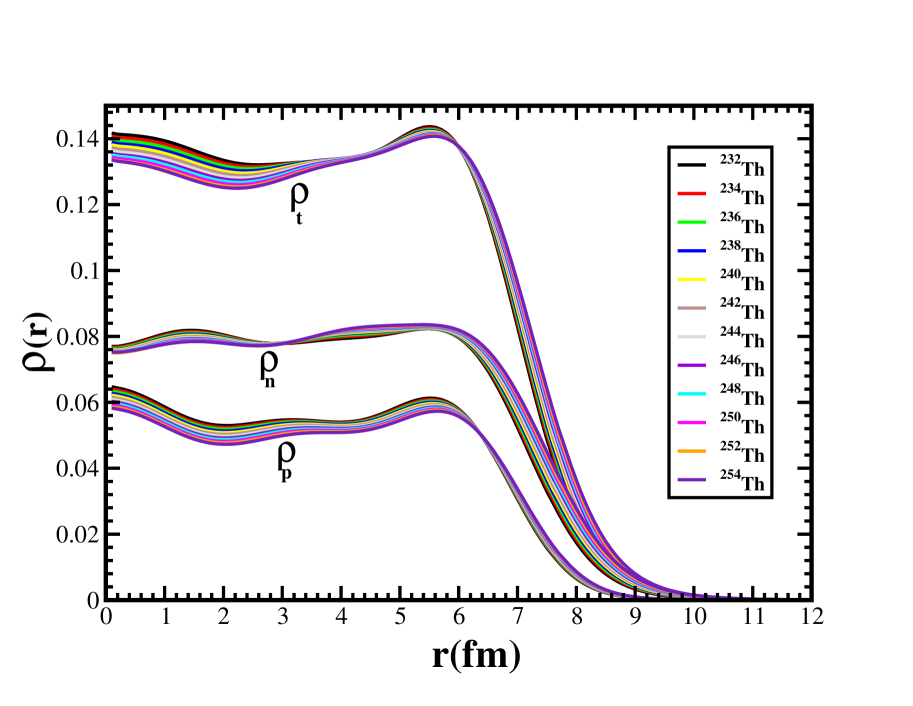
We have shown the spherical density distributions for some Th isotopes in Fig.1. Here, the proton , neutron and total density (combination of and ) are plotted as a function of radius. From the figure, it is clear that the neutron and proton densities increase monotonically with increase of mass number A. The shell structure of the nucleus is clearly visible from the humps appeared in the central region of the density plot. In general, the density has an uniform spread for a large area, about 6-7 fm, which appears like a big drop of liquid. Similar density distributions for uranium isotopes is also observed, which is not shown. The detailed internal structure can be more clear from the two-dimensional contour plot of the density, which are depicted in the subsequent subsections.
3.2 Deformed density distribution for some selected nuclei
The clusterization of nucleons inside the nucleus in the framework of RMF formalism is a bridge between microscopic and macroscopic(liquid drop) picture. In liquid drop model, the nucleon moves inside the nucleus similar to the phenomenon of Brownion motion. As a result, one estimates the mean free path to be 1.6 fm, i.e. the nucleon travels a distance of before it collides with another nucleon. Although, the RMF formalism is based on the single-particle motion of nucleon, (nucleons can be identified with the four quantum number (nljm)) it behaves also as a liquid drop to some extent. Because of this nature (the liquid drop model), the nucleons form cluster in certain region of the nucleus, which we have estimated through the densities and given a rough estimation in Table 1. The densities are obtained from RMF(NL3) in the positive quadrant of the plane parallel to the symmetry z-axis. These are evaluated in the zr-plane on the first quadrant, where x=y=r⟂. We plot the total matter density , where and are the neutron and proton density distribution respectively, for 232-240Th in Fig. 2,254-258Th in Fig. 3 and for 230-236U in Fig. 4,248-256U in Fig. 5.
The colour code index is also given to understand the degree of nucleons distribution, for example the red colour corresponds to maximum density and the blue or white is the minimum or zero-density region.
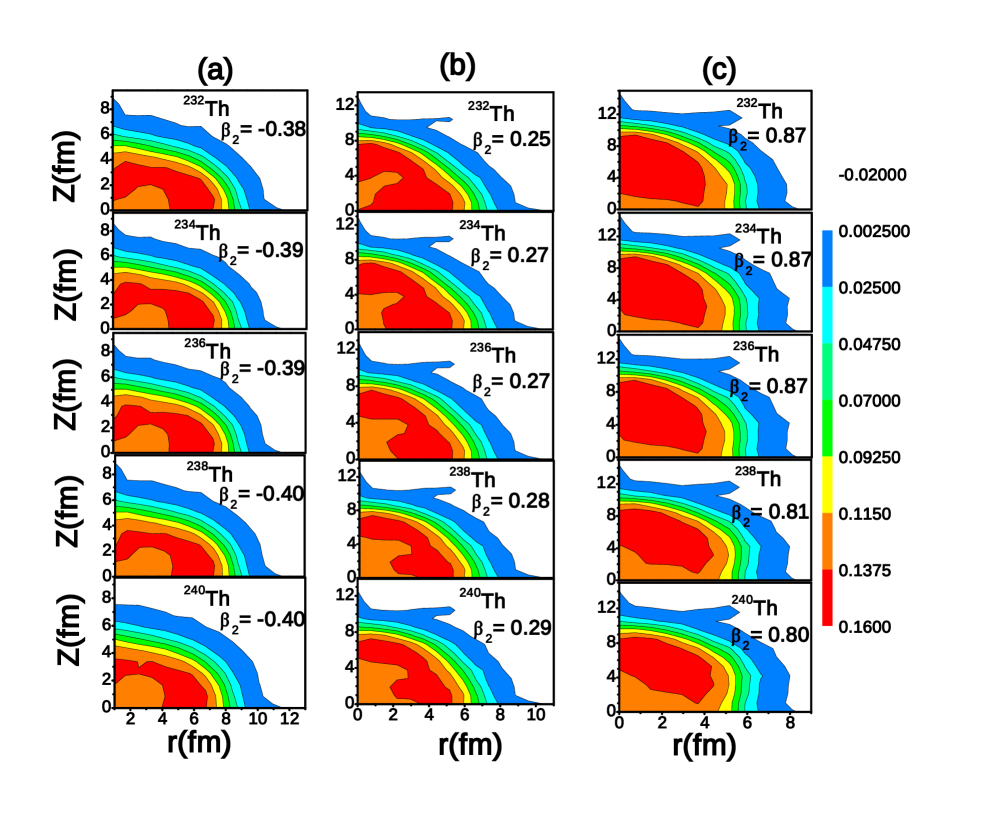
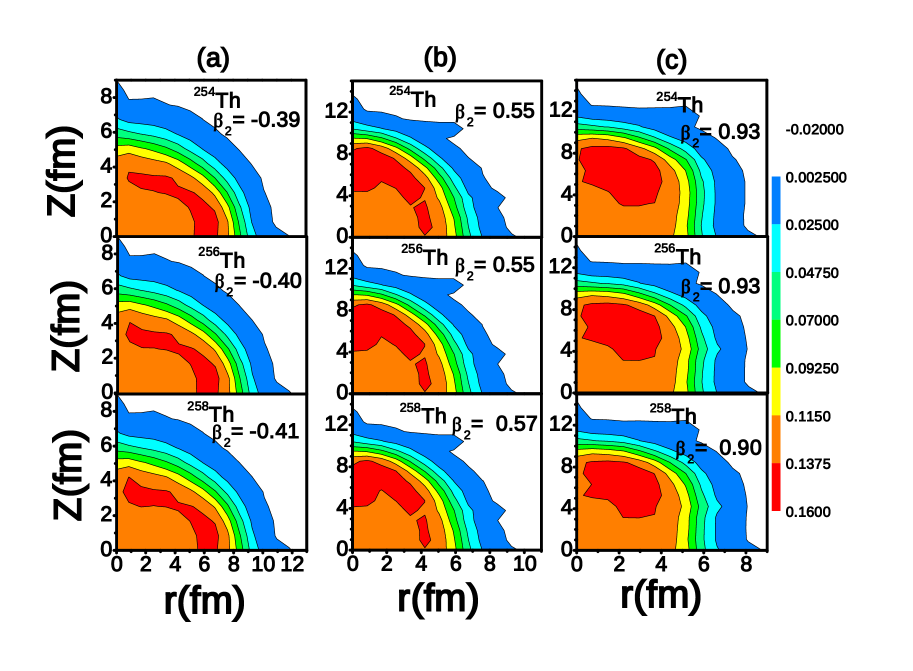
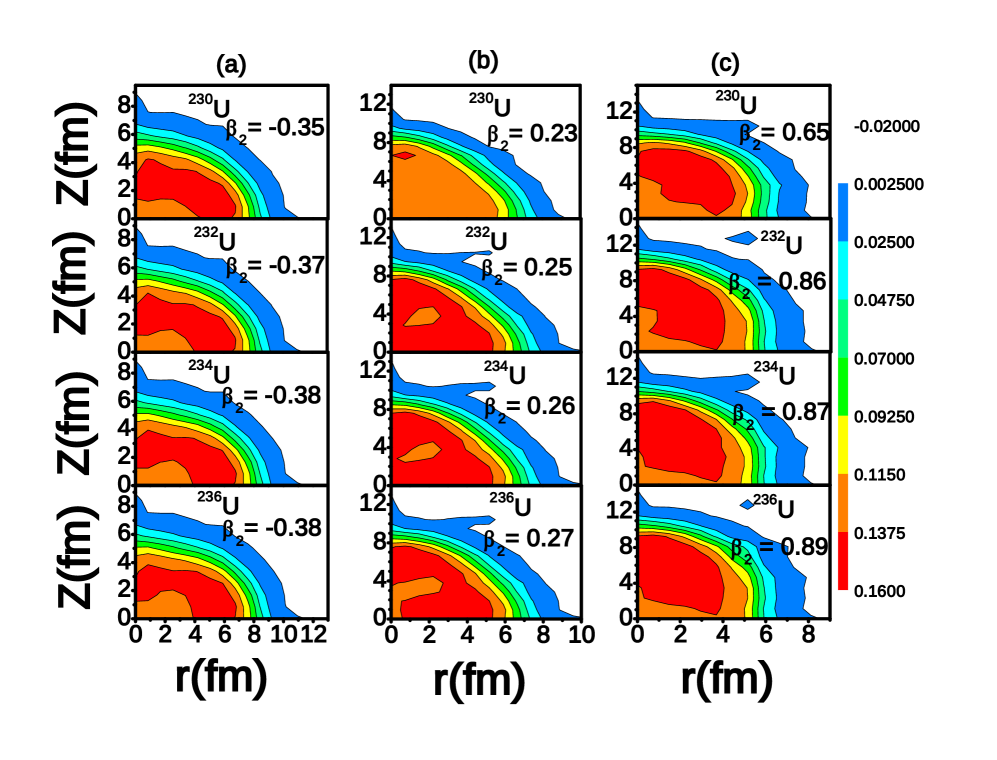
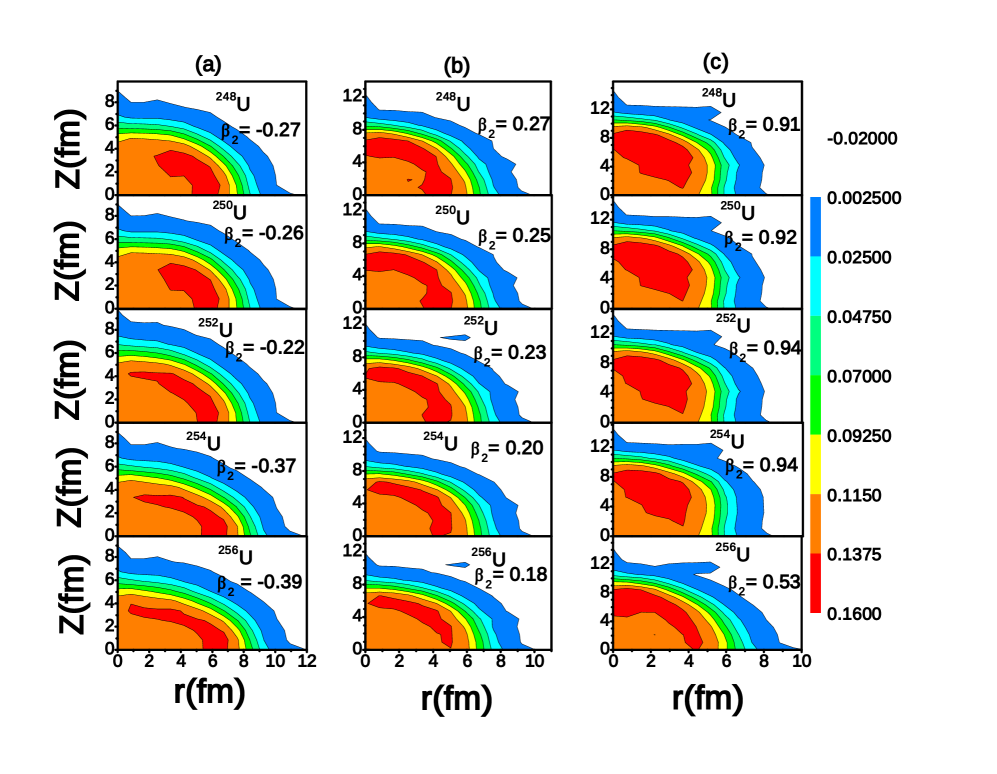
From the colour code it is apparent that, a slight depression occurs in the central region of the considered nuclei associated with the maximum density distribution, resemble the shell structure. This structure exhibits the states, i.e., oblate, prolate and super-deformed configuration. For light isotopes of both Th and U nuclei, the spreading area of the depression is minimum, but this spreading goes on increasing with mass number. On the peripheral region of the nuclei, we observe few thin layers and finally a very diffuse layer of nucleons distribution is observed. In general, we did not see any uneven distribution of matter in some certain area of the nucleus. We only observe uniform distribution of nucleons in an area ruling out the possibility of formation of cluster inside the heavy nucleus, unlike to the situation of light nuclei [30]. The only possibility is the existence of -like matter inside the nucleus. This can be illustrated by plotting the neutron-proton asymmetric parameter defined as:
| (12) |
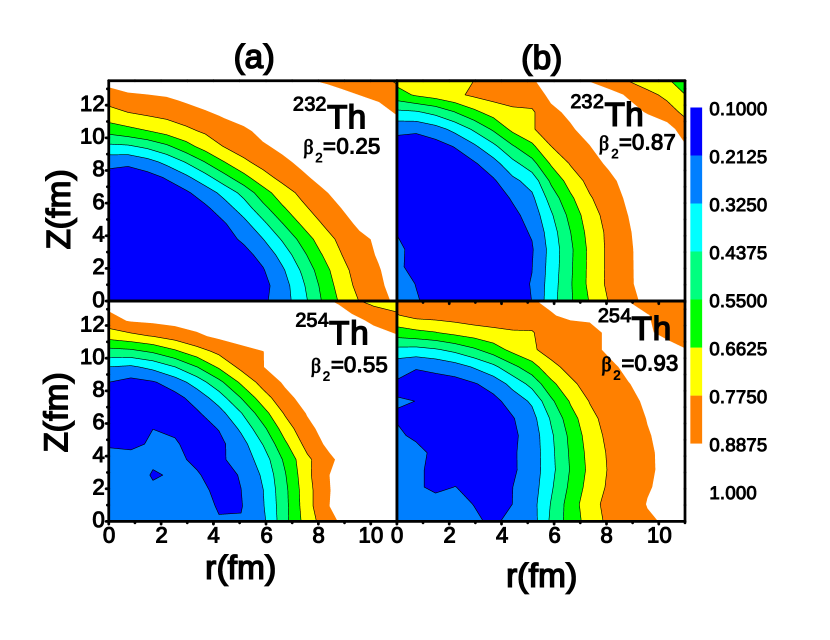
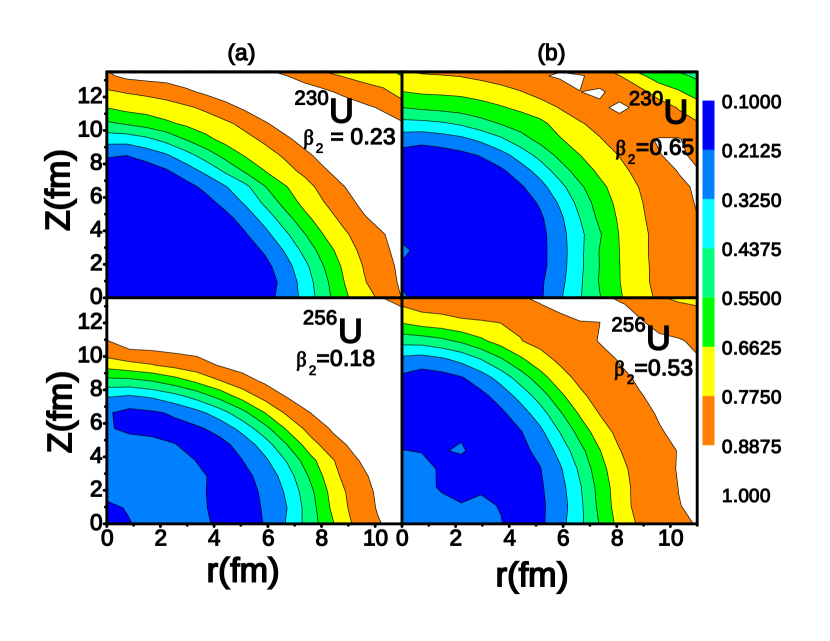
The asymmetric parameter is plotted in Fig. 6, 7 as representative case of normal and neutron-rich nuclei for 232,254Th and 230,256U both in ground and superdeformed states. In normal nuclei like 232Th and 230U, which are on the valley of stability have a deep blue region at the central region of the nuclei. This indicate the approximate symmetric distribution of proton and neutron in the middle of the nucleus. If we refer the colour code and the value of in this region, then . This condition is possible, only when , confirming the presence of -like matter at the center. On the other hand near the surface region of the nucleus, the condition is . This condition is possible, if both proton and neutron densities at the surface are zero or there is no proton available or very rarely populated.
| 208Pb | |||||
| Z | N | N/Z | Z | N | N/Z |
| 51 | 70 | 1.37 | 5 | 7 | 1.4 |
| 10 | 17 | 1.70 | 8 | 14 | 1.75 |
| 6 | 12 | 2.0 | 2 | 6 | 3.0 |
| 232Th | 254Th | ||||
| 58 | 76 | 1.31 | 60 | 83 | 1.38 |
| 14 | 20 | 1.42 | 10 | 22 | 2.20 |
| 8 | 18 | 2.25 | 8 | 20 | 2.50 |
| 5 | 12 | 2.40 | 6 | 18 | 3.00 |
| 3 | 9 | 3.00 | 5 | 16 | 3.20 |
| 2 | 7 | 3.50 | 1 | 5 | 5.00 |
| 230U | 256U | ||||
| 66 | 80 | 1.21 | 62 | 84 | 1.35 |
| 3 | 4 | 1.33 | 10 | 18 | 2.00 |
| 10 | 17 | 1.70 | 6 | 16 | 2.60 |
| 6 | 15 | 2.50 | 9 | 26 | 2.80 |
| 5 | 15 | 3.00 | 4 | 15 | 3.75 |
| 2 | 7 | 3.50 | 1 | 5 | 5.00 |
To count the number of neutrons and protons in a particular colour strip, we take the help of colour code (the density of the region), the plot and the ellipsoid shape of the density distribution. The ellipsoid is considered to have a number of layers bearing each colour, which is prominent from an expanded density plot. The ellipsoid gives the volume , where and are the semi-major and semi-minor axes, respectively. Knowing the volume and density, one can approximately evaluate the number of proton Z and neutron N in a particular colour strip. For example, from the colour code, one can find that the neutron to proton ratios are and 1.35 for 230U and 256U, respectively. Thus, both the neutrons and protons are equally distributed with an additional presence of neutrons at the central region and few more neutrons are in the interior of the nucleus. The number of proton Z and neutron N and their ratio N/Z for various layer of the nuclei are listed in Table 1. For 230U, there are 66 protons and 80 neutrons at the central part and Z=2, N=7 at the farthest region of the nucleus. On the other hand, Z=62, N=84 at the central region and Z=1, N=5 at the surface layer of 256U. Consequently, the existence of nucleons at the far region of the nucleus is rare and we get a light green patch with N/Z=5 covering a larger area in the graph. Although, the density of nucleon is very low on the surface, the number of neutrons are about 5-7 and the number of protons are about 1-2 on it. Thus, the combination of neutron and proton on the surface is very unlikely, as they spread over a large area of space. In cases like 230U, there is some possibility of the formation of like particle, as there are 2 protons available. In such case, there is possibility of decay phenomena. However, in cases like 256U, there is only one proton available and ruled out the formation of like structure, giving rise to the decay. Similar observation is also noticed for Th isotopes.
3.3 Quantum mechanical calculation of -decay half-life
Many theortical studies have been done related to -decay using various empirical formulas [31, 32, 33]. In this subsection, we do an approximate evaluation of the -decay half-life using a quantum mechanical approach. This approach is used recently by us [34] for the evaluation of proton-emission as well as cluster decay. The obtained results satisfactorily matches with known experimental data. Since these nuclei are prone to -decay or spontaneous fission, we need to calculate these decays to examine the stability. It is shown by Satpathy, Patra and Choudhury [15] that by addition of neutrons to Th and U isotopes, the neutron-rich nuclei become surprisingly stable against spontaneous fission. Thus, the possible modes of decay may be - and -emission. To estimate the -decay one needs the optical potential of the - and daughter nuclei, where a bare nucleon-nucleon potential, such as M3Y [35], LR3Y [36], NLR3Y[37] or DD-M3Y [38] interaction is essential. In our calculation, we have taken the widely used M3Y interaction for this purpose. For simplicity, we use spherical densities of the cluster and daughter. Here is the cluster density of the -particle and the daughter nucleus are obtained from RMF(NL3) formalism [25]. Then, the nucleus-nucleus optical potential is calculated by using the well-known double-folding procedure to the M3Y [35] nucleon-nucleon interaction, supplemented by a zero-range pseudopotential representing the single-nucleon exchange effects (EX). The Coulomb potential is added to obtain the total interaction potential . When the -particle tunnels through the potential barrier between two turning points, the probability of emission of the -particle is obtained by the WKB approximation.
Using this approximation, we have made an attempt to investigate the -decay of the neutron-rich thorium and uranium isotopes.
| Parent | Qα(MeV) | P | T(s.) | T(s.) |
|---|---|---|---|---|
| 216Th | 8.072 [42] | 2.109 x 10⁻²¹ | 0.328 | 0.003 |
| 232Th | 4.081 [42] | 6.17 x 10-37 | 1.12 x 10¹⁷ | 5.07 x 10¹⁷ |
| 254Th | 0.78 [RMF] | 1.90 x 10-55 | 3.6 x 1035 | 1 x 10107 |
| 218U | 8.773 [42] | 1.26 x 10⁻²⁰ | 0.055 | 0.0001 |
| 238U | 4.27 [42] | 1.163 x 10-37 | 5.95 x 10¹⁵ | 2.219 x 10¹⁷ |
| 256U | 1.8 [RMF] | 3.783 x 10-44 | 1.83 x 10²² | 1.218 x 1055 |
The double folded [35, 39] interaction potential Vn(M3Y+EX) between the alpha cluster and daughter nucleus having densities and is
| (13) |
where is the zero-range pseudopotential representing the single-nucleon
exchange effects,
| (14) |
with the exchange term [40]
| (15) |
Here, A is the mass of the cluster, i.e., the -particle mass and E is energy measured in the center of mass of the -particle or the cluster-daughter nucleus system, equal to the released value. The Coulomb potential between the and daughter nucleus is
| (16) |
and total interaction potential is
| (17) |
When the -particle tunnels through a potential barrier of two turning points Ra and Rb, then the probability of the -decay is given by
| (18) |
The decay rate is defined as
| (19) |
with the assault frequency = 1021 s-1. The half-life is calculated as:
| (20) |
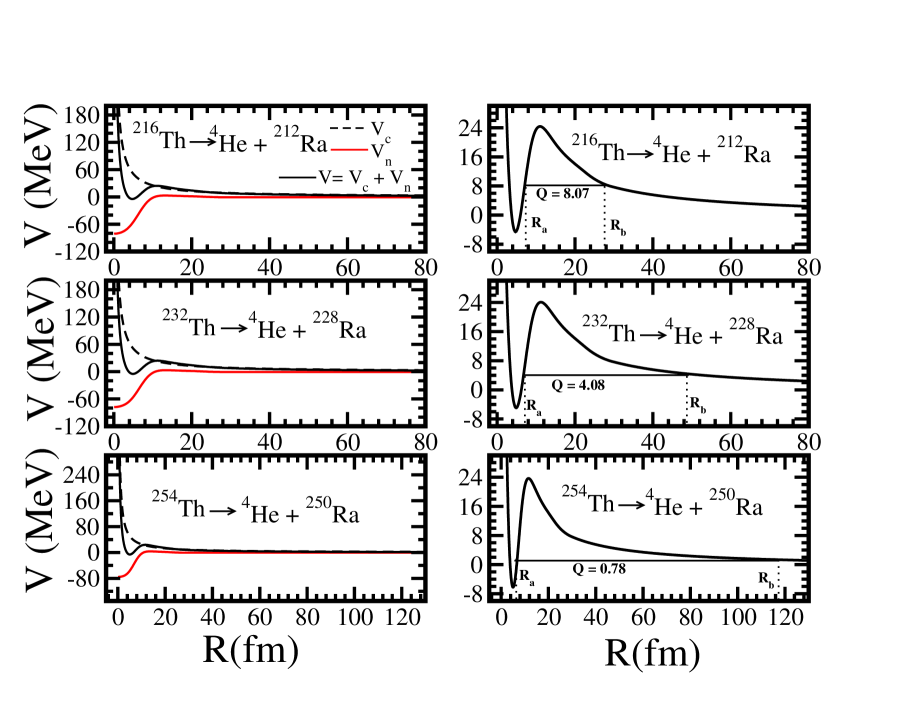
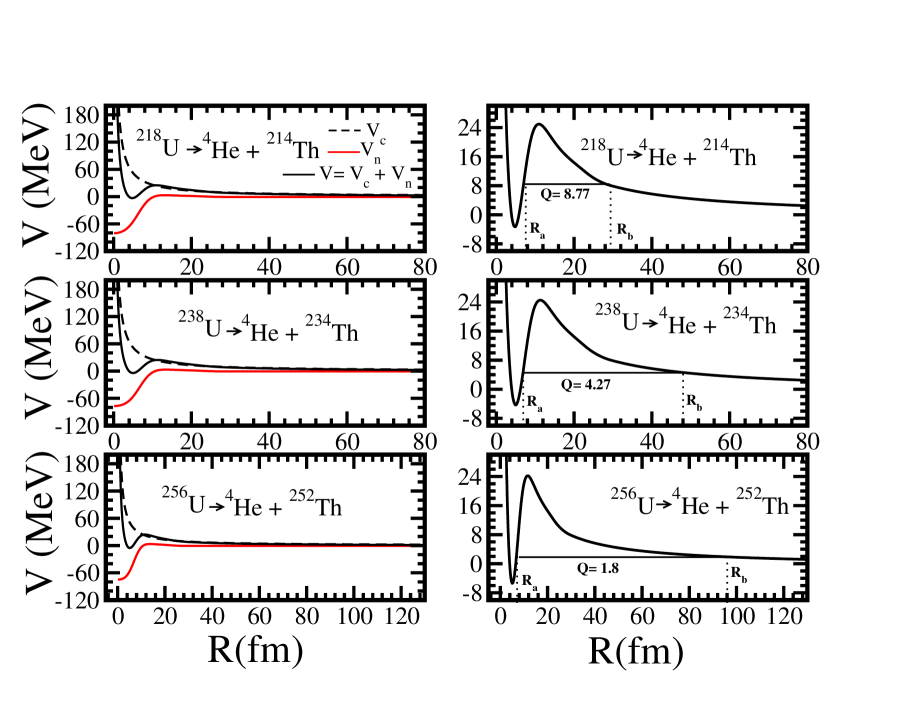
The total interaction potential (black curve) of the daughter and nuclei are shown in Figs. 8 and 9. The central well is due to the average nuclear attraction of all the nucleons and the hill-like structure is due to the electric repulsion of the protons. The -particle with Q-value gets trapped inside the two turning points Ra and Rb of the barrier. The penetration probability P is given in the third column of Table 2 for some selected cases of thorium and uranium isotopes. The probabilities for 216Th and 218U are relatively high, because of the small width as compared to its barrier height. So, it is easier for the -particle to escape from these two turning points.
As we increase the number of neutron in a nucleus, the Coulomb force becomes weak due to the hindrance of repulsion among the protons. In such cases, the width of the two turning points is very large and the barrier height is small. Thus, the probability of -decay for 254Th and 256U is almost infinity and this type of nuclei are stable against - or -decays. These neutron-rich thermally fissile Th and U isotopes are also stable against spontaneous fission. Since, these are thermally fissile nuclei, a feather touch deposition of energy with thermal neutron, it undergoes fission. Thus, half-life of the spontaneous fission is nearly infinity. We have compared our quantum mechanical tunneling results with the empirical formula of Viola and Seaborg [31] in Table 2. For known nuclei, like 232Th and 238U both the results match well, however, it deviates enormously from each other for unknown nuclei both in neutron-rich and neutron-deficient region. In general, independent of the formula or model used, the -decay mode is rare for ultra-asymmetric nuclei. In such isotopes, the possible decay mode is the -decay[41].
3.4 Empirical calculation of decay half-life
Generally, Fermi-theory of -deacy is described by the electron-neutrino interaction, which characterizes beta transition rates according to values [43]. The knowledge of the level structure of the nuclei gives the accurate prediction of -decay half-lives, certainly beyond the scope of this work. As we have discussed, the prominent mode of instability of neutron-rich Th and U nuclei is the -decay. We have used the empirical formula of Fiset and Nix [44], which is defined as:
| (21) |
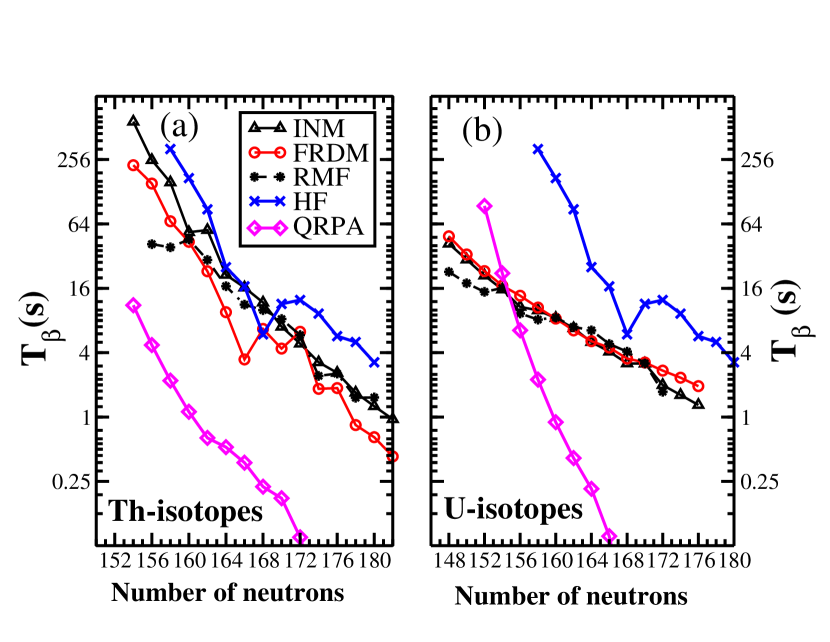
Similar to the -decay, we evaluate the -value for Th and U series using the relation and . Here, is the average density of states in the daughter nucleus (e-A/290 number of states within 1 MeV of ground state). To evaluate the bulk properties, such as binding energy of odd-Z nuclei, we used the Pauli blocking prescription [45, 46]. The obtained results are displayed in Fig. 10 for both Th and U isotopes. For comparison, we have also given the values of obtained from various mass formulae [47, 48] and other approaches including the microscopic estimation from Hartree-Fock(HF) and QRPA [49, 50] results. The decay half-life obtained from QRPA [50] calculations is quite different from rest of the values evaluated from the empirical formula using the binding energies of INM, FRDM, RMF and HF formalisms.
From the figure, it is clear that for neutron-rich Th and U nuclei, the prominent mode of decay is -decay. This means, once the neutron-rich thermally fissile isotope is formed by some artificial mean in laboratory or naturally in supernovae explosion, immediately it undergoes -decay. In our rough estimation, the life time of 254Th and 256U, which are the nuclei of interest has tens of seconds. If this prediction of time period is acceptable, then in nuclear physics scale, is reasonably a good time for further use of the nuclei. It is worthy to mention here that thermally fissile isotopes of Th and U series are with neutron number N=154-172 keeping N=164 in the middle of the island. So, in case of the short life time of 254Th and 256U, one can choose a lighter isotope of the series for practical utility.
4 Conclusions
In summary, we did a thorough structural study of the recently predicted thermally fissile isotopes of Th and U series in the framework of relativistic mean field theory. Although there are certain limitations of the present approach, the qualitative results will remain unchanged even if the draw-back of the model taken into account. The heavier isotopes of these two nuclei bear various shapes including very large prolate deformation at high excited configurations. Using quantum mechanical tunneling approach, we find that the neutron-rich isotopes of these thermally fissile nuclei are predicted to be stable against - and -decays. The spontaneous fission also does not occur, because the presence of large number of neutrons makes the fission barrier broader. However, these nuclei are highly -unstable. Our calculation predicts that the -life time is about tens of seconds for 254Th and 256U and this time increases for nuclei with less neutron number, but thermally fissile. This finite life time of these thermally fissile isotopes could be very useful for energy production in nuclear reactor technology. If these neutron-rich nuclei use as nuclear fuel, the reactor will achieve critical condition much faster than the normal nuclear fuel, because of the release of large number of neutrons during the fission process [15].
References
- [1] A. Sandulescu, D. N. Poenaru and W. Greiner, Sovt. Jour. Nucl. Phys. 11, (1980) 528.
- [2] H. J. Rose and G. A. Jones, Nature 307, (1984) 245.
- [3] E. Hourani, M. Hussonnois and D. N. Poenaru, Annales de Physique 14,(1989) 311.
- [4] B. K. Sharma, P. Arumugam, S. K. Patra, P. D. Stevenson, R. K. Gupta and W. Greiner, J. Phys. G. 32, (2006) L1.
- [5] C. Qi, F. R. Xu, R. J. Liotta and R. Wyss, Phys. Rev. Lett. 103, (2009) 072501.
- [6] D. N. Poenaru, R. A. Gherghescu and W. Greiner, Phys. Rev. C 83, (2011) 014601.
- [7] D. N. Poenaru, R. A. Gherghescu and W. Greiner, Phys. Rev. Lett. 107, (2011) 062503.
- [8] D. N. Poenaru, R. A. Gherghescu and W. Greiner, J. Phys. G 39, (2012) 015105.
- [9] D. N. Poenaru, R. A. Gherghescu and W. Greiner, Phys. Rev. C 85, (2012) 034615.
- [10] E. Fermi, E. Amaldi, O. D’Agostino, F. Rasetti and E. Segré, Proc. Roy. Soc. 146, (1934) 483.
- [11] L. Meitner and O. R. Frisch, Nature 143, (1939) 239.
- [12] N. Bohr and J. A. Wheeler, Phys. Rev. 56, (1939) 426.
- [13] J. Frenkel, Phys. Rev. 55, (1939) 987 and J. Phys. U.S.S.R. 1, (1939) 125.
- [14] D. N. Poenaru, I. H. Plonski, R. A. Gherghescu and W. Greiner, J. Phys. G 32, (2006) 1223.
- [15] L. Satpathy, S. K. Patra and R. K. Choudhury, Pramana J. Phys. 70, (2008) 87.
- [16] J. D. Walecka, Ann. Phys. 83, (1974) 491.
- [17] B. D. Serot and J. D. Walecka, Adv. Nucl. Phys. 16, (1986) 1.
- [18] C. J. Horowitz and B. D. Serot, Nucl. Phys. A 368, (1981) 503.
- [19] J. Boguta and A. R. Bodmer, Nucl. Phys. A 292, (1977) 413.
- [20] C. E. Price and G. E. Walker, Phys. Rev. C 36, (1987) 354.
- [21] P. G. Blunden and M. J. Iqbal, Phys. Lett. B 196, 295 (1987).
- [22] P. G. Reinhard, Rep. Prog. Phys. 52, 439 (1989).
- [23] Y. K. Gambhir, P. Ring and A. Thimet, Ann. Phys. 198, (1990) 132.
- [24] S. K. Patra and C. R. Praharaj, Phys. Rev. C 44, (1991) 2552.
- [25] G. A. Lalazissis , J. König and P. Ring, Phys. Rev. C 55, (1997) 540.
- [26] S. K. Patra, Phys. Rev. C 48, (1993) 1449.
- [27] M. A. Preston and R. K. Bhaduri, Structure of Nucleus, Addison-Wesley Publishing Company, Ch. 8, page 309 (1982).
- [28] D. G. Madland and J. R. Nix, Nucl. Phys. A 476, (1981) 1.
- [29] J. Dechargé and D. Gogny, Phys. Rev. C 21, (1980) 1568.
- [30] P. Arumugam, B. K. Sharma, S. K. Patra and R. K. Gupta, Phys. Rev. C 71, (2005) 064308.
- [31] V. E. Viola Jr. and G. T. Seaborg, J. Inorg. Nucl. Chem. 28, (1966) 741
- [32] Y. Z. Wang, S. J. Wang, Z. Y. Hou and J. Z. Gu, Phys. Rev. C 92, (2015) 064301.
- [33] M. S. Mehta, H. Kaur, Bharat Kumar and S. K. Patra, Phys. Rev. C 92, (2015) 054305.
- [34] Bidhubhusan Sahu, S. K. Agarwalla and S. K. Patra, Phys. Rev. C 84, (2011) 054604.
- [35] G. R. Satchler and W. G. Love, Phys. Rep. 55, (1979) 183.
- [36] BirBikram Singh, M. Bhuyan, S. K. Patra and Raj. K. Gupta, J. Phys. G. 39, (2012) 025101.
- [37] B. B. Sahu, S. K. Singh, M. Bhuyan, S. K. Biswal and S. K. Patra, Phys. Rev. C 89, (2014) 034614.
- [38] A. M. Kobos, B. A. Brown, R. Lindsay and G. R. Satchler, Nucl. Phys. A 425, (1984) 205.
- [39] Dao T. Khoa, W. von Oertzen and H. G. Bohlen, Phys. Rev. C 49, (1994) 1652.
- [40] D. N. Basu, J. Phys. G. 29, (2003) 2079.
- [41] Bharat Kumar, S. K. Biswal, S. K. Singh and S. K. Patra, Phys. Rev. C 92, (2015) 054314.
- [42] http://www.nndc.bnl.gov/nudat2/
- [43] See, for example, J. M. Blatt and V. F. Wmskoi’f, Theoretical Nuclear Physics, p. 673ff. Wiley, New York (1952).
- [44] E. O. Fiset and J. R. Nix, Nucl. Phys. A 193, (1972) 647.
- [45] P. Ring and P. Schuck, The Nuclear Many-Body Problem (Springer-Verlag, Berlin, 1980).
- [46] S. K. Patra, M. Del Estal, M. Centelles and X. Viñas, Phys. Rev. C 63, (2001) 024311.
- [47] P. Möller, J. R. Nix, W. D. Myers and W. J. Swiatecki, At. Data and Nucl. Data Tables 66, (1997) 131.
- [48] R. C. Nayak and L. Satpathy, At. Data and Nucl. Data Tables 73, (1999) 213.
- [49] S. Goriely, F. Tondeur and J. M. Pearson, At. Data and Nucl. Data Tables 77, (2001) 311.
- [50] A. Staudt, E. Bender, K. Muto and H. V. Klapdor-kleingrothaus, At. Data and Nucl. Data Tables 44, (1990) 79.