Photometric brown-dwarf classification
We present a homogeneous sample of 1361 L and T dwarfs brighter than (of which 998 are new), from an effective area of 3070 deg2, classified by the photo-type method to an accuracy of one spectral sub-type using photometry from SDSS+UKIDSS+WISE. Other than a small bias in the early L types, the sample is shown to be effectively complete to the magnitude limit, for all spectral types L0 to T8. The nature of the bias is an incompleteness estimated at because peculiar blue L dwarfs of type L4 and earlier are classified late M. There is a corresponding overcompleteness because peculiar red (likely young) late M dwarfs are classified early L. Contamination of the sample is confirmed to be small: so far spectroscopy has been obtained for 19 sources in the catalogue and all are confirmed to be ultracool dwarfs. We provide coordinates and photometry of all sources. We identify an apparent discontinuity, mag., in the colour between spectral types L7 and L8. We present near-infrared spectra of nine sources identified by photo-type as peculiar, including a new low-gravity source ULAS J005505.68+013436.0, with spectroscopic classification L2. We provide revised template colours for late M dwarfs, types M7 to M9.
Key Words.:
Catalogs - Surveys - Stars: low-mass - brown dwarfs1 Introduction
The discovery of ultracool dwarfs later than spectral type M9 has proceeded rapidly over the past two decades, resulting in the definiton of three new spectral classes; successively cooler, the L (Kirkpatrick et al. 1999; Martín et al. 1999); T (Geballe et al. 2002; Burgasser et al. 2002, 2006a); and Y dwarfs (Cushing et al. 2011). The current paper focuses on L and T dwarfs. Brown dwarfs are defined as objects too low in mass to sustain hydrogen burning in their cores. They cool with age at a rate dependent on mass (Burrows et al. 1997), so for a given spectral type there is an age-mass degeneracy. Objects with spectral types beyond the end of the stellar main sequence, i.e. L3, are unambiguously brown dwarfs. Early-type L dwarfs, L3, are a mix of young brown dwarfs and low-mass main sequence stars.
The study of L and T dwarfs has moved beyond the exploratory stage to the detailed characterisation of the population by e.g. the measurement of the luminosity and mass functions (Cruz et al. 2007; Pinfield et al. 2008; Reylé et al. 2010; Burningham et al. 2010b; Kirkpatrick et al. 2012), kinematics (Faherty et al. 2009, 2012; Reiners & Basri 2009; Schmidt et al. 2010; Seifahrt et al. 2010), the frequency of close binaries and wide companions (Burgasser et al. 2006b; Burgasser 2007; Faherty et al. 2010, 2011; Luhman 2012; Deacon et al. 2014), and the study of rare types (Burgasser et al. 2003; Folkes et al. 2007; Looper et al. 2008; Gizis et al. 2012; Faherty et al. 2013; Liu et al. 2013).
The coverage of the LT sequence of large homogeneous samples111by which we mean samples with high completeness and for which the incompleteness is accurately quantified suitable for statistical analysis is patchy. This is mostly because of the time required for spectroscopy, but also because the selection methods, using colour cuts, pick out only a limited range of spectral types. The largest existing sample of dwarfs in the LT range is the catalogue of 484 L dwarfs of Schmidt et al. (2010), from the Sloan Digital Sky Survey (SDSS; York et al. 2000), selected by colour, and observed within the SDSS spectroscopic campaign. Of these, 460, i.e. , are classified L3 or earlier. The largest existing sample of T dwarfs, totaling 176 sources, comes from the WISE team, and is catalogued in the papers of Kirkpatrick et al. (2011) and Mace et al. (2013). This sample again represents only a narrow range of spectral types, with 153 classified T5 or later. Furthermore spectroscopy is incomplete, so the sample only provides a lower limit to the space density of late-type T dwarfs.
In a previous paper, Skrzypek et al. (2015), hereafter Paper I, we presented a method, named photo-type, to identify and accurately classify samples of L and T dwarfs from multi-band photometry alone, without the need for spectroscopy. The motivation for developing the method was the need for a much larger homogeneous sample of L and T dwarfs, spanning the full range of spectral types, from L0 to T8, in order to characterise the LT population more precisely, by reducing the statistical errors on the measurements of properties of interest. As listed in Paper I, such properties include the luminosity function, the disk scale height, the frequency of binarity, and the population kinematics. A large sample will also allow a search for rare types, and the discovery of more benchmark systems i.e. ultracool dwarf companions to stars with measureable distance and metallicity e.g. Smith et al. (2014a, b). The method might also be useful in identifying distant L and T dwarfs in deep photometric catalogues, which are so faint that spectroscopy would be difficult.
The photo-type method works by comparing the multiwavelength spectral energy distributions (SEDs) of candidates from broadband photometry, against a set of template SEDs derived by fitting polynomials to plots of colour against spectral type, using a set of spectroscopically classified L and T dwarfs. In Paper I we showed that the method classifies normal sources to an accuracy of one spectral sub-type r.m.s., and so is competitive with spectroscopy. Contamination should be very low because the most likely contaminants, M dwarfs and reddened quasars, are easily discriminated against.
We have applied photo-type to an 8-band photometric catalogue, combining data from SDSS, the UKIRT Infrared Deep Sky Survey (UKIDSS; Lawrence et al. 2007), and the Wide-field Infrared Survey Explorer (WISE; Wright et al. 2010), over 3344 deg2. The current paper presents the resulting sample of 1361 sources, brighter than , comprising 1281 L dwarfs and 80 T dwarfs. This is the largest existing homogeneous sample of L and T dwarfs. The sample appears to be highly complete across the full spectral range L0-T8, judged by the success in rediscovering virtually all known L and T dwarfs in the area surveyed. We quantify the completeness in this paper. As expected, contamination is found to be low: so far spectroscopy has been obtained for 19 sources in the catalogue and all are confirmed to be ultracool dwarfs.
The current paper is the companion to Paper I, and follows directly from it. Paper I described the motivation for the photo-type method, and the method itself, and quantified the accuracy of the photo-type classifications. The current paper presents the sample of L and T dwarfs derived using the photo-type method, and quantifies the completeness of the sample. The layout of the remainder of the paper is as follows. In §2 we provide a brief summary of Paper I, describing the photo-type method, and its application to the SDSS+UKIDSS+WISE catalogue. We also describe two minor updates to the method there. §3 presents the new sample of 1361 sources, and summarises the main characteristics of the sample. In §4 we establish the completeness of the sample, considering several possible sources of incompleteness. §5 presents confirmation spectra of 11 objects from the sample, mostly selected by large . §6 provides a summary of the paper.
2 Sample selection by photo-type
The photometric bands used in this study are the and bands in SDSS, the , , , bands in UKIDSS, and the , bands in WISE. All the magnitudes and colours quoted in this paper are Vega based. The survey data are calibrated to Vega, while SDSS is calibrated on the AB system; We have applied the offsets tabulated in Hewett et al. (2006) to convert the SDSS AB magnitudes to Vega.
Paper I describes the photo-type method, and the creation of a multi-band catalogue of point sources combining SDSS, UKIDSS, and WISE data over 3344 deg2, used for the search for L and T dwarfs. Here we summarise details from Paper I relevant to understanding the contents of the new sample of L and T dwarfs.
The method photo-type works by comparing the SED of a source, from multiband photometry, against a library of template SEDs. These include L and T dwarfs, of all spectral types, as well as quasars, white dwarfs, and main sequence dwarfs O-M. Attention is restricted to the colour range , so that in practice the only contaminants of the sample of L and T dwarfs are M dwarfs and reddened quasars.
The template SEDs are defined by fitting polynomials to plots of colour against spectral type, for the 7 colours , , , , , , , using the measured colours of 190 L and T dwarfs with spectroscopic classifications. By anchoring to the colours define the template SED for each spectral type, L0 to T8. The best fit template to the SED (i.e. the multiband photometry) of any target is found by calculating, for each template, the magnitude offset that minimises the of the fit to the SED, and selecting the template with the minimum value of minimum . In making the fit to any SED, the error on each point includes two contributions: the random photometric error, and an additional error of 0.05 mag. per band that accounts for the intrinsic spread in colours of the population. The errors on the polynomial fits themselves are also relevant, but were found not to contribute significantly to the uncertainty in the classification.
The classification of L dwarfs is tied to the optical system of Kirkpatrick et al. (1999) and the classification of T dwarfs is tied to the near-infrared system of Burgasser et al. (2006a). It is important to be clear what this means. The photo-type method is not designed to get as close as possible to the standard (optical for L, near-infrared for T) spectroscopic classification. Rather, it matches the multiwavelength SED (m) against template SEDs that are averages for normal L and T dwarfs that have been classified spectroscopically. For normal objects we can expect the photo-type classification to match the standard spectral classification closely. For peculiar objects this will not be the case. For example, L dwarfs that are peculiarly blue for their spectral type (e.g. subdwarfs) will have an earlier photo-type classification than the spectroscopic classification (and vice versa for red objects). This is because photo-type uses colours, whereas the spectroscopic classification uses absorption features, independent of colour. We quantify this bias in §4.3.
While photo-type yields biased spectral types for peculiar blue and red sources, in recompense it has the advantage over spectral classification of the broad wavelength coverage. Many peculiar sources, classified as normal with spectroscopy covering a limited wavelength range, can be recognised as peculiar by the high of the photo-type fit. For example an unresolved LT binary might be classified differently from an optical or a near-infrared spectrum, but as normal in both cases. It would therefore require both spectra to recognise the source as peculiar. The photo-type classification would likely be somewhere in between the two spectral classifications, but the source would be recognised as peculiar by the high of the fit. The distribution of the sample is discussed in §3. In summary photo-type provides accurate classifications for normal sources. For peculiar sources, including subdwarfs, very red sources, and binaries, the photo-type and standard spectral classifications may not agree, but photo-type identifies peculiar sources by their high . Overall, recognising that multiwavelength photometry is a measurement of the spectrum at very low resolution, we can see that spectroscopic classification has the advantage of much higher resolution, while photo-type has the advantage of much broader wavelength coverage.
In deriving the templates the assumption was made that the sample of known sources is representative of the distribution of colours of the L and T population, so that the average colours are not biased. Because the SEDs of the contaminating population, reddened quasars, are so different from the SEDs of L and T dwarfs, photo-type can detect unusual L and T dwarfs that may have been missed in previous searches. Therefore we can check for any bias in the template colours by looking at the distribution of colours of the new photo-type sample. This analysis is presented in §3.1.
We created a multiband photometric catalogue by combining SDSS, UKIDSS, and ALLWISE data over 3344 deg2. The starting point was the region of the UKIDSS Large Area Survey Data Release 10 (DR10) covered by all four bands, . Point sources, in the magnitude range , detected in all four bands were matched to SDSS DR9 and (Ahn et al. 2012), and ALLWISE and . One source was undetected in WISE and a handful of sources were undetected in the SDSS bands. These undetected sources were retained in the catalogue, but the bands in which the source was absent were ignored in the fitting. Similarly, sources blended with a neighbour in the WISE images were retained, and these bands were ignored in the fitting. Since we insist all sources are detected in all four bands we then checked (Paper I, §3.1) whether this meant that sources with extreme colours would be missed (because undetected in , , or ). We undertook a full simulation of the colours of each spectral type, using the templates, adding appropriate random photometric errors, and measured the proportion of sources that fell below the detection limit in any band, over the volume of the survey, defined by the sample limit . The result was that total incompleteness of the L and T samples due to this effect is substantially less than i.e. brighter than essentially all L and T dwarfs will be detected in all four bands, so the base sample for the search for L and T dwarfs is effectively complete.
Taking a cut at left 9487 sources, and classification produced a sample of 1281 L dwarfs and 80 T dwarfs, which are catalogued in §3. Of the 190 known L and T dwarfs contained in the parent catalogue of 9487 stellar sources, all 190 (previously 189, see §2.1) are correctly classified as ultracool dwarfs.
| Mean | 0.12 | 0.07 | 0.03 | 0.02 | 0.02 | 0.02 | 0.04 | 0.08 | 0.05 |
|---|---|---|---|---|---|---|---|---|---|
| Median | 0.09 | 0.06 | 0.03 | 0.02 | 0.02 | 0.02 | 0.04 | 0.07 | 0.03 |
The accuracy of photo-type classifications for this sample was assessed in three ways: i) by comparing the photo-type classifications against published spectroscopic classifications, ii) from our own spectroscopy of sources in the catalogue, and iii) by creating realistic synthetic catalogues from the template colours and classifying. We found that photo-type classifications using all 8 bands are accurate to one subclass r.m.s., or better, at all magnitudes brighter than .
The S/N is high for most sources in most bands, which explains the accurate classifications. The median photometric error, over all bands, for the 1361 L and T dwarfs catalogued, is 0.03 mag., and the photometric error is mag. for of the photometric measurements. In Table 1 we list the mean and median photometric error for each band, for the LT sample.
As explained in Paper I (§4), the uncertainty of sub-types results in a bias (Eddington 1913) in the number counts as a function of spectral type.222The bias is, of course, not unique to photo-type. A spectroscopic sample classified with an uncertainty of sub-type would have the same bias. For example, because the counts rise steeply towards earlier types, more M9 dwarfs will be scattered into the L0 bin than L0 dwarfs will be scattered into the M9 bin. We will correct for this bias in computing the luminosity function.
We now describe one minor change made since the completion of Paper I, and one correction.
2.1 Extension to include WISE colours for quasars
In Paper I quasar template colours were only available for the bands. We have since added the bands to the quasar templates, improving the discrimination between peculiar red L and T dwarfs and reddened quasars. We have reclassified the whole catalogue using the improved templates, which resulted in only a very small number of changes in classification. The total sample size increased by just five. Significantly, the only previously-known source that was misclassified, as a reddened quasar, the unusual red L dwarf 2MASS J01262109+1428057 discovered by Metchev et al. (2008) (see Paper I, §3.1), is now correctly classified as an ultracool dwarf. This source is a very low-gravity young brown dwarf, with spectroscopic classification L2. So at present there is no evidence that our sample is incomplete for peculiar red L and T dwarfs. But without a set of templates for peculiar red L and T dwarfs, which will only become available once larger samples have been obtained, it is difficult to quantify accurately the completeness for such sources.
2.2 Correction: Inaccurate M star templates
Table 1 in Paper 1 provides our template colours over the spectral range L0 to T8, as well as an extension to cover the spectral range M5 to M9. Schmidt et al. (2015) have pointed out that our template colours for M dwarfs disagree with their colours. We believe the Schmidt et al. (2015) colours are correct, and that the M5 to M9 template colours in Paper I should not be used. While differences in the samples used contribute to the discrepancies, the most significant factor is that we used the Hammer (Covey et al. 2007) spectral classifications for M stars, straight from the SDSS database. West et al. (2011) showed that for spectral types M5 the Hammer classifications become systematically offset relative to visual classifications, in the sense that the visual classifications provide later spectral types. Starting with M dwarfs visually classified M5, they found that had Hammer classifications one spectral sub-type earlier.
In Table 3 we provide revised template colours for M7, M8, and M9 dwarfs. We started with the Schmidt et al. (2015) sample of 11820 M7-M9 dwarfs. From this we produced a matched sample of 3622 dwarfs (1930 M7, 1060 M8, 425 M9) with photometry. The tabulated colours are the median colours for each spectral type.
We have reclassified all sources using the revised M star template colours. Our LT sample is classified to the nearest 0.5 spectral sub-type. Changing the late M template colours only affects the L0 bin, as it changes the colour boundary between M9.5 and L0. The colour difference between M9.5 and L0 is now larger in all colours, meaning that the L0 bin is wider in colour space, so that a significant fraction of sources previously classified M9.5 should have been classified L0. Using the revised templates we find that an additional 199 sources are classified L0, significantly increasing the total sample size to 1361.
| SpT | |||||||
|---|---|---|---|---|---|---|---|
| M7 | 1.36 | 0.55 | 0.68 | 0.54 | 0.38 | 0.17 | 0.20 |
| M8 | 1.68 | 0.69 | 0.79 | 0.56 | 0.44 | 0.19 | 0.22 |
| M9 | 1.86 | 0.79 | 0.87 | 0.59 | 0.49 | 0.22 | 0.23 |
3 Sample of 1361 L and T dwarfs
The new sample is presented in Tables 4 and 5, listing the coordinates, the 8-band photometry, the photo-type classification, and the of the fit, for the 1281 sources classified as L dwarfs and the 80 sources classified as T dwarfs, respectively. Sources have been classified to the nearest half sub-type, by interpolating the template colours (Table 3 in this paper, and Table 1 of Paper I). Also listed are any existing spectroscopic classifications, and the relevant reference. The large majority of the photo-type classifications are based on photometry in all 8 bands. Sources without and photometry, primarily due to blending, are marked e.g. L2:, indicating that the classification is less certain. The same is the case for sources undetected in both and . The classifications for the handful of sources with only photometry are marked e.g. T4::. All sources have been inspected in the images in all bands. Nevertheless we recommend scrutiny of the images prior to any spectroscopic observations, particularly for peculiar sources.
| Name | i | ierr | z | zerr | Y | Yerr | J | Jerr | H | Herr | K | Kerr | W1 | W1err | W2 | W2err | PhT | SpT | Ref | |
|---|---|---|---|---|---|---|---|---|---|---|---|---|---|---|---|---|---|---|---|---|
| ULAS J000005.87+152354.4 | 21.30 | 0.13 | 19.50 | 0.12 | 18.47 | 0.04 | 17.27 | 0.03 | 16.51 | 0.03 | 15.92 | 0.03 | 99.00 | 99.00 | 99.00 | 99.00 | L2: | 2.22 | 99 | 99 |
| ULAS J000100.45+065259.6 | 18.62 | 0.02 | 16.56 | 0.02 | 15.70 | 0.01 | 14.76 | 0.01 | 14.08 | 0.01 | 13.54 | 0.01 | 13.33 | 0.02 | 13.02 | 0.03 | L0 | 5.62 | 99 | 99 |
| ULAS J000112.24+153534.3 | 19.92 | 0.04 | 17.99 | 0.03 | 16.88 | 0.01 | 15.46 | 0.01 | 14.48 | 0.01 | 13.62 | 0.01 | 12.97 | 0.02 | 12.54 | 0.02 | L5.5p | 55.82 | L4 | 11 |
| Name | i | ierr | z | zerr | Y | Yerr | J | Jerr | H | Herr | K | Kerr | W1 | W1err | W2 | W2err | PhT | SpT | Ref | |
|---|---|---|---|---|---|---|---|---|---|---|---|---|---|---|---|---|---|---|---|---|
| ULAS J000844.34+012729.4 | 99.00 | 99.00 | 99.00 | 99.00 | 18.20 | 0.04 | 16.99 | 0.02 | 17.40 | 0.06 | 17.54 | 0.10 | 17.02 | 0.14 | 14.83 | 0.07 | T6.5: | 1.26 | 99 | 99 |
| ULAS J003451.98+052306.8 | 24.09 | 0.61 | 18.38 | 0.04 | 16.21 | 0.01 | 15.14 | 0.01 | 15.58 | 0.01 | 16.07 | 0.03 | 15.09 | 0.04 | 12.55 | 0.03 | T7p | 45.15 | T6.5 | 1 |
| ULAS J004730.55+113222.5 | 22.99 | 0.42 | 19.92 | 0.17 | 18.37 | 0.04 | 17.17 | 0.03 | 16.77 | 0.04 | 16.90 | 0.06 | 16.30 | 0.07 | 15.11 | 0.09 | T3 | 15.59 | 99 | 99 |
| SpT | Count | SpT | Count |
|---|---|---|---|
| L0 | 596 | T0 | 10 |
| L1 | 279 | T1 | 11 |
| L2 | 163 | T2 | 7 |
| L3 | 92 | T3 | 8 |
| L4 | 75 | T4 | 13 |
| L5 | 32 | T5 | 14 |
| L6 | 10 | T6 | 5 |
| L7 | 18 | T7 | 11 |
| L8 | 8 | T8 | 1 |
| L9 | 8 |
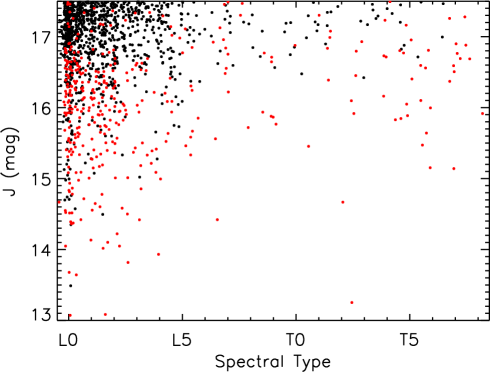
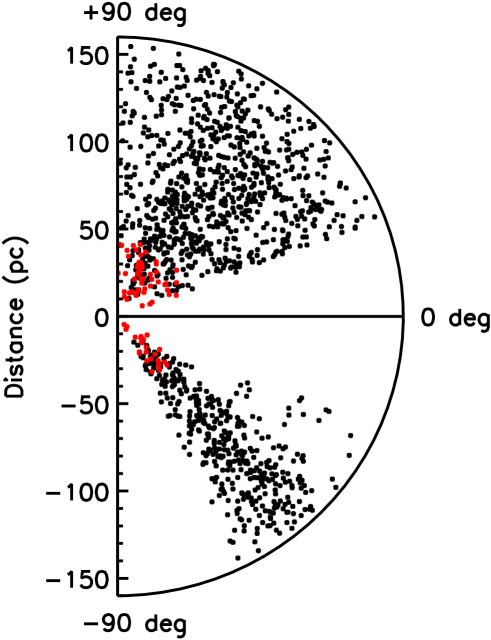
The general properties of the sample are illustrated in a set of plots, Figs 1 to 9. Fig. 1 plots the mag. against photo-type spectral type. It shows that previous samples are fairly complete to , with 154 of the 210 sources previously catalogued, i.e. , with incompleteness increasing progressively towards fainter magnitudes. In total 998 of the 1361 sources are new. Fig. 2 plots the distribution of spectral types as a histogram. The number counts for this plot are provided in Table 5. The steep decline in number counts from L0 to L7 and subsequent flattening across the T types is a reflection of the volume surveyed, as illustrated in Fig. 3, which plots distance against spectral type for the sample. We used the relation between the absolute magnitude in the band, , and spectral type from Dupuy & Liu (2012) to estimate distances. Dwarfs of spectral type L0 are detectable out to 150 pc, but the limiting distance drops rapidly towards later types, and then flattens off near L6. Over most of the T sequence the distance limit is in the range 30-40 pc. It is evident from the plot that the space density as a function of spectral type does not vary strongly over most of the spectral range. In Fig. 4 we plot distance against Galactic latitude , in polar coordinates, with L dwarfs plotted black, and T dwarfs plotted red. This illustrates the fact that the LAS fields lie mostly at high Galactic latitudes. The variation in numbers with reflects the variation in the solid angle surveyed with . Although there is a measureable decline in space density with distance from the Galactic plane, the sample reaches insufficient depth to be useful for constraining the scale height of the L and T populations on its own, but will be very useful when supplemented with a deep sample.
In Fig. 5 we plot the histogram of values for the sample, compared against the theoretical curve for degrees of freedom. For most of the sample we have photometry in 8 bands. The brightness of the source is a free parameter in fitting templates, and the spectral type is treated as a second free parameter. The actual distribution is different to the theoretical curve, and has a pronounced tail. This means that our photometric model, where we added an error mag. in each band to account for the spread in colours, does not fully model the variation in the population, perhaps due to correlations between bands for peculiar sources. There are 97 sources with , i.e. of the sample, and we have used this limiting value to define a sample of peculiar objects. These sources are marked e.g. L3p in the catalogue. The proportion of T dwarfs classed peculiar, 22/80, compared to 75/1281 for L dwarfs, is disproportionately high, implying that the scatter in colours is larger for T dwarfs than for L dwarfs. Using the criterion for T dwarfs reduces the proportion to 7/80. Spectroscopy of 9 objects with is presented in §5.


3.1 Colour relations for the photo-type sample
We now return to the question raised in Paper I of whether the colours of the 190 L and T dwarfs used in deriving the colour polynomials, on which the photo-type method rests, are representative of the full L and T population. As noted in Paper I, because the SEDs of the potential contaminating populations, M stars and reddened quasars, are so different to L and T dwarfs, the photo-type method can potentially identify L and T dwarfs that are quite different to typical L and T dwarfs, that might have been missed by previous searches. These would manifest themselves as a cloud of sources with colours significantly different from the template colours.
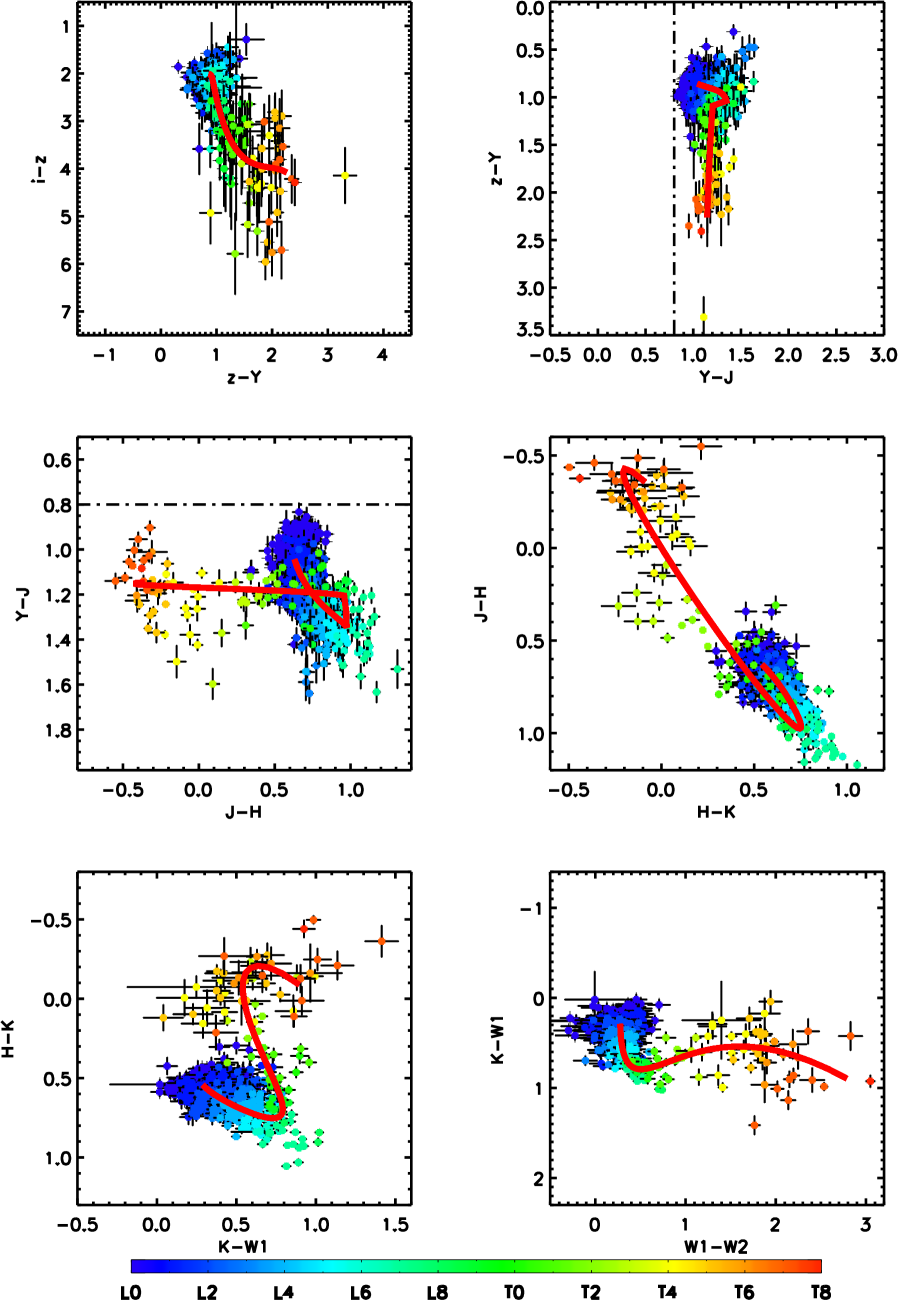
Fig. 6 plots two-colour diagrams, successively cycling through pairs of colours from the set , , , , , , . In each plot the 1361 objects are represented by rainbow colours from blue to red, that translate to classifications L0 to T8, as shown by the colourbar. The red line in each panel plots the template colour relations. We note the following points:
-
1.
The scatter in the diagrams is larger than can be explained by the photometric errors. In Paper I, in classifying, we allowed for this by adding (in quadrature) an uncertainty to each point in each band of 0.05 mag., corresponding to an uncertainty of 0.07 mag. in each colour.
-
2.
As noted in Paper I, the template colours for T dwarfs are not well defined, and the band does not contribute usefully to the classification of T dwarfs.
-
3.
There are very few objects with colours close to the colour cut , meaning there is no evidence we have missed a significant number of sources due to this colour cut. 777In fact we checked explicitly that there are no sources in the colour range classified L or T.
-
4.
There is a suggestion that mid-T dwarfs are mostly redder in than the template curve (sources near , ).
-
5.
There is also evidence for a mismatch between the colours and the template curve in the vs plot, near , where T3 dwarfs lie bluer in than the curve.
-
6.
Referring to the vs diagram, there are several mid T dwarfs, around that have blue colours compared to the red curve. This suggests that the template polynomial (Fig. 2, Paper I) should bend to bluer colours near T4. Nevertheless making this correction would have very little effect on the classifications, which around T4 are largely determined by the and colours.
Variability may contribute to the scatter in these plots, as not all bands were observed at the same epoch. In UKIDSS DR10, of the area has observations at two epochs. For this work we have always used the first epoch observation, which may not be the nearest in time to the observations. In looking at sources in the catalogue with high values of , the possibility that variability may contribute to the poor fit should be considered, and a check against the observation dates made.
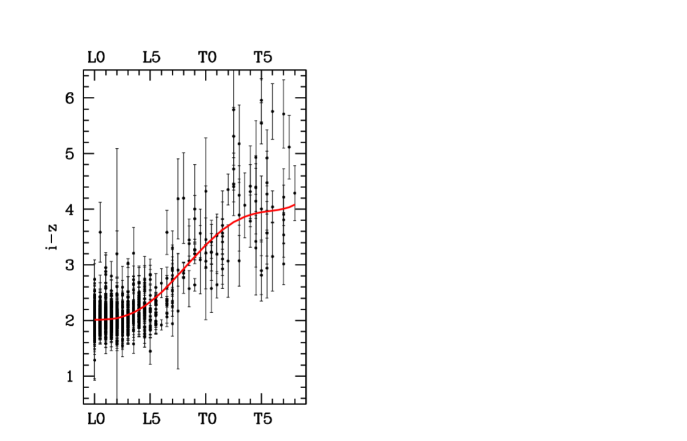
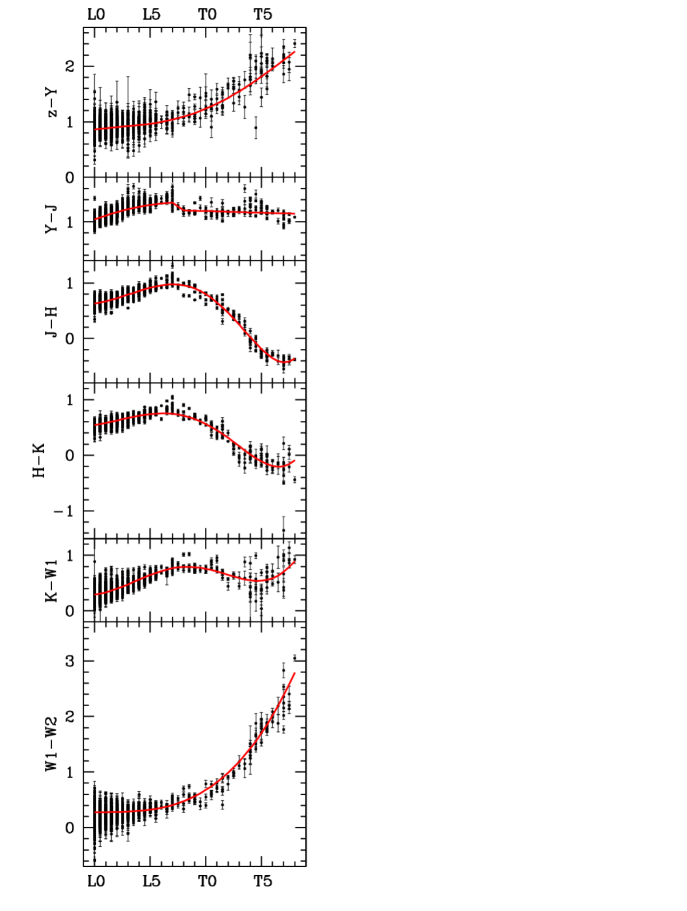
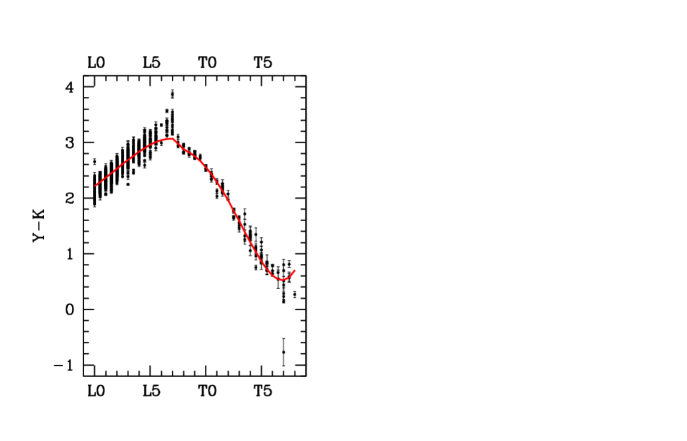
The features noted in the two-colour diagrams, listed above, may also be picked out in Figs 7 and 8, that plot colour against photo-type spectral type, together with the template polynomials. None of these features is sufficiently striking to suggest that the templates need changing at this time, but they motivate spectroscopic investigation of some of the outliers. There is nevertheless one additional feature that suggests the presence of a population of objects that was under-represented in the original sample of 190 known sources used in creating the templates. This is a group of very red objects evident around spectral type L7, where the template curves underfit the colours in the , , and plots. This feature is accentuated in Fig 9, where we plot against spectral type. In this plot a dramatic discontinuity in colour mag. is evident, between spectral types L7 and L8.
The explanation for this discontinuity is not clear, but three separate effects may contribute. First, it is possible that the actual curvature of the and colour relations around L7 is inadequately represented by the low-order polynomials used. Second, there are several objects that are very red in , that may not be genuine L7s but are classified as such because, over the near-infrared bands, this is the reddest spectral type. An example is the L2 dwarf 2MASS J01262109+1428057 (Metchev et al. 2008) previously discussed. The photo-type classification of this source is L7p, and it is one of two objects with . These very red objects may make the discontinuity appear larger than it really is i.e. they should really be outliers plotted at a different spectral type. Third, there is a discontinuity in the template curve of size 0.14 mag. between types L7 and L8. In Paper I we speculated that this was associated with a rapid weakening of FeH absorption in the band. We would expect photometric errors to tend to wash out this feature in the classification process, yet in Figs 8 and 9 the feature appears to be enhanced relative to the plot in Paper I. Therefore the discontinuity appears to be real, and requires explanation. Near-infrared spectroscopy of several sources in the catalogue in the interval L6 to L9 could be very revealing.
4 Sample completeness
In this section we quantify the completeness of the sample. In Paper I, §2.2.1, we showed that the SEDs of quasars and L and T dwarfs are sufficiently distinct that contamination of the LT sample by reddened quasars should be negligible. This also means that any L or T dwarf in the base sample of 9487 stars, , should be correctly classified as such, modulo an uncertainty in classification of one spectral sub-type (meaning that some Ls are classified M and vice versa). This conclusion rests on the assumption that the L and T templates and the quasar templates are adequate representations of the colours of these populations. As noted in §2.1 and §3.1, the polynomial modelling of the colours of the reddest L dwarfs is not entirely satisfactory. Although at present there is no evidence that any such sources are missed by the photo-type method, until the modelling of very red sources is improved it is not possible to be definitive on this matter.
As described in Paper I we searched DwarfArchives.org and several recent papers for L and T dwarfs within the survey footprint. Here we use these objects to identify potential sources of incompleteness that are not addressed by the colour modelling presented in Paper I. There are three close binaries, classified as stellar (i.e. a point source) in 2MASS, but as non-stellar888As described in Paper I, we used the UKIDSS parameter mergedclassstat to define classes stellar and non-stellar in UKIDSS, because of the better image quality, and therefore missed. There is therefore a small bias against finding binaries with separations of a few tenths of an arcsec. Rather than attempt to quantify this, we simply define our sample as consisting of objects classified as stellar in UKIDSS. The remainder of the sample is used for identifying the different sources of incompleteness, which are as follows.
-
1.
A handful of objects are missed because of unreliable photometry in any band e.g. landing on a bad row in one of the SDSS images. This left 192 known L and T dwarfs with good photometry that could have been selected by photo-type.
-
2.
One of the 192 sources, WISEPC J092906.77+040957.9, was missed due to large proper motion, that just exceeded the UKIDSS inter-band matching radius. No sources were missed from large proper motion when matching to SDSS and WISE for which a larger match radius was used.
-
3.
Another of the 192 sources, SDSS J074656.83+251019.0, was missed because it has i.e. it is a peculiar blue source. The photo-type classification of this source is M8.5.
Of the remaining 190 known L and T dwarfs, all were successfully classified as ultracool dwarfs, so the photo-type method per se does indeed appear to be highly complete. In the following three subsections §§4.1, 4.2, 4.3, we quantify the incompleteness associated with points 1, 2, 3, above, respectively.
4.1 Unreliable photometry
In creating a clean multi-band catalogue of matched photometry of stellar sources, a proportion of sources will be eliminated due to unreliable photometry. There are several causes of unreliable photometry. For example Dye et al. (2006) note various artifacts in the UKIDSS data including moon ghosts, channel bias offsets, and cross-talk. Then in the SDSS data a clean UKIDSS source may land on a diffraction spike or bad row. Alternatively two separate sources in UKIDSS (seeing FWHM ) may be blended in the SDSS images (seeing FWHM ). The different sources of incompleteness may affect only one band (e.g. bad row), or more than one (e.g. diffraction spike). It is difficult to quantify all these sources one by one, but in matching several bands together the total fraction lost can be significant.
We have made an empirical estimate of the fraction of sources lost due to the cumulative effects of unreliable photometry in different bands by using deeper UKIDSS Deep Extragalactic Survey (DXS) data as a reference. The DXS (Lawrence et al. 2007) covered tens of square degrees in to depths some 3 mag. deeper than the LAS. Our starting point is to assume that a catalogue of stellar sources detected in the band in the DXS is a close approximation to a complete sample of isolated stellar objects in the field. The DXS image is formed from a stack of many images. In averaging to form the stack, discrepant images are eliminated, meaning the DXS catalogue should be very clean. The DXS overlaps the LAS in the SA22 field (centre , ), and we selected a catalogue of stellar sources over 5.9 deg2. We then measured how many of these propagated through to the base catalogue of LAS sources in that was the starting point for our search for L and T dwarfs. Note that because of the problem of blending we did not require a successful match to W1 and W2 to include an object in the catalogue (see Paper I for more details), so the matching to WISE is not relevant to the calculation of incompleteness. The result of the match to DXS was that of sources are lost due to unreliable photometry in one or more bands. The incompleteness is independent of brightness. Because of this, we account for this source of incompleteness by a reduction in the effective area of the survey from 3344 to 3070 deg2.
4.2 Large proper motion
The search radii for matching to SDSS and WISE were sufficiently large to capture all known L and T dwarfs. However a few objects with high proper motion, such as WISEPC J092906.77+040957.9, could be missed because of the smaller match radius used in UKIDSS. For detected sources in the UKIDSS LAS, the band position is used as the reference point for a matching radius i.e. if the measured offset in , , or is larger than , the source remains unmatched, and it is declared a separate source. Therefore whether a source is matched depends on the proper motion, and the , , and epoch differences.
To assess the importance of proper motions we took the 192 known L and T dwarfs and extracted the largest angular offset of the three values i.e. from the , , and matches. These maximum offsets are plotted in Fig. 10 against epoch difference, as red symbols. The source WISEPC J092906.77+040957.9 is the dot plotted above the line, which marks the matching radius. Only one other catalogued source, the sdL7 2MASS J11582077+0435014 (from Kirkpatrick et al. 2010), has an offset larger than . Given that the catalogued sources are mostly relatively bright compared to our magnitude limit, their typical proper motions are likely to be larger than for our sample as a whole, because the sources are mostly nearer. For example the median distances of the sources in the sample of 427 late-type M, L, and T dwarfs of Faherty et al. (2009) are 23, 29, and 15 pc respectively, whereas the median distance for our sample as a whole is 94 pc. So we can expect incompleteness due to proper motion in our sample to be . The black symbols show the offsets for the sample of 1361 L and T dwarfs presented here. With only a handful of sources with offsets , this is supporting evidence that incompleteness due to proper motion is very small i.e. there is no evidence for a significant population of sources with large proper motions.
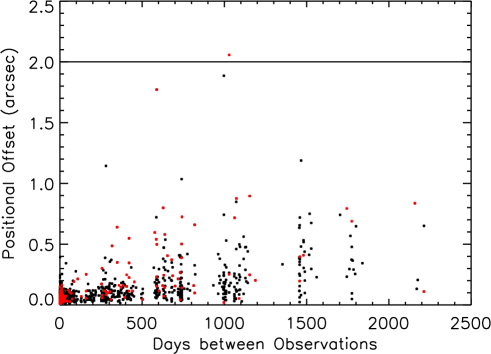
The reasons why incompleteness due to proper motion is such a minor issue for the new sample are that most of the new sources are more distant than the majority of known L and T dwarfs, and because for most of the fields all of the UKIDSS data were taken over a short time period; for over of the fields all filters were observed within two years of each other. The latter point is illustrated in Figure 11, which plots the proportion of fields for which all the observations were completed within the given time interval.
In this subsection we quantify incompleteness of the sample in a physical way, as a function of tangential velocity. We first assume, for simplicity, that the distribution of maximum time intervals for the sample (the black dots in Fig. 10) is an adequate approximation of the distribution of maximum time intervals over all the UKIDSS fields in which L and T dwarfs could be found. Next we estimate the distances for the sample using the magnitudes and the absolute magnitudes from Dupuy & Liu (2012). We assume this distribution of distances is an adequate representation of the true distribution of the distances of L and T dwarfs in the field. This will be reasonable provided incompleteness overall is small, an assumption we can check at the end. We now treat these two distributions, and , as independent. It is then possible to quantify completeness in terms of tangential velocity . We imagine all sources have a particular tangential velocity . For sources at distance we compute the proper motion, and compute the fraction that move more than , from the distribution . Integrating over gives the total fractional incompleteness for the given .
The results of this calculation are shown in Fig. 12, which plots the incompleteness as a function of . From this plot it is clear that for L and T dwarfs in the Galactic thin disk, for which the 3D velocity dispersion is km s-1 (Seifahrt et al. 2010), incompleteness due to proper motion is completely negligible. For the rarer members of the thick disk or halo, incompleteness due to proper motion is still very small. For a tangential velocity of km s-1, the sample incompleteness is only 1.5 (5.5). But such sources are rare. In the sample of 427 late-type M, L, and T dwarfs analysed by Faherty et al. (2009), only 14, i.e. , had tangential velocities greater than 100 km s-1. The overall incompleteness due to proper motion is therefore negligibly small, . This conclusion justifies the original assumption that is an adequate representation of the distribution of distances of the LT population. Note that the incompleteness values computed are for the sample as a whole, and that incompleteness depends on magnitude i.e. the percentage incompleteness is larger for brighter (nearer) sources.


| R.A. (2000) | Decl. (2000) | SpT | PhT | |||||||||
|---|---|---|---|---|---|---|---|---|---|---|---|---|
| 02:12:58.07 | +06:41:17.6 | 20.760.08 | 18.870.08 | 18.200.03 | 17.430.03 | 17.060.03 | 16.780.05 | 16.310.06 | 15.980.18 | sdL0.51 | M6.5 | 19.81 |
| 03:33:50.84 | +00:14:06.1 | 18.850.02 | 17.270.03 | 16.810.01 | 16.110.01 | 15.770.01 | 15.500.02 | sdL02 | M7p | 35.19 | ||
| 11:58:20.77 | +04:35:01.4 | 20.650.08 | 17.620.03 | 16.610.01 | 15.430.01 | 14.880.01 | 14.370.01 | 13.700.03 | 13.360.03 | sdL73 | L3p | 128.69 |
| 12:44:25.90 | +10:24:41.9 | 19.120.02 | 17.470.02 | 16.980.01 | 16.260.01 | 16.000.01 | 15.770.02 | 15.450.04 | 15.140.09 | sdL0.54 | M7p | 65.09 |
| 12:56:37.10 | 02:24:52.5 | 19.140.03 | 17.270.02 | 16.770.01 | 16.080.01 | 16.050.01 | 15.210.04 | 15.010.08 | sdL3.55 | M6p | 93.10 | |
| 13:33:48.27 | +27:35:05.5 | 20.140.05 | 18.210.04 | 17.470.02 | 16.620.01 | 16.270.02 | 15.980.02 | sdL36 | M8p | 35.56 | ||
| 13:50:58.86 | +08:15:06.8 | 20.880.08 | 18.990.06 | 18.660.05 | 17.930.04 | 18.070.10 | 17.950.15 | 17.450.20 | sdL57 | M5.5p | 77.49 | |
| 14:14:05.74 | 01:42:02.7 | 19.550.03 | 17.970.03 | 17.500.03 | 16.810.02 | 16.450.03 | 16.140.03 | sdL0.51 | M7p | 23.45 | ||
| 14:16:24.08 | +13:48:26.7 | 18.000.02 | 15.360.02 | 14.260.01 | 12.990.01 | 12.470.01 | 12.050.01 | sdL78 | L4p | 152.37 |
4.3 Peculiar blue sources,
Peculiar blue L and T dwarfs could be missed because they are classified earlier than L0, or have colours bluer than the selection limit (these are nearly the same thing). To investigate this issue we began by analysing the colours of known L and T subdwarfs. Subdwarfs however are only the most extreme examples of peculiar blue sources, being outnumbered by low metallicity members of the thick disk. To estimate the incompleteness due to blue L dwarfs being classified M, we use the sample of L dwarfs from Schmidt et al. (2010), which is free of colour biases.
4.3.1 Colours of subdwarfs
We searched the literature for all subdwarfs for which we were able to collect photometry in at least 6 of the bands. The 9 subdwarfs satisfying these criteria are listed in Table 9. The table lists coordinates, photometry, spectral type (SpT), the photo-type classification (PhT), the of the fit, and the reference to the discovery paper. Seven of the nine sources have photo-type classifications earlier than L0, and of these, six have . None were considered before: five are recent discoveries and are not in DwarfArchives.org; one has ; one has not been observed in in UKIDSS. Of the other two sources, both with , the sdL7 2MASS J11582077+0435014 (from Kirkpatrick et al. 2010) is in our sample, and the sdL7 SDSS J141624.09+134826.7 (from Schmidt et al. 2010) would be, but it is just brighter than our catalogue bright limit . The bluer colours of L subdwarfs result in photo-type classifications that are on average between four and five spectral sub-types earlier than the spectral classification. This indicates that our sample will miss most subdwarfs of type sdL4 and earlier, but will include most subdwarfs of type sdL5 and later.
Table 9 contains 6 objects in the range , and detected in , i.e. within our search volume, and therefore amounting to of the LT population. This would be an underestimate of the total proportion of subdwarfs in the LT population, as the sample is incomplete. This limit is substantially larger than the figure favoured by Chabrier (2003) of . The subdwarf fraction in the cool dwarf regime is bounded to be , for all M stars (Covey et al. 2008), and , for types M5 (Lodieu et al. 2012a), values consistent with the estimate of Chabrier (2003). It is possible that not all the sources in Table 9 are genuine subdwarfs, but that some are thick disk sources.
Table 9 contains 5 sources , detected in , classified by photo-type as M, implying a lower limit to the incompleteness to peculiar blue sources of .
Although the colours of subdwarfs lead to earlier classifications, the values for the fits, listed in Table 9, are rather large, and all but one of the known subdwarfs would be identified as peculiar, with . We therefore investigated relaxing the colour cut, attempting to identify subdwarfs as objects with M-star photo-type classifications but with large . This proved unsuccessful, because the number counts of M stars increase so steeply towards bluer colours, that the L subdwarfs are greatly outnumbered by M stars with peculiar colours, and so cannot be picked out. We also attempted to use the known subdwarfs to define colour templates. This also failed, because the differences in colour between subdwarfs of the same spectral type are as great as the difference between a particular subdwarf and the nearest MLT template.
Although we have been unable to develop a method to identify complete and uncontaminated samples of subdwarfs of type sdL4 and earlier, there would be value in pursuing this problem further, as even a sample with, say, contamination (requiring spectrosopic confirmation), would provide a valuable complement to samples derived using proper motion.
4.3.2 Incompleteness estimate
In this section we use the sample of 484 L dwarfs of Schmidt et al. (2010) to estimate the incompleteness due to peculiar blue L dwarfs being classified M. The sample of Schmidt et al. (2010) is particularly useful because of the lack of colour bias. A very blue cut in the colour was taken, sufficient to ensure inclusion of all L dwarfs.
We matched the L dwarf sample of Schmidt et al. (2010) to UKIDSS and WISE and limited attention to the 142 sources with reliable photometry in all bands , and brighter than . We classified this sample using photo-type and then examined the colours and classifications. Clipping outliers where the photo-type and spectroscopic classifications differed by sub-types, we measured a r.m.s. scatter in the photo-type classifications of precisely 1.0 sub-types. This uncertainty agrees with our previous estimate (Paper I). Therefore, except for outliers differing by sub-types, our catalogue of L dwarfs is unbiased, since we will account for this scatter in the calculation of the luminosity function (see §2). There are 3 sources for which the classification differs by sub-types, and are classified M, and there are a further two sources with colours . These 5 sources are therefore peculiar blue sources that are missed by photo-type. Of these, 3 are L0, 1 is L1 and 1 L3. Counting the number of sources in these classes in the Schmidt et al. (2010) sample, and applying this fractional incompleteness to the same bins in our sample of 1361 sources, results in a computed incompleteness of due to peculiar blue sources classified as M.
A corollary of the conclusion that photo-type classifications for peculiar blue sources are biased towards earlier spectral types is that the photo-type classifications for peculiar red sources will be biased towards later spectral types. For example the L2 dwarf 2MASS J01262109+1428057 (Metchev et al. 2008), previously noted, which has , has a photo-type classification of L7. We can expect our catalogue to be correspondingly overcomplete for peculiar red objects, by including sources classified as early L that are actually peculiar red M stars. Such peculiar red sources are typically young, and therefore of low mass, and may include examples with planetary masses. The proportion of such sources is not known, but they should be found among the sources with large . Clearly a useful exercise would be to obtain spectra of all 97 sources with , to characterise the peculiar blue and red populations and quantify their numbers.
5 Spectroscopic follow up of peculiar sources

In Paper I we presented spectra of 8 sources from the photo-type LT catalogue. All had , i.e. were classified as normal rather than peculiar. All sources were confirmed as normal ultracool dwarfs, and there was very close agreement between the spectroscopic classification and the photo-type classification.
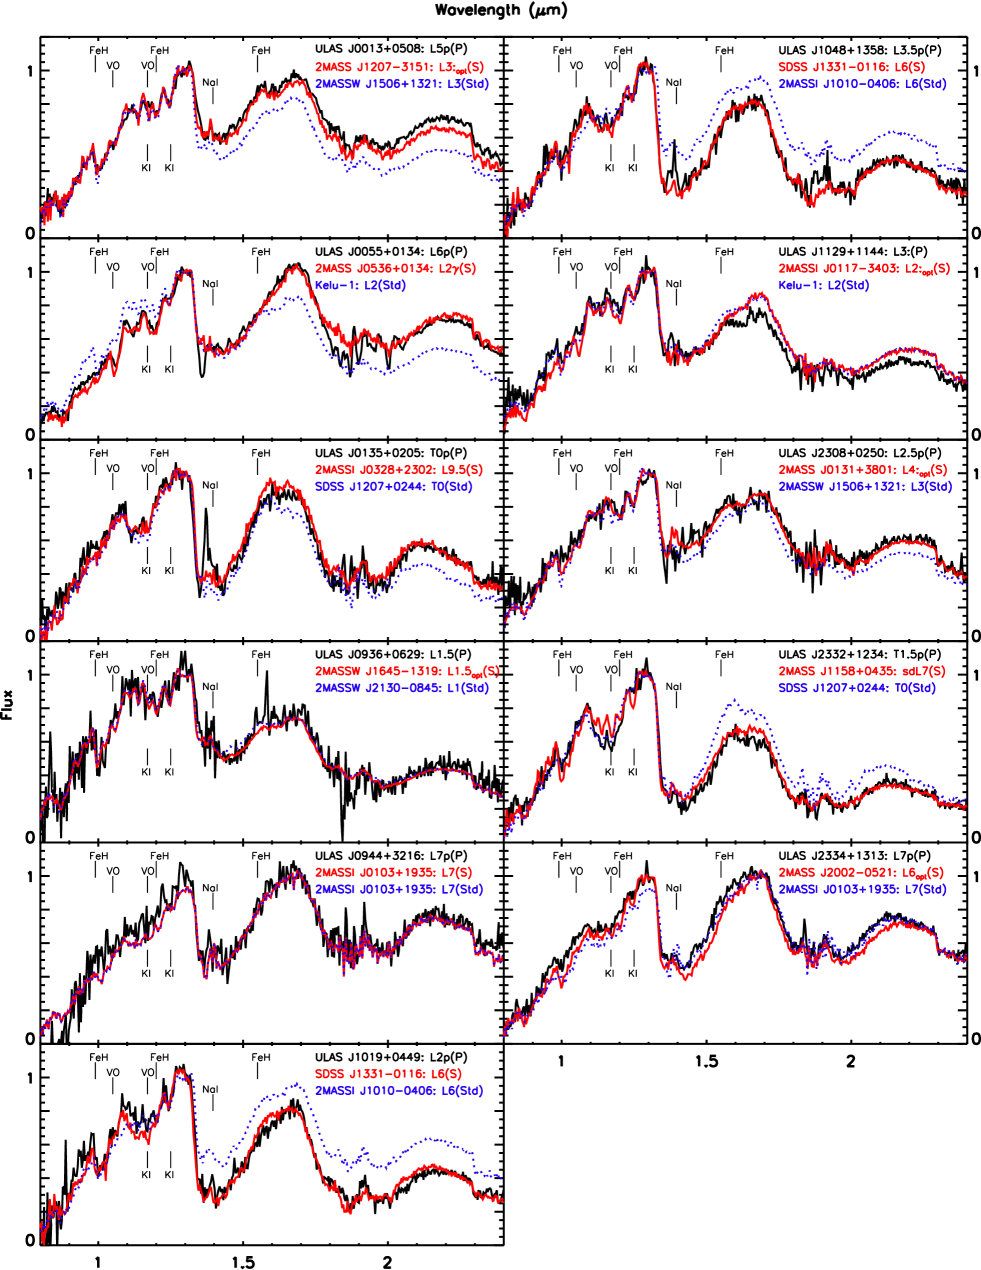
In the current paper we present spectra of 11 additional sources, of which 9 have , i.e. are classified as peculiar. The coordinates of the 11 sources are provided in Table 7, together with details of the observations. In the following we use the short names provided in Table 7. The spectra were obtained with the SpeX spectrograph mounted on the 3m NASA Infrared Telescope Facility (IRTF) over several nights in March, May and November 2013. Photometry of the sources and the photo-type and spectroscopic classifications are provided in Table 8. The spectra are presented in Fig. 13. All sources are confirmed as ultracool dwarfs.
The conditions over the runs were variable with patchy clouds. The seeing FWHM was in the range at . We operated in prism mode with the 0.8 slit aligned at the parallactic angle and obtained low-resolution (/ 90) near-infrared spectral data spanning 0.7 - 2.5 m. Each target was first acquired in the guider camera. Exposure times varied from 150s to 180s depending on the brightness of the target. Six to 12 images were obtained for each object in an ABBA dither pattern along the slit. An A0V star was observed immediately after each target at similar airmass, for flux calibration and telluric correction. Internal flat-field and Ar arc lamp exposures were acquired for pixel response and wavelength calibration, respectively. All data were reduced using SpeXtool version 3.3 (Vacca et al. 2003, Cushing et al. 2004) using standard settings, with the exception that we modified the procedure to correct for telluric absorption, by accounting for the difference between the airmass the target was observed at and the airmass the telluric standard was observed at.
Spectral types were first estimated by visually comparing each object to the near infrared spectral standards from Kirkpatrick et al. (2010). All spectra were normalized as described in Kirkpatrick et al. (2010) and the best fit was determined by eye. Subsequently, we compared each spectrum to the library of optically classified M-T dwarfs in the SpeX Prism Library (SPL; Burgasser (2014)) and applied a chi-square minimisation routine to determine the closest object match (see Cushing et al. (2008) for technique description). Fig. 13 shows the spectrum with its photo-type (black), the best visual spectral standard match (blue), and the best fit object from the SPL with its optical spectral type displayed (red).
Of the 11 sources with spectra, 2 objects have 20, i.e. were phototyped as normal. Our spectral analysis confirms that ULAS J0936+0629 with =2 is a field L1 and ULAS J1129+1144 with =4 is a field L2. These classifications are very similar to the photo-type classifications of L1.5 and L3:, respectively, as expected.
Nine objects in the spectral sample have 20, i.e. were phototyped as peculiar. We plot the difference in mag. in each band between the object SED and the best-fit photo-type template in Fig. 14 so that it is possible to see which wavelengths contribute most to the large . In this plot, points above the line correspond to the source being brighter than the template. Our spectral analysis yields the following:
ULAS J0013+0508 The spectrum (Fig. 13) is best fit by the optical L3 2MASS J12070374-3151298 (Burgasser et al. 2010) and the L3 IR standard from Kirkpatrick et al. (2010). The source shows no obvious peculiar spectral features in the near-infrared region, except that it is redder than the standard. The large =25.8 arises because the source is red in but blue in compared to the template colours. An optical spectrum would be useful to confirm this mismatch, as this may highlight the strength of photo-type compared to spectral classification i.e. the ability to identify peculiar objects because of the large wavelength coverage. The source ULAS J2308+0250 displays similar behaviour.
ULAS J0055+0134 We find the spectrum of ULAS J0055+0134 shows classic signatures of low-surface gravity with deep VO absorption and weak alkali line absorption (e.g. Allers & Liu 2013). The best (poorly) fit IR standard from Kirkpatrick et al. (2010) is Kelu-1 (L2) although ULAS J0055+0134 is significantly redder, a trademark of young low-gravity brown dwarfs (e.g. Faherty et al. 2012, 2013). Using the Allers & Liu (2013) indices which take into account VO, FeH, continuum, and KI, we find this source would be considered a very low-gravity (VL-G) L2. The best fit individual object is the optical L2 2M0536+0134 (Faherty et al., in prep, where coordinates will be provided), which is in agreement with the IR indices evaluation, as the sources on the Cruz et al. (2009) optical classification scheme are also very low gravity and likely younger than the Pleiades ( 120 Myr, Stauffer et al. 1998).
The =60.8 correctly identifies this source as peculiar and the photo-type prediction of L6p is incorrect but logical given how red the young brown dwarfs are compared to field sources.
ULAS J0135+0205 The spectrum (Fig. 13) is best fit by the L9.5 2MASSI J0328426+230205 (Burgasser et al. 2008) and the T0 IR standard from Burgasser et al. (2006a). The photo-type class is T0p, and the large =37.9 is evident in Figure 14, where the SED is highly discrepant compared to the T0 template, being too blue from to , and again in . Since the near infrared spectrum (and photometry) appears normal, an optical or mid infrared spectrum would aid in deciphering the potential peculiarity.
ULAS J0944+3216 The spectrum (Fig. 13) is best fit by the L6 2MASSI J0103320+193536 (Cruz et al. 2004, Allers & Liu 2013) which happens to be the L7 near infrared standard from Kirkpatrick et al. (2010). Allers & Liu (2013) give 2MASSI J0103320+193536 an intermediate gravity classification, hence this is a mildly low surface gravity brown dwarf. ULAS J0944+3216 shows similar signs of an intermediate gravity due to its H band continuum. However low surface gravity spectral deviations are difficult to pinpoint beyond L5. Therefore this designation should be considered tentative.
The photo-type class is L7p with very large =106.9, evident in Figure 14 where there is a mismatch to the template at nearly all wavelengths. Some of this may be attributed to the apparent general mismatch of the templates at spectral type L7, over the interval , noted before, and visible in Fig. 9. This further emphasises the importance of investigating the discontinuity in between spectral types L7 and L8.
ULAS J1019+0449 and ULAS J1048+1358 The spectra of both ULAS J1019+0449 and ULAS J1048+1358 are best (poorly) fit by the near infrared L6 standard from Kirkpatrick et al. (2010). The best match from the SPL is the unusually blue high source SDSS J133148.92-011651.4 (Faherty et al. 2009, Kirkpatrick et al. 2010, Burgasser et al. 2010). Similarly both sources received a photo-typeclass of L2p/L3.5p, much earlier than the spectral best fits. As expected these objects are unusually blue for their types which drove the photo-type class to an earlier but peculiar classification. Assuming a spectrophotometric distance using the Dupuy & Liu (2012) relations along with the proper motion extracted from multiple epochs, /yr, we find that ULAS J1019+0449 has a moderately high ( 85 km s-1). The measured proper motion of ULAS J1048+1358 is /yr. We conclude that both sources warrant the peculiar designation allotted by photo-type and implied by their large values.
Interestingly ULAS J1019+0449 has an enticingly sharply peaked band that typically identifies young low surface gravity brown dwarfs. However Aganze et al. (2016) have recently shown that low metallicity, high surface gravity brown dwarfs can mimic this same feature with a reason likely linked to condensation efficiency or changes in the collision induced H2 absorption.
ULAS J2308+0250 The spectrum (Fig. 13) is best fit by the optical L4 2MASS J01311838+3801554 (Burgasser et al. 2010) and the L3 IR standard from Kirkpatrick et al. (2010). The photo-type of L2.5p with mild =20 is consistent with the best fits. The source shows no obvious peculiar spectral features. The SED mismatch of this source is quite similar to that of ULAS J0013+0508 i.e. red in the near-infrared and blue in the optical. An optical spectrum would be useful to confirm this mismatch.
ULAS J2332+1234 The spectrum (Fig. 13) is best (poorly) fit by the T0 IR standard from Burgasser et al. (2006a). The sdL7 2MASS J11582077+0435014 from Kirkpatrick et al. (2010) is the best fit to the spectrum of ULAS J2332+1234. Compared to the T0 IR standard displayed – which was the best standard match – ULAS J2332+1234 shows supressed and bands, a hallmark of low-metallicity objects. Compared to the known sdL7, ULAS J2332+1234 does not demonstrate the same depth of FeH absorption though it matches well in and . The photo-type of T1.5p with =36.4 is consistent with low-metallicity peculiar sources being typed later given their blue SEDs. We measure a proper motion of /yr for this source, which adds to the evidence of low metallicity.
ULAS J2334+1313 Similarly to ULAS J0944+3216, the photo-type class L7p and the spectral class L7 agree for this source. In this case, the best fit from the SPL was the L6 field object 2MASS J20025073-0521524 (Burgasser et al. 2008). Unlike ULAS J0944+3216, the source does not fall on the intermediate gravity scale based on its band continuum. The SED mismatch, with , is less severe than for ULAS J0944+3216. This source may be further evidence for the problematic typing of L7 objects discussed in section 3.
| Name | Short | Date (UT) | A0 star | |
|---|---|---|---|---|
| name | sec. | HD no. | ||
| ULAS J001306.33+050851.2 | ULAS J0013+0508 | 24/11/2013 | 1800 | 219833 |
| ULAS J005505.69+013436.0 | ULAS J0055+0134 | 24/11/2013 | 1200 | 13936 |
| ULAS J013525.37+020518.5 | ULAS J0135+0205 | 20/11/2013 | 1500 | 13936 |
| ULAS J093621.87+062939.1 | ULAS J0936+0629 | 20/11/2013 | 1500 | 71908 |
| ULAS J094419.56+321605.2 | ULAS J0944+3216 | 27/03/2013 | 1800 | 89239 |
| ULAS J101950.97+044941.0 | ULAS J1019+0449 | 24/11/2013 | 1080 | 89239 |
| ULAS J104814.77+135832.7 | ULAS J1048+1358 | 22/11/2013 | 1440 | 89239 |
| ULAS J112926.00+114436.2 | ULAS J1129+1144 | 10/05/2013 | 800 | 97585 |
| ULAS J230852.99+025052.0 | ULAS J2308+0250 | 20/11/2013 | 1500 | 219833 |
| ULAS J233227.03+123452.1 | ULAS J2332+1234 | 24/11/2013 | 1800 | 210501 |
| ULAS J233432.53+131315.3 | ULAS J2334+1313 | 24/11/2013 | 1500 | 210501 |
| Name | PhT | SpT | |||||||||
|---|---|---|---|---|---|---|---|---|---|---|---|
| ULAS J0013+0508 | 20.910.09 | 19.040.09 | 18.100.03 | 16.750.02 | 15.720.01 | 14.910.01 | 14.330.03 | 13.970.04 | L5p | 25.8 | L3 |
| ULAS J0055+0134 | 20.670.07 | 18.750.06 | 17.710.02 | 16.370.01 | 15.290.01 | 14.400.01 | 13.710.03 | 13.250.03 | L6p | 60.8 | L2 |
| ULAS J0135+0205 | 21.760.12 | 18.690.05 | 17.550.02 | 16.480.02 | 15.660.01 | 14.990.01 | 14.280.03 | 13.880.04 | T0p | 37.9 | T0 |
| ULAS J0936+0629 | 20.440.06 | 18.550.05 | 17.620.02 | 16.450.01 | 15.760.01 | 15.150.01 | 14.810.03 | 14.530.06 | L1.5 | 2.0 | L1 |
| ULAS J0944+3216 | 22.120.20 | 19.590.09 | 18.610.04 | 17.190.02 | 16.080.01 | 15.150.01 | 14.240.03 | 13.690.03 | L7p | 106.9 | L7 |
| ULAS J1019+0449 | 21.550.13 | 19.060.07 | 18.060.02 | 16.820.01 | 16.240.02 | 15.630.02 | 15.110.04 | 14.890.10 | L2p | 21.4 | L6p |
| ULAS J1048+1358 | 21.610.13 | 18.970.07 | 17.880.02 | 16.720.01 | 16.040.01 | 15.380.01 | 14.640.03 | 14.500.06 | L3.5p | 33.4 | L6p |
| ULAS J1129+1144 | 20.660.09 | 18.800.07 | 17.760.02 | 16.560.01 | 15.810.02 | 15.080.02 | L3: | 4.0 | L2 | ||
| ULAS J2308+0250 | 20.060.04 | 18.210.04 | 17.340.02 | 16.080.01 | 15.200.01 | 14.500.01 | 14.160.03 | 13.920.04 | L2.5p | 20.0 | L3 |
| ULAS J2332+1234 | 22.300.26 | 19.370.10 | 18.100.04 | 16.900.02 | 16.390.03 | 15.880.03 | 15.180.04 | 14.770.07 | T1.5p | 36.4 | T0 |
| ULAS J2334+1313 | 21.910.19 | 18.960.06 | 17.860.02 | 16.600.01 | 15.580.01 | 14.660.01 | 13.800.03 | 13.280.03 | L7p | 50.9 | L7 |
5.1 Candidate binaries
In Paper I, §2.4, we described a method to identify candidate unresolved LT binaries using the SEDs. The method identifies sources where the SED fit is improved significantly for a binary, compared to a single source. The method is more or less effective depending on the two dwarfs comprising the binary, and was shown to be particularly sensitive for the case of a primary near L5 and a secondary near T5. Three of the sources listed in Table 7 were identified as candidate binaries: ULAS J0135+0205 (L6+T3), ULAS J1019+0449 (L3+T4), and ULAS J2332+1234 (L8+T4). For the second and third of these, the spectra indicate that the large of the photo-type fit is a consequence of the low metallicity of the source, rather than due to binarity. For ULAS J0135+0205 we find that over the near-infrared region the spectrum is better fit as single (T0), rather than by the binary combination ((L8+T4) suggested by the photometry. On the evidence of these three sources it appears that the method more often picks out single sources with spectral peculiarities that mimic the colours of binaries, rather than picks out genuine unresolved binaries.
6 Summary
In this paper we presented a large sample of ultracool dwarfs, with accurate spectral types, comprising 1281 L dwarfs and 80 T dwarfs, brighter than . This is the first large homogeneous sample covering the entire spectral range L0 to T8, and will be valuable for statistical studies of the properties of the population, including measuring the substellar mass function, measuring the disk scale height (in conjunction with a deeper sample), and quantifying the spread in metallicity and surface gravity in the population. Because the sample is large it will also be useful for identifying rare types of L and T dwarf, including young red sources, and identifying benchmark systems.
Acknowledgements.
We are grateful to Sarah Schmidt for pointing out the issue with the colours of our M star templates, and for help in improving the templates. We thank Paul Hewett for providing new quasar colour templates, extended to include W1 and W2, and Mike Read for help in understanding the details of the UKIDSS matching algorithm. We are also grateful to Daniella Bardalez Gagliuffi for useful discussions related to the spectral typing of objects.We are grateful to the anonymous referee for a very detailed report that resulted in substantial improvements to the paper.
This research has benefited from the SpeX Prism Spectral Libraries, maintained by Adam Burgasser at http://pono.ucsd.edu/ adam/browndwarfs/spexprism.
This publication makes use of data products from the Wide-field Infrared Survey Explorer, which is a joint project of the University of California, Los Angeles, and the Jet Propulsion Laboratory/California Institute of Technology, and NEOWISE, which is a project of the Jet Propulsion Laboratory/California Institute of Technology. WISE and NEOWISE are funded by the National Aeronautics and Space Administration.
This research has benefited from the M, L, T, and Y dwarf compendium housed at DwarfArchives.org. The UKIDSS project is defined in Lawrence et al. (2007). UKIDSS uses the UKIRT Wide Field Camera (Casali et al. 2007). The photometric system is described in Hewett et al. (2006), and the calibration is described in Hodgkin et al. (2009). The science archive is described in Hambly et al. (2008).
Funding for SDSS-III has been provided by the Alfred P. Sloan Foundation, the Participating Institutions, the National Science Foundation, and the U.S. Department of Energy Office of Science. The SDSS-III web site is http://www.sdss3.org/. SDSS-III is managed by the Astrophysical Research Consortium for the Participating Institutions of the SDSS-III Collaboration including the University of Arizona, the Brazilian Participation Group, Brookhaven National Laboratory, Carnegie Mellon University, University of Florida, the French Participation Group, the German Participation Group, Harvard University, the Instituto de Astrofisica de Canarias, the Michigan State/Notre Dame/JINA Participation Group, Johns Hopkins University, Lawrence Berkeley National Laboratory, Max Planck Institute for Astrophysics, Max Planck Institute for Extraterrestrial Physics, New Mexico State University, New York University, Ohio State University, Pennsylvania State University, University of Portsmouth, Princeton University, the Spanish Participation Group, University of Tokyo, University of Utah, Vanderbilt University, University of Virginia, University of Washington, and Yale University.
References
- Aberasturi et al. (2011) Aberasturi, M., Solano, E., & Martín, E. L. 2011, A&A, 534, L7
- Aganze et al. (2016) Aganze, C., Burgasser, A. J., Faherty, J. K., et al. 2016, AJ, 151, 46
- Ahn et al. (2012) Ahn, C. P., Alexandroff, R., Allende Prieto, C., et al. 2012, ApJS, 203, 21
- Allen et al. (2007) Allen, P. R., Koerner, D. W., McElwain, M. W., Cruz, K. L., & Reid, I. N. 2007, AJ, 133, 971
- Allers & Liu (2013) Allers, K. N. & Liu, M. C. 2013, ApJ, 772, 79
- Bardalez Gagliuffi et al. (2014) Bardalez Gagliuffi, D. C., Burgasser, A. J., Gelino, C. R., et al. 2014, ApJ, 794, 143
- Berger (2006) Berger, E. 2006, ApJ, 648, 629
- Bihain et al. (2010) Bihain, G., Rebolo, R., Zapatero Osorio, M. R., Béjar, V. J. S., & Caballero, J. A. 2010, A&A, 519, A93
- Burgasser (2007) Burgasser, A. J. 2007, ApJ, 659, 655
- Burgasser (2014) Burgasser, A. J. 2014, in Astronomical Society of India Conference Series, Vol. 11, Astronomical Society of India Conference Series, 7–16
- Burgasser et al. (2010) Burgasser, A. J., Cruz, K. L., Cushing, M., et al. 2010, ApJ, 710, 1142
- Burgasser et al. (2006a) Burgasser, A. J., Geballe, T. R., Leggett, S. K., Kirkpatrick, J. D., & Golimowski, D. A. 2006a, ApJ, 637, 1067
- Burgasser et al. (2002) Burgasser, A. J., Kirkpatrick, J. D., Brown, M. E., et al. 2002, ApJ, 564, 421
- Burgasser et al. (2003) Burgasser, A. J., Kirkpatrick, J. D., Burrows, A., et al. 2003, ApJ, 592, 1186
- Burgasser et al. (2006b) Burgasser, A. J., Kirkpatrick, J. D., Cruz, K. L., et al. 2006b, ApJS, 166, 585
- Burgasser et al. (2008) Burgasser, A. J., Liu, M. C., Ireland, M. J., Cruz, K. L., & Dupuy, T. J. 2008, ApJ, 681, 579
- Burgasser et al. (2004) Burgasser, A. J., McElwain, M. W., Kirkpatrick, J. D., et al. 2004, AJ, 127, 2856
- Burgasser et al. (2009) Burgasser, A. J., Witte, S., Helling, C., et al. 2009, ApJ, 697, 148
- Burningham et al. (2013) Burningham, B., Cardoso, C. V., Smith, L., et al. 2013, MNRAS, 433, 457
- Burningham et al. (2011) Burningham, B., Leggett, S. K., Homeier, D., et al. 2011, MNRAS, 414, 3590
- Burningham et al. (2010a) Burningham, B., Leggett, S. K., Lucas, P. W., et al. 2010a, MNRAS, 404, 1952
- Burningham et al. (2010b) Burningham, B., Pinfield, D. J., Lucas, P. W., et al. 2010b, MNRAS, 406, 1885
- Burrows et al. (1997) Burrows, A., Marley, M., Hubbard, W. B., et al. 1997, ApJ, 491, 856
- Casali et al. (2007) Casali, M., Adamson, A., Alves de Oliveira, C., et al. 2007, Astronomy and Astrophysics, 467, 777
- Chabrier (2003) Chabrier, G. 2003, PASP, 115, 763
- Chiu et al. (2006) Chiu, K., Fan, X., Leggett, S. K., et al. 2006, AJ, 131, 2722
- Covey et al. (2008) Covey, K. R., Hawley, S. L., Bochanski, J. J., et al. 2008, AJ, 136, 1778
- Covey et al. (2007) Covey, K. R., Ivezić, Ž., Schlegel, D., et al. 2007, AJ, 134, 2398
- Cruz et al. (2004) Cruz, K. L., Burgasser, A. J., Reid, I. N., & Liebert, J. 2004, ApJ, 604, L61
- Cruz et al. (2009) Cruz, K. L., Kirkpatrick, J. D., & Burgasser, A. J. 2009, AJ, 137, 3345
- Cruz et al. (2007) Cruz, K. L., Reid, I. N., Kirkpatrick, J. D., et al. 2007, AJ, 133, 439
- Cushing et al. (2011) Cushing, M. C., Kirkpatrick, J. D., Gelino, C. R., et al. 2011, ApJ, 743, 50
- Cushing et al. (2008) Cushing, M. C., Marley, M. S., Saumon, D., et al. 2008, ApJ, 678, 1372
- Cushing et al. (2006) Cushing, M. C., Roellig, T. L., Marley, M. S., et al. 2006, ApJ, 648, 614
- Cushing et al. (2004) Cushing, M. C., Vacca, W. D., & Rayner, J. T. 2004, PASP, 116, 362
- Day-Jones et al. (2013) Day-Jones, A. C., Marocco, F., Pinfield, D. J., et al. 2013, MNRAS, 430, 1171
- Deacon et al. (2014) Deacon, N. R., Liu, M. C., Magnier, E. A., et al. 2014, ApJ, 792, 119
- Dupuy & Liu (2012) Dupuy, T. J. & Liu, M. C. 2012, ApJS, 201, 19
- Dye et al. (2006) Dye, S., Warren, S. J., Hambly, N. C., et al. 2006, MNRAS, 372, 1227
- Eddington (1913) Eddington, A. S. 1913, MNRAS, 73, 359
- Espinoza Contreras et al. (2013) Espinoza Contreras, M., Lodieu, N., Zapatero Osorio, M. R., et al. 2013, Memorie della Societa Astronomica Italiana, 84, 963
- Faherty et al. (2011) Faherty, J. K., Burgasser, A. J., Bochanski, J. J., et al. 2011, AJ, 141, 71
- Faherty et al. (2009) Faherty, J. K., Burgasser, A. J., Cruz, K. L., et al. 2009, AJ, 137, 1
- Faherty et al. (2012) Faherty, J. K., Burgasser, A. J., Walter, F. M., et al. 2012, ApJ, 752, 56
- Faherty et al. (2010) Faherty, J. K., Burgasser, A. J., West, A. A., et al. 2010, AJ, 139, 176
- Faherty et al. (2013) Faherty, J. K., Rice, E. L., Cruz, K. L., Mamajek, E. E., & Núñez, A. 2013, AJ, 145, 2
- Fan et al. (2000) Fan, X., Knapp, G. R., Strauss, M. A., et al. 2000, AJ, 119, 928
- Folkes et al. (2007) Folkes, S. L., Pinfield, D. J., Kendall, T. R., & Jones, H. R. A. 2007, MNRAS, 378, 901
- Geballe et al. (2002) Geballe, T. R., Knapp, G. R., Leggett, S. K., et al. 2002, ApJ, 564, 466
- Gelino et al. (2014) Gelino, C. R., Smart, R. L., Marocco, F., et al. 2014, AJ, 148, 6
- Gizis et al. (2012) Gizis, J. E., Faherty, J. K., Liu, M. C., et al. 2012, AJ, 144, 94
- Hambly et al. (2008) Hambly, N. C., Collins, R. S., Cross, N. J. G., et al. 2008, MNRAS, 384, 637
- Hawley et al. (2002) Hawley, S. L., Covey, K. R., Knapp, G. R., et al. 2002, AJ, 123, 3409
- Hewett et al. (2006) Hewett, P. C., Warren, S. J., Leggett, S. K., & Hodgkin, S. T. 2006, MNRAS, 367, 454
- Hodgkin et al. (2009) Hodgkin, S. T., Irwin, M. J., Hewett, P. C., & Warren, S. J. 2009, MNRAS, 394, 675
- Kirkpatrick (2005) Kirkpatrick, J. D. 2005, ARA&A, 43, 195
- Kirkpatrick et al. (2011) Kirkpatrick, J. D., Cushing, M. C., Gelino, C. R., et al. 2011, ApJS, 197, 19
- Kirkpatrick et al. (2012) Kirkpatrick, J. D., Gelino, C. R., Cushing, M. C., et al. 2012, ApJ, 753, 156
- Kirkpatrick et al. (2010) Kirkpatrick, J. D., Looper, D. L., Burgasser, A. J., et al. 2010, ApJS, 190, 100
- Kirkpatrick et al. (1999) Kirkpatrick, J. D., Reid, I. N., Liebert, J., et al. 1999, ApJ, 519, 802
- Knapp et al. (2004) Knapp, G. R., Leggett, S. K., Fan, X., et al. 2004, AJ, 127, 3553
- Lawrence et al. (2007) Lawrence, A., Warren, S. J., Almaini, O., et al. 2007, MNRAS, 379, 1599
- Leggett et al. (2007) Leggett, S. K., Saumon, D., Marley, M. S., et al. 2007, ApJ, 655, 1079
- Liu et al. (2006) Liu, M. C., Leggett, S. K., Golimowski, D. A., et al. 2006, ApJ, 647, 1393
- Liu et al. (2013) Liu, M. C., Magnier, E. A., Deacon, N. R., et al. 2013, ApJ, 777, L20
- Lodieu et al. (2012a) Lodieu, N., Burningham, B., Day-Jones, A., et al. 2012a, A&A, 548, A53
- Lodieu et al. (2012b) Lodieu, N., Espinoza Contreras, M., Zapatero Osorio, M. R., et al. 2012b, A&A, 542, A105
- Lodieu et al. (2010) Lodieu, N., Zapatero Osorio, M. R., Martín, E. L., Solano, E., & Aberasturi, M. 2010, ApJ, 708, L107
- Looper et al. (2008) Looper, D. L., Kirkpatrick, J. D., Cutri, R. M., et al. 2008, ApJ, 686, 528
- Luhman (2012) Luhman, K. L. 2012, ARA&A, 50, 65
- Mace et al. (2013) Mace, G. N., Kirkpatrick, J. D., Cushing, M. C., et al. 2013, ApJS, 205, 6
- Marocco et al. (2013) Marocco, F., Andrei, A. H., Smart, R. L., et al. 2013, AJ, 146, 161
- Martín et al. (1999) Martín, E. L., Delfosse, X., Basri, G., et al. 1999, AJ, 118, 2466
- Metchev et al. (2008) Metchev, S. A., Kirkpatrick, J. D., Berriman, G. B., & Looper, D. 2008, ApJ, 676, 1281
- Pinfield et al. (2008) Pinfield, D. J., Burningham, B., Tamura, M., et al. 2008, MNRAS, 390, 304
- Reid et al. (2008) Reid, I. N., Cruz, K. L., Kirkpatrick, J. D., et al. 2008, AJ, 136, 1290
- Reiners & Basri (2009) Reiners, A. & Basri, G. 2009, ApJ, 705, 1416
- Reylé et al. (2010) Reylé, C., Delorme, P., Willott, C. J., et al. 2010, A&A, 522, A112
- Schmidt et al. (2007) Schmidt, S. J., Cruz, K. L., Bongiorno, B. J., Liebert, J., & Reid, I. N. 2007, AJ, 133, 2258
- Schmidt et al. (2015) Schmidt, S. J., Hawley, S. L., West, A. A., et al. 2015, AJ, 149, 158
- Schmidt et al. (2010) Schmidt, S. J., West, A. A., Hawley, S. L., & Pineda, J. S. 2010, AJ, 139, 1808
- Schneider et al. (2002) Schneider, D. P., Knapp, G. R., Hawley, S. L., et al. 2002, AJ, 123, 458
- Scholz (2010) Scholz, R.-D. 2010, A&A, 515, A92
- Scholz et al. (2012) Scholz, R.-D., Bihain, G., Schnurr, O., & Storm, J. 2012, A&A, 541, A163
- Scholz et al. (2009) Scholz, R.-D., Storm, J., Knapp, G. R., & Zinnecker, H. 2009, A&A, 494, 949
- Seifahrt et al. (2010) Seifahrt, A., Reiners, A., Almaghrbi, K. A. M., & Basri, G. 2010, A&A, 512, A37
- Sivarani et al. (2009) Sivarani, T., Lépine, S., Kembhavi, A. K., & Gupchup, J. 2009, ApJ, 694, L140
- Skrzypek et al. (2015) Skrzypek, N., Warren, S. J., Faherty, J. K., et al. 2015, A&A, 574, A78
- Smith et al. (2014a) Smith, L., Lucas, P. W., Bunce, R., et al. 2014a, MNRAS, 443, 2327
- Smith et al. (2014b) Smith, L., Lucas, P. W., Burningham, B., et al. 2014b, MNRAS, 437, 3603
- Stauffer et al. (1998) Stauffer, J. R., Schultz, G., & Kirkpatrick, J. D. 1998, ApJ, 499, L199
- Testi (2009) Testi, L. 2009, A&A, 503, 639
- Vacca et al. (2003) Vacca, W. D., Cushing, M. C., & Rayner, J. T. 2003, PASP, 115, 389
- West et al. (2008) West, A. A., Hawley, S. L., Bochanski, J. J., et al. 2008, AJ, 135, 785
- West et al. (2011) West, A. A., Morgan, D. P., Bochanski, J. J., et al. 2011, AJ, 141, 97
- Wright et al. (2010) Wright, E. L., Eisenhardt, P. R. M., Mainzer, A. K., et al. 2010, AJ, 140, 1868
- York et al. (2000) York, D. G., Adelman, J., Anderson, Jr., J. E., et al. 2000, AJ, 120, 1579
- Zhang et al. (2013) Zhang, Z. H., Pinfield, D. J., Burningham, B., et al. 2013, in European Physical Journal Web of Conferences, Vol. 47, European Physical Journal Web of Conferences, 6007
- Zhang et al. (2010) Zhang, Z. H., Pinfield, D. J., Day-Jones, A. C., et al. 2010, MNRAS, 404, 1817