Escaping the trap of ’blocking’: a kinetic model linking economic development and political competition.
Abstract
In this paper we present a kinetic model with stochastic game-type interactions, analyzing the relationship between the level of political competition in a society and the degree of economic liberalization. The above issue regards the complex interactions between economy and institutional policies intended to introduce technological innovations in a society, where technological innovations are intended in a broad sense comprehending reforms critical to production [1]. A special focus is placed on the political replacement effect described in a macroscopic model by Acemoglu and Robinson (AR-model [3], henceforth), which can determine the phenomenon of innovation ’blocking’, possibly leading to economic backwardness. One of the goals of our modelization is to obtain a mesoscopic dynamical model whose macroscopic outputs are qualitatively comparable with stylized facts of the AR-model. A set of numerical solutions is presented showing the non monotonous relationship between economic liberization and political competition, which can be considered as an emergent phenomenon of the complex socio-economic interaction dynamic.
1 Introduction
Understanding the differences among the rates of industrialization and the introduction and spreading of technological innovation in different countries, possibly leading to economic backwardness in some of them, became a central issue in economic studies starting from the seminal essay by Gerschenkron [15]. In this context a particular focus has been applied on the role played by political elites, although the relationship between political and economic perspectives appears still controversial. An interesting hypothesis on the interplay between political perspectives and possibly economic backwardness has been proposed in some papers by Acemoglu and Robinson (see [3, 2] and references therein). Their model proposes as testing hypothesis a nonmonotonous relationship between the introduction of technological innovation by the incumbent ruler and the level of political competition in the society. This hypothesis has been statistically tested with positive results by two of the authors [17] using data on 102 countries over the period 1980 to 2005.
Our project consists in developing a model in the framework of the Kinetic Theory for Active Particles (KTAP) [8], which would allow to recover stylized facts of the model proposed by Acemoglu and Robinson although in a different mathematical setting and in dynamical conditions. In fact, the trap cited in our paper’s title refers to the fact that in the AR-model, when the incumbent rulers find it more convenient to block the introduction of new technologies in the society, the same will happen again and again in the future. Our intuitive idea is that our dynamical modelization of the same phenomenology may find conditions on the model parameters avoiding this kind of ’trap’.
More precisely, the paper analyses the interplay among the introduction of technological innovation by an incumbent ruler in a society leading to citizen income increment, the political support/opposition of the citizens and the political competition. We cluster the population into three groups (functional subsystems in KTAP), each population within a group being homogeneously distributed, i.e. no dependance on the space variable is assumed and the socio-political determinants of each group are represented by two socio-economic variables. The interactions are modeled using a stochastic game-type approach.
The contents of this paper refers also to a recent contribution regarding a kinetic model with a bivariate distribution and concerning the modeling of the interaction of welfare policy and support/opposition to governments [7], where it is shown that the interactions of two different dynamics can lead to radicalization of the opposition. A detailed analysis of the role of nonlinear interactions is proposed in [10], where it is shown how the overall wealth of a nation can be influenced by different models of social interactions.
The paper is organized as follows: in Sec. 2 we present the phenomenology of the system that we are going to model and that is based on a complex dynamic between economy and policy inspired by a model by Acemoglu and Robinson[3, 2]; in Sec. 3 we introduce the mathematical representation of a society partitioned into three interacting subsystems such that on each subsystem two different dynamics take place and without considering migration among the subsystems. Then, we introduce the specific case modeling the complex outcomes of the interacting phenomena of economic development and political policies among three specific groups of interest, individuated as ruler, citizens and a political competing group, focussing on the comparisons between the AR-model and the presented kinetic model. In Sec. 4 we present a set of numerical solutions in order to test AR-model hypothesis with the outcomes of the proposed kinetic model. Moreover, we propose other possible scenarios.
2 Analysing the role of political losers in strategies of economic development
2.1 Phenomenology description toward a modeling strategy
Political institutions have a direct influence on the economic development of a society, by means of general economic incentives and reforms. Technological innovation is here intended in a broad sense, as clarifyed by Acemoglu and Robinson: ”enforcement of property rights such as the creation of new legal institutions or the removal of regulations that prevent productive activities” [2]. As already remarked, an important issue regards the dynamics that possibly leads to the phenomenon of ’blocking’ of economic incentives and then to economic backwardness in the society. An hypothesis is that the blocking of technological development is more due to the fear of losing political power that to fear of losing economic rents and the major point in analyzing ’blocking’ is in this case the threat that innovation poses to the political power more than to economic rents [2]. On this path, Acemoglu and Robinson suggest that the greatest impediment to economic development comes not from groups whose economic interests are adversely affected by economic changes, but from elites whose political power is threatened; basically from political losers instead than from economic losers. Then, the effect of economic changes on political power is a key factor in determining whether technological advances and beneficial economic changes will be blocked by groups whose political power, more than economic rents, is eroded. This observation suggests to look more to the determinants of the distribution of political power in view of understanding the ’blocking’ conditions. The Austrian-Hungarian historical situation is taken as an example of the so called ’political replacement effect’ [3]; one may have a significant view of it in the book ’Der Mann ohne Eigenschaften’ (’The man without qualities’) by Musil [18]; moreover in Musil’s book we find discussions about the possibility of analyzing collective phenomena borrowing ideas from statistical mechanics.
In AR-model three groups are considered, characterized by different averaged quantities: the incumbent ruler, the citizens and a political competing group. Summarizing, the model focuses on the conditions determining the blocking of technological innovations, understood in a broad sense, by means of the ruler; the emerging behavior is represented by the political replacement effect, i.e. the innovation blocking by means of the political elites, determined by the fear to lose power. In the following we introduce the basic parameters of the AR-model.
2.2 Parameters of AR-model and ’blocking’ condition
AR-model is based on the observation that innovation induces ’turbulence’ which may erode the ruler’s power. The complex dynamics involving the introduction of technological innovation by an incumbent ruler and political competition is exploited making use of three parameters:
-
•
- inverse measure of the level of political competition in the society.
-
•
- quantifying the effect of the introduction of technological innovation by the ruler on the production.
-
•
- quantifying the ’erosion’ of the political power of the incumbent rulers due to the introduction of new technologies in the society.
The ’blocking’ condition is verified when the payoff of the ruler in the case in which they do not introduce innovations is bigger than the analogous value calculated when they innovate. The ’blocking’ condition is obtained in [3] as
| (1) |
with
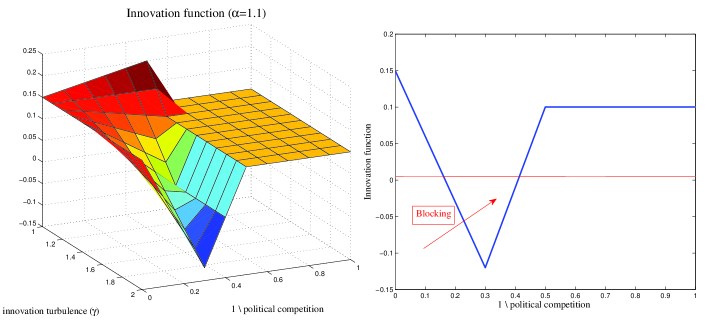
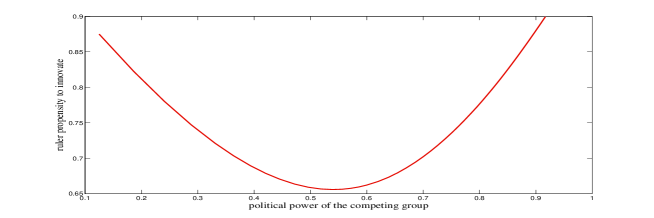
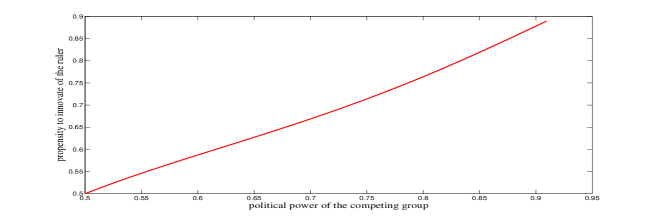
A central result is the nonmonotonous relationship between the propensity of the ruler to innovate and the political competition in the society, in a particular range of parameter values. In particular, the authors claim that the ruler may be induced to not innovate whenever the political competition in the society takes values in a medium range. For high or low values of political competition the ruler would always decide to innovate; this result will be quantified in the following. We define a function characterizing the introduction of technological innovations by the ruler, called innovation function:
| (2) |
with
| (3) |
i.e. it is a function depending on the political competition characterized by and the ’turbulence’ due to innovation ; moreover it is parametrized by . It is clear from (1) that the innovation ’blocking’ phenomenon appears in the range of values for the variables and the parameter, in which the innovation function is negative; in fact it is in this range of values that it is more convenient for the incumbent ruler to ’block’ the introduction of technological innovation with respect to introducing new technologies, comparing the respective payoffs. In the following we will discuss numerically some of these significative values.
2.3 Nonmonotonic relationship between innovation and political competition
In Fig. , the innovation function is plotted for . The ’blocking region’, defined as the domain of the variables such that , is underlined in Fig. plotting for a the same value of and for .
Moreover, we plotted the innovation function for (Fig.) and (Fig.) and the corresponding plots obtained fixing (Fig. and Fig., respectively).
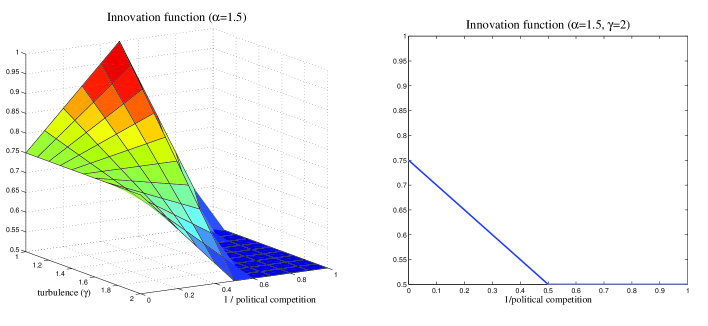

One observes that the blocking condition is verified only for values of near to 1; moreover when grows the innovation as function of the political competion loses its nonmonotonicity becoming linear, as one can observe from Fig. 3. In particular, corresponds to the minimal parameter value such that the innovation function doesn’t attain negative values and corresponds to the minimal parameter value such that the innovation function is linear in .
3 Representation of interacting groups of interest with multiple strategies
3.1 Mathematical structure in the KTAP framework
Following [4] we define some hallmarks as paradigms of our modelling approach:
-
•
The society is partitioned into functional subsystems, representing groups of interests.
-
•
In each functional subsystem individuals are called active particles and share a common strategy represented by an activity variable.
-
•
The activity variable is heterogeneously distributed within each functional subsystem attaining a range of values going from a ”worst” one to a ”best” one.
-
•
The state of each functional subsystem is described by a probability distribution on the activity variable.
-
•
An evolution equation for the probability distribution on each functional subsystem is obtained by a balance of particles in the elementary volume of the microstates, the inflows and outflows being related to the defined interactions.
-
•
We assume binary interactions between active particles belonging to the same fuctional subsystems as well as interactions of active particles with macroscopic quantities characterizing other functional subsystems, characterizing a stream effect.
-
•
Interactions are modeled as stochastic games in which the payoff is given in probability and are, in general, nonlinearly additive in the sense that they may depend on the probability distribution itself.
The microstate of each functional subsystem is characterized by a bivariate activity variable with two components
| (4) |
Both components attain a maximal value, so that they can be normalized with respect to their respective maximal value. The domain of the activity variable is where
A probability mass function is defined on the microstate for each functional subsystem
| (5) |
representing the number of active particles that at time express the strategy in the subsystem ; time has been normalized with respect to a maximal value assumed to exist. Moreover, it has been assumed that the number of active particles in each subsystem remains constant during the evolution, allowing to normalize the distribution with respect to it, so that the following property applies
The statistical moments of the probability mass function on each functional subsystem allow us to recover the macroscopic quantities (observables) related to each functional subsystem. The first-order moments related to the marginal probabilities on each functional subsystem are
| (6) |
| (7) |
.
The evolution equation for each functional subsystem is obtained by a balance between the inlet and the outlet of active particles in the elementary volume of the microstate,
| (8) |
with the initial condition , and ; moreover we used the notation . Interactions are modeled as game-type with stochastic payoffs that are specific for each application and determine the explicit expressions of the following two terms in each subsystem,
-
•
- accounting for the net flow of active particles due to binary interactions among active particles belonging to the same -th functional subsystem; it may depend on the probability mass function of the -th subsystem through its first moments.
-
•
- accounting for the net flow of active particles in the -th subsystem due to the influence of the the first moments of the -th subsystem.
In the following we will derive the explicit expressions for the above introduce flows.
3.2 Linking economic development and political perspectives
In consonance with the specific features of AR-model, let us consider a population of individuals subdivided into three functional subsystems: incumbent ruler, citizens and a political competing group, clustered according to specific strategies that they express in the analyzed competition. In particular, the ruler are characterized by their propensity to innovate where innovation has the meaning of introduction of technological innovation in a broad sense, as explained in the previous section. Moreover the ruler are characterized by their political power. The citizens express their wealth and their political opinion on the ruler. The competing group is characterized by their wealth and their political power.
One may summarize the dynamic that we are going to model as in the following. The propensity to innovate of the incumbent ruler is in a direct relationship with their political power (more political power, more propensity to innovate) and this propensity determines whether innovation is introduced or not in the society. Whenever innovation is introduced in the society, a positive increment in the citizens wealth may be probabilistically obtained as well as in the competing group wealth. Citizens political opinion is assumed to be driven only by their wealth and citizens opinion directly influences the political power of the rulers. Analogously, the political power of the competing group is assumed to depend only on their wealth and it has a negative return on the political power of the ruler. An intuitive graphical representation of this socio-economic system is given below, where the minus signs and the red colors represent symbolically negative returns.
![[Uncaptioned image]](/html/1602.08442/assets/x4.png)
To explictly model the phenomenology above sketched one has to introduce the transition probabilities, which characterize the probability that has a candidate particle to switch to a different value of activity variable due to interactions. Transition probabilities are of two types:
-
•
- modeling the probability for a candidate particle with microstate of the -th subsystem to change its second component of the activity variable due to an interaction with a field particle with microstate of the same subsystem.
Remark 1.
By encoding the phenomenology above described of the three interacting groups of interest, it is assumed that the first component of the activity variable of the candidate particle do not change due to binary interactions among active particles of the same subsystem.
-
•
- modeling the probability that has a candidate particle of the -th subsystem to change its first component of the activity variable due to the influence of the first-order moments of the -th subsystem ( with ).
Remark 2.
By encoding the phenomenology above described of the three interacting groups of interest, it is assumed that the second component of the activity variable of the candidate particle do not change due to the influence of subsystems different with respect to the one to which the particle belongs.
Each subsystem representing ruler, citizens and competing group respectively is indexed as explained in the following; moreover the activity variable for each of them and the interactions are modeled.
-
1.
Subsystem 1. Ruler
Microstate:
Interactions within the subsystem:
It is assumed that the propensity to innovate of the ruler is influenced by their political power. In particular, if the ruler have a high mean political power, their propensity to introduce innovation in the society may rise, in probability. The opposite is assumed if the ruler have a low mean political power.The above sketched phenomenology is encoded in the following transition probabilities which make use of uniform probability mass functions:
-
•
if
(9) -
•
if
(10) (in both cases above the transition probabilities are independent on the values of and ).
Influences of the other subsystems:
It is assumed that the political opinion of the citizens influences the political power of the ruler. In particular, if the citizens have an high mean political opinion, the politcal power of the ruler may rise, in probability. The opposite is assumed if the citizens have a low mean political opinion.The above sketched phenomenology is encoded in the following transition probabilities which make use of uniform probability mass functions:
-
•
if
(11) -
•
if
(12)
Actually, it is assumed that the political power of the competing group influences the political power of the ruler. In particular, if the competing group has a high mean political power, the political power of the ruler may decrease, in probability. If the competing group has a low mean political power, it is assumed that there is no influence on the political power of the citizens. The above sketched phenomenology is encoded in the following transition probabilities:
-
•
if
(13) -
•
if ,
(14)
In the above equations and hereafter represents the Kronecker delta.
-
•
-
2.
Subsystem 2. Citizens
Microstate:
Interactions within the subsystem:
It is assumed that the opinion dynamic of citizens is driven by economic motivations: when two active particles interact, if the wealth status of the candidate particle is below the one of the field particle, the candidate particle has a probability to acquire the opinion of the field one, following an imitation rule. If, on the contrary, the wealth status of the candidate particle is above or equal to the one of the field particle, the candidate one will not change his opinion. The following transition probabilities encodes the above described phenomenology:-
•
if ,
(15) -
•
if ,
(16) where is a parameter of the model.
Influences of the other subsystems:
We model the impact of the introduction of technological innovations on the citizen income by simply reasoning that if the ruler introduces technological innovation, the citizens may rise their wealth status. In particular, if the ruler an high mean propensity to innovate, the wealth of the citizens may rise, in probability. If the ruler have a low mean propensity to innovate, it is assumed that there is no influence on the wealth of the citizens. The above sketched phenomenology is encoded in the following transition probabilities:We model this effect by assuming that the ruler may have a positive return on the wealth of the citizens depending on the mean value of their propensity to innovate (). The transition probabilities encoding the above described phenomenology are the following,
-
•
if ,
(17) -
•
if ,
(18)
-
•
-
3.
Subsystem 3. Competing group
Microstate:
Interactions within the subsystem:
It is assumed that the political power of the competing group is influenced by their wealth. In particular, if the competing group has a high mean wealth, their political power may rise, in probability. The opposite is assumed if the competing group have a low mean wealth.The above sketched phenomenology is encoded in the following transition probabilities which make use of uniform probability mass functions:
-
•
if ,
(19) -
•
if ,
(20) (in both cases above the transition probabilities are independent on the values of and ).
Influence of the other subsystems:
We model the impact of the introduction of technological innovations on the competing group income too by simply reasoning, as in the case of the citizens, that if the ruler introduces technological innovation, the competing group may rise their wealth status, analogously to the case of the citizens. In particular, if the ruler a high mean propensity to innovate, the wealth of the competing group may rise, in probability. If the ruler have a low mean propensity to innovate, it is assumed that there is no influence on the wealth of the competing group. The above sketched phenomenology is encoded in the following transition probabilities:-
•
if
(21) -
•
if
(22)
-
•
In order to derive the explicit expressions for the flows of eq.(8) and then the kinetic model with stochastic game-type interactions, we need also to introduce the frequency of binary interactions of the candidate particle with the field particle (regarding the dynamic within each subsystem) or with first-order moments of other subsystems. The frequency of interactions are also called encounter rates; in particular:
-
•
- encounter rate within the -th subsystem, i.e. the frequency of interactions of the candidate particle with the field particle within the same subsystem (). We adopt a constant rate of interactions within each subsystem.
-
•
- encounter rate among the subsystems, i.e. the frequency of interactions of the candidate particle of the -th subsystem with the first order moments of the -th subsystem (). We adopt a constant rate of interactions between each couple of interacting functional subsystems.
We are ready now to derive the explicit forms of the flows of eq.(8) by balancing the inflow and the outflow of active particles in the elementary volume of the microstate:
| (23) |
| (24) |
for
Remark 3.
The parameter , quantifying the inverse of the political competition can be compared to the first moment with respect to the political power of the competing group, then it is given by .
Remark 4.
The parameter , quantifying the effect of the introduction of technological innovation in AR-model, can be compared to the present in eq.(17) which quantifies the effect of the introduction of technological innovation by the ruler on the wealth of citizens .
Remark 5.
The parameter of AR-model, quantifying the ’erosion’ of the political power of the incumbent ruler due to the introduction of new technologies in the society, can be compared to the parameter , which quantifies the effect of the political power of the competing group on the political power of the ruler.
4 Numerical solutions and critical analysis
In the numerical solutions the parameters of the transition probabilities take the values of Tab. 1.
| Parameter | Meaning | Value |
|---|---|---|
| scales the positive return on the citizen wealth | 0.1 | |
| citizen susceptibility to change opinion | 0.3 | |
| scales the negative return on the political power of the competing group | 0.9 |
All the encounter rates are settled as 1.
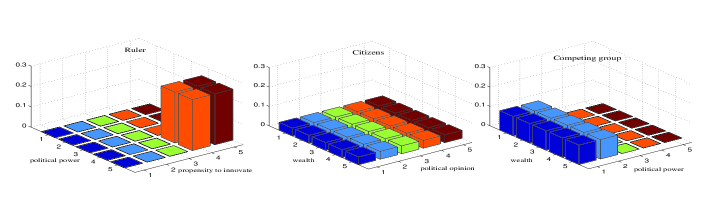
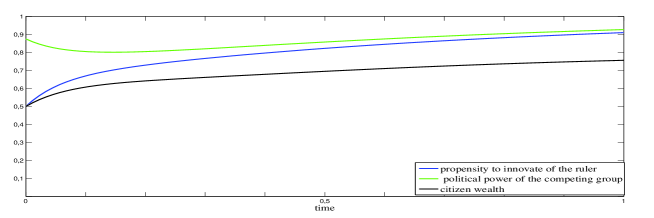
Case Study I - Strong ruler with weak political competing group: nonmonotonous relationship between political competion and propensity to innovate of the ruler.
We assume as initial condition a strong ruler Fig.(4 and a weak competing group Fig.(4, whilst the wealth and political opinion of the citizens are homogeneously distributed (4.
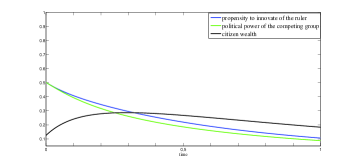
In Fig.(5) it is reported the evolution of the first order moments referred to the propensity to innovate of the ruler (blue), the political power of the competing group (green) and the citizen wealth (black).
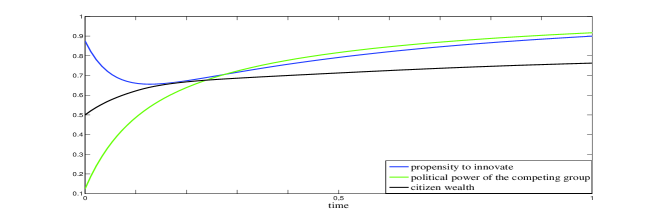
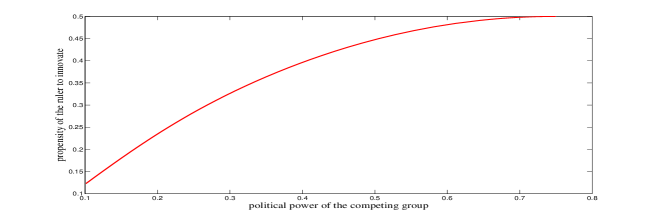
Fig.(6) shows the nonmonotonous relationship between the propensity to innovate of the ruler and the political power of the competing group.
The general observed trends are conserved also if one changes the initial distribution of wealth and political opinion of the citizens.
Case study II - Strong ruler with strong political opposition.
We show emergent behaviors when a ruler with strong political power acts in a society with a high level of political competition. The wealth and political opinion of the citizen are taken as homogeneously distributed; however the general trends are conserved as the initial distribution on the citizens changes.
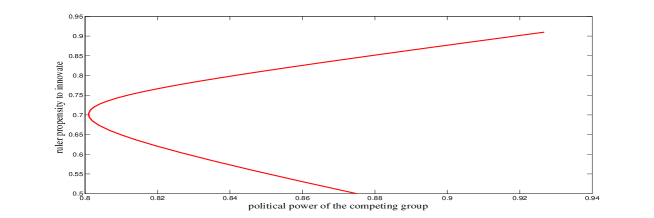
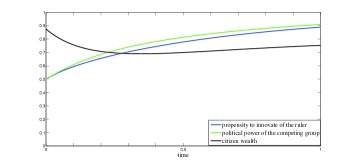
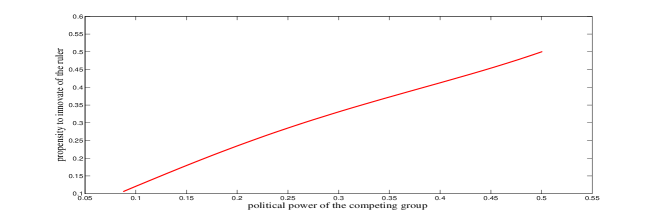
The tendency to introduce innovation of the ruler increases (Fig.7). When analysing the propensity to innovate of the ruler vs. the political power of the competing group it is observed that the propensity to innovate is always increasing whilst the political power of the competing group is decreasing in a first interval and then it is increasing. So there is a nonmonotonous relationship of the political power of the competing group vs. the propensity to innovate of the ruler.
The general observed trends are conserved also if one changes the initial distribution of wealth and political opinion of the citizens.
Case study III - Weak ruler with strong opposition.
We show emergent behaviors when a ruler with weak political power acts in a society with a strong level of political competition.
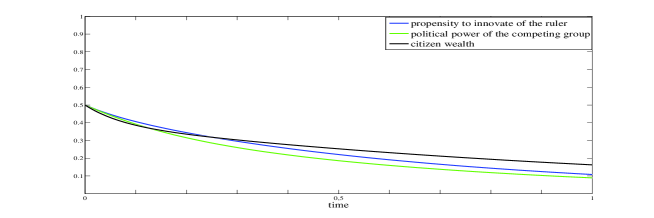
In this situation the tendency of the ruler to introduce innovation decreases (Fig.9) and the relationship between the propensity of the ruler to innovate and the political power of the competing group is monotonous (Fig.10).
The general observed trends are conserved also if one changes the initial distribution of wealth and political opinion of the citizens.
Case study IV - Balanced political power of the ruler and the competing group in a poor society and in a rich society.
In this case study we consider the case of a society with medium political power both for the ruler and the competing group. We show that the time evolution of the mean value of propensity to introduce innovation of the ruler and political power of the competing group are dependent on the initial distribution of citizen wealth.
One observes that when the political power of the ruler and that of the competing group are balanced, the propensity to innovate of the ruler tends to decrease in the case of a poor society (Fig.11 on the left) whilst it tends to increase in a wealthy society (Fig.11 on the right). In both cases a monotonous relationship between the propensity of the ruler to innovate and the political power of the competing group is observed (Fig.12 and Fig.13, respectively).
-
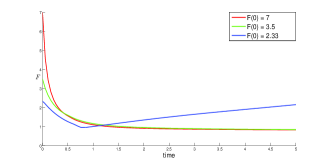
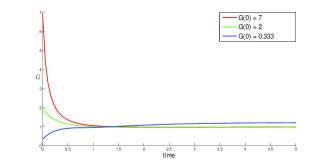
Case study V: Sensitivity to the initial conditions of the ratios between first order moments.
Let us finally consider the time evolution of the ratios between some of the first-order moments.
Let us define the following quantities:
and the propensity to innovate of the ruler and the political power of the competing group
with the scope to explore the sensitivity to the initial conditions for both cases.
Again, simulations are performed with parameters , and , and we seek for emergent behaviours while varying initial conditions. In particular, different values of and are obtained by initially clustering rulers and political opponents in different activity groups, while citizens are assumed to have a uniform initial distribution in all cases.
Results are shown in Fig. 14. We can see that even for opposite initial conditions, shows a trend to an asymptotic value near to , that is the propensity to innovate of the ruler tends to be equilibrated by the competing group’s political power. An analogous result is observed for , that compares both groups’ political power, that shows a trend to a value near to . These results show that when the ruler are politically weaker than the competing group, they are able to surpass it for some time but, after a while, their political power decreases again. This behaviour looks very interesting and a suitable explanation should be found.
5 Conclusions and perspectives
The differences in economic policies and political institutions is a central issue in political economy, tending to clarify the mechanics of cross-country income differences. Some evidences from the US can be found in [9]. Acemoglu and Robinson argued that the incumbent ruler is in power being selected as a good match for the actual ’environment’ but, due to the introduction of innovations, the environment changes decreasing the ruler’s advantage and inducing a mechanism that may led to ’blocking’ of the political reforms.
In the present paper we propose a kinetic model where interactions are modeled as stochastic games; three groups characterized by different strategies (ruler, citizens and a political competing group) evolve by rules internal within each group and, at the same time, being influenced by the dynamics and evolutions of the other groups. A set of numerical solutions is obtained in order to analyse the conditions determining the nonmonotonous relationship between the propensity of the ruler to innovate and the political competition of the society conjectured by AR-model.
An interesting development consists in considering an external action, which is a development of the basic AR-model in [3] and is represented by the effect of an external threat on the society. In [3] it is showed that the blocking region, resulting in a parameter range of values is, in that case, significatively reduced.
References
References
- [1] D. Acemoglu, Localised and biased technologies: Atkinson and Stiglitz’s new view, induced innovations and directed technological change, The Economic Journal, 125 (2015) 443-463.
- [2] D. Acemoglu, J. A. Robinson, Political losers as a barrier to economic development, American Economic Review, Papers and Proceedings, 90 (2000) 126–130.
- [3] D. Acemoglu, J. A. Robinson, Economic backwardness in political perspectives, American Political Science Review, 100 (2006) 115–131.
- [4] G. Ajmone Marsan, N. Bellomo, L. Gibelli, Stochastic evolving differential games toward a systems theory of behavioral social dynamics, Math. Models Methods Appl. Sci., to appear.
- [5] J. Banasiak, M. Lachowiz, Methods of small parameter in mathematical biology - Series Modeling and simulation in Science, Engineering and Technology (Birkhaeuser, 2014).
- [6] N. Bellomo, F. Colasuonno, D. Knopoff, J. Soler, From systems theory of sociology to modeling the onset and evolution of criminality, Networks and Heterogeneous Media 10 (2015) 421–441.
- [7] N. Bellomo, M. A. Herrero, A. Tosin, On the dynamics of social conflicts looking for the Black Swan, Kinet. Relat. Models 6 (2013) 459–479.
- [8] N. Bellomo, D. Knopoff, J. Soler, On the difficult interplay between life, ”complexity”, and mathematical sciences, Math. Models Methods Appl. Sci., 13 (2013) 1861–1913.
- [9] T. Besley, T. Persson, D.M. Sturm, Political Competition, Policy and Growth: Theory and Evidence from the US, Review of Economic Studies 77 (2010) 1329-1352.
- [10] M. Dolfin, M. Lachowicz, Modeling altruism and selfishness in welfare dynamics: the role of nonlinear interactions, Math. Models Methods Appl. Sci. 24 (2014) 2361-2381.
- [11] M.Dolfin, M. Lachowicz, Modeling opinion dynamics: how the network enhances consensus, Networks and Heterogeneous Media 10 (2015), 877-896..
- [12] B. During, D. Matthes and G. Toscani, Kinetic equations modelling welath redistributio: a comparison of approaches, Phys. Rev. E 78 (2008).
- [13] B. During, D. Matthes and G. Toscani, A Boltzmann-type approach to the formation of wealth distribution curves, (Notes of the Porto Ercole School, June 2008), Riv. Mat. Univ. Parma 8 (2009) 199-261.
- [14] B. During and G. Toscani, International and domestic trading and wealth distribution, Commun. Math. Sci. 6 (2008) 1043-1058.
- [15] A. Gerschenkron, Economic backwardness in historical perspectives, Cambridge, Harvard University Press (1962).
- [16] D. Knopoff, On a mathematical theory of complex systems on networks with application to opinion formation, Math. Models Methods Appl. Sci. 24 (2014) 405-426.
- [17] L. Leonida, D. Maimone Ansaldo Patti, P. Navarra, The political replacement effect: a Panel Data Analysis, Oxford Bulletin of Economics and Statistics 75 (2013) 785-805.
- [18] R. Musil, Der Mann ohne Eigenschaften, Rowohkt Verlag, Austria (1930-1943).
- [19] L. Pareschi, G. Toscani, Self-similarity and power-like tails in non-conservative kinetic models, J. Stat. Phys., 124 (2006) 747-779.
- [20] L. Pareschi, G. Toscani, Interacting Multiagent Systems: Kinetic Equations and Monte Carlo Methods, Oxford University Press, Oxford (2014).
- [21] N. N. Taleb, The Black Swan: The Impact of the Highly Improbable, Random House, New York City (2007).
- [22] G. Toscani, Wealth redistribution in conservative linear kinetic models with taxation, Europhysics Letters 88 (2009) 10007.