Tuning the magnetocrystalline anisotropy in CoPO by means of substitution: a ferromagnetic resonance study.
Abstract
We report on broad-band electron spin resonance measurements performed within the itinerant ferromagnetic phase of CoPO ( = La, Pr, Nd and Sm). We reveal that the substitution is highly effective in gradually introducing a sizeable easy-plane magnetocrystalline anisotropy within the Co sublattice. We explain our results in terms of a subtle interplay of structural effects and of indirect interactions between the and orbitals from and Co, respectively.
pacs:
75.50.Cc, 76.30.-v, 76.50.+gI Introduction
The interest for O oxides (, and being rare-earth, transition metal and pnictide ions, respectively) has arisen dramatically after the recent discovery of high- SC (superconductivity) in this class of layered materials.Kam06 ; Kam08 ; Ren08 The prototype FeAsO1-xFx systems reach remarkable values higher than K,Ren08 ; Pra12 ; Mar16 while lower ’s are typically achieved for the different compositions Fe1-xCoxAsO.Sef08 ; Wan09 ; Awa10 ; Mar10 ; Qi11 ; Sha13 ; Pra13b ; Mar16 Both the O1-xFx and the Fe1-xCox dilutions nominally introduce one extra-electron per substituted ion (however, see Refs. Wad10, and Ber12, ) leading to SC for values .Mar16 Still, it is very interesting to consider how the electronic ground state evolves in the opposite limit , where SC is completely suppressed. An itinerant FM (ferromagnetic) phase is achieved in CoAsO and CoPO, with an ordered magnetic moment per Co ion in saturation strongly suppressed if compared to its value in the paramagnetic regime.Yan08 While itinerant ferromagnetism can be predicted for these materials by means of ab-initio computations,Yan08 ; Xu08 a detailed investigation of their properties can possibly lead to interesting insights also in the superconducting state in view of the closeness of these two ground states in the phase diagram.
In particular, this is the case for the impact of different ions on the whole electronic properties of the systems. Previously,Pra13 ; Pra15 we showed by means of SR (muon spin spectroscopy) that the electronic degrees of freedom associated with ions do not play an active role in CoPO but, on the contrary, ions should be thought as “passive” sources of chemical pressure which ultimately tune , i. e., the FM transition temperature.Pra13 ; Pra15 As further confirmation of the crucial importance of structural effects, we also demonstrated the full equivalence of chemical and external pressures on a quantitative level as long as is considered.Pra13 ; Pra15 These results can be interesting in view of the analogy with superconducting samples and, in particular, with the strong dependence of the value on the actual ion at optimal doping.Pra12 ; Miy13 It should be stressed that we could not demonstrate a full analogy between chemical and external pressures for superconducting samples, as here quenched disorder contributes in a complicated and non-negligible way as well.Pra15b
In this paper we report on ESR (electron spin resonance) measurements performed in the FM phase of CoPO ( = La, Pr, Nd and Sm). We analyse the ESR signal in a wide range of temperature (), magnetic field () and frequency of the employed microwave electromagnetic radiation (). We observe for all the samples a clear crossover from a high- paramagnetic region, where the ESR line shows a Dysonian distortion, to a low- region, where the ESR line arises instead from the macroscopic magnetization of the whole sample (FMR, ferromagnetic resonance). Remarkably, within the FM phase, we unambiguously detect the gradual development of a sizeable easy-plane magnetocrystalline anisotropy upon increasing chemical pressure. We discuss our experimental results in the light both of the distortion of the local tetrahedral crystalline surroundings of Co ions and of the anisotropic properties introduced by the strong indirect interaction between and electronic degrees of freedom from and Co orbitals, respectively.
II Experimental Details
II.1 Samples’ characterization
We reported details about the synthesis of polycrystalline CoPO ( = La, Pr, Nd, Sm) in our previous publications, together with thorough investigations of the considered samples by means of dc magnetometry and ZF (zero-field) SR under pressure.Pra13 ; Pra15 In this paper we discuss ESR measurements performed on the same samples already studied by means of the other techniques mentioned above. In the whole text, we refer to ground powders composed to a first approximation of spherical grains with similar dimensions for all the samples. The powders were embedded in Double Bubble 2-part epoxy (Loctite) for the aim of avoiding sample movement and grain re-orientation triggered by , i. e., preserving constant powder-average properties of the ESR signal for all the accessed experimental conditions.
We measured (macroscopic magnetization) for the four samples as a function of at fixed sample-dependent values of by means of a Magnetic Property Measurement System based on a superconducting quantum interference device (by Quantum Design).
II.2 Electron spin resonance
We performed continuous wave ESR measurements at fixed while sweeping . For this aim, we employed two different experimental configurations.
II.2.1 X-band regime
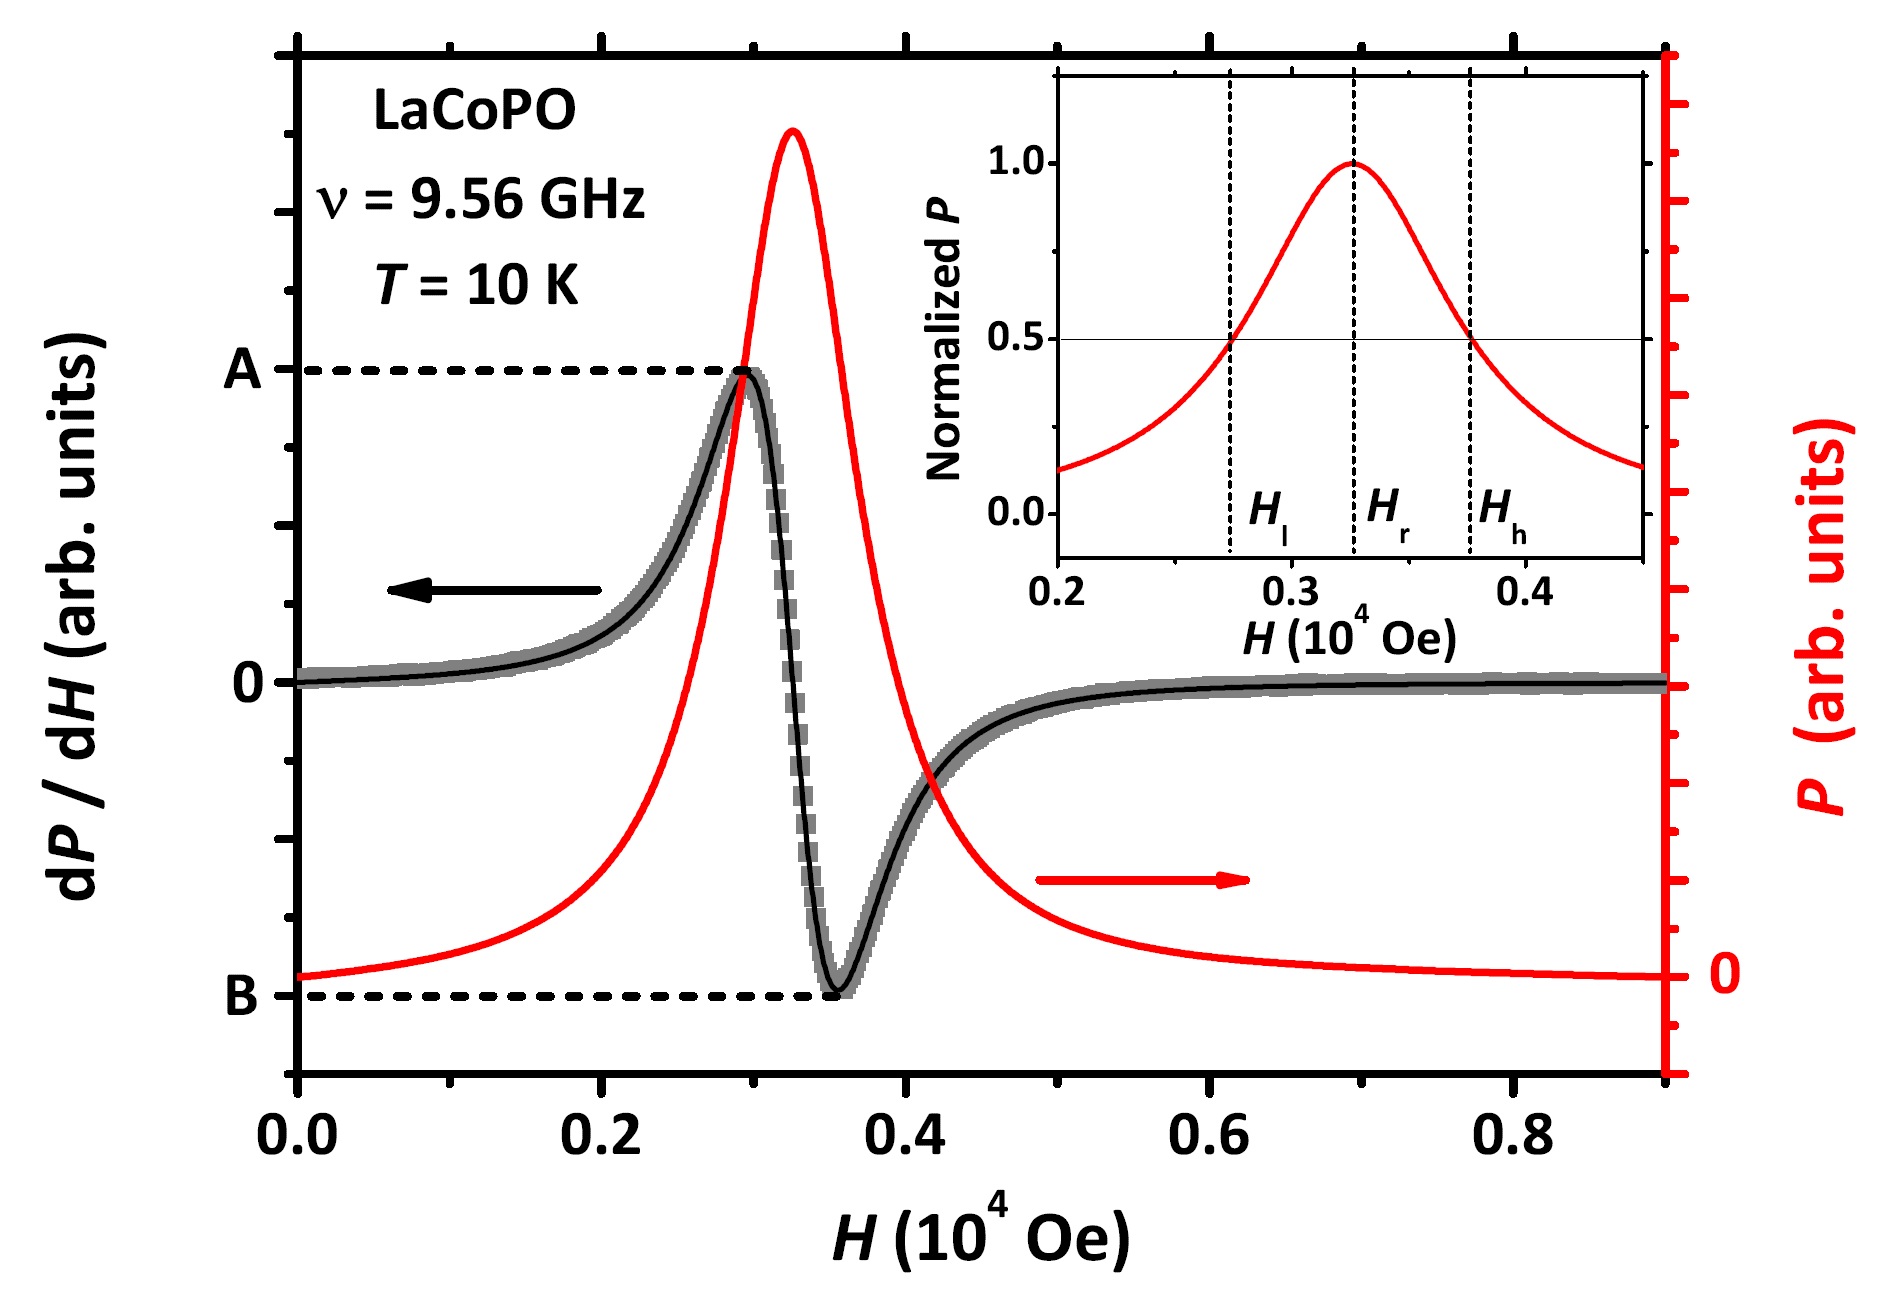
We accessed the low-frequency regime ( GHz) by means of a commercial Bruker EMX X-band spectrometer equipped with an Oxford Instruments ESR900 continuous 4He flow cryostat ( K). Measurements were always performed upon gradually warming the sample from the lowest accessed value after a zero-field cooling protocol. Standing electromagnetic microwaves were induced in a rectangular cavity (Bruker X-band resonator ER4104OR, TE102 mode). The sample was placed in the cavity’s centre where the component is maximum and we measured the (power) resonantly absorbed by it as a function of . Here, the quasi-static component was in the range kOe and it was swept with a typical rate Oe/s. Simultaneously, the (time) dependent field ( Oe) was sinusoidally-modulated with frequency kHz and superimposed to . By means of a lock-in detection at the modulation frequency, we directly measured the first derivative d/d rather than (see Fig. 1 for a representative experimental curve).
We fitted the d/d data by means of the expression
where the coefficients and allow for a small linear background while
| (2) | |||||
and
| (3) | |||||
are the absorptive (Abs) and dispersive (Disp) components of the employed Lorentzian model (hence the subscript L) weighted by the parameter .Poo83 ; Kat01 ; Kru02 ; Gug12 Here, is the signal amplitude and the resonance field, while for the linewidth the relation holds with representing the FWHM (full width at half maximum). Eqs. (2) and (3) already incorporate the contribution from negative magnetic fields arising from the linear polarization of the electromagnetic radiation in the cavity.Kru02 ; Jos04 This correction is mostly relevant for broad ESR lines, namely whenever .
The choice of Eqs. (II.2.1), (2) and (3) gives excellent fitting results in LaCoPO at all values, except for a narrow region around the onset of the long-range ordered FM phase where the signal is slightly distorted. Similar distortion effects around the ordering temperatures of magnetic phases have been reported before for other materials.She96 For high values, fits by Eqs. (II.2.1), (2) and (3) still yield to excellent results also in the case of PrCoPO, NdCoPO and SmCoPO (see in Sect. III). However the situation for these materials is different in the whole low- FM regime, where the signal is always so distorted that it can not be fitted properly. For this reason, we took an alternative empirical approach to data analysis. In particular, we numerically-integrated the d/d data to give the actual behaviour, from which we extracted important quantities such as
| (4) |
namely the integrated intensity of the ESR signal at fixed , and the characteristic field values (resonance field), and (half-height fields) defined as shown in the inset of Fig. 1. Accordingly, we defined the FWHM as and introduced the empirical parameter
| (5) |
to quantify the half-width asymmetry of the ESR line. In particular, corresponds to a symmetric line with respect to , while is found when experimental lines are broadened on the high-fields side.
As is well-known, an asymmetry () of the ESR line may have different physical origins. One possibility is the so-called Dysonian distortion typical of metallic samples.Bar81 Here, the impinging electromagnetic radiation is mostly screened and it penetrates the material over the skin-depth .Jac99 Accordingly, the resonance process only takes place in the non-screened fraction of the sample, namely within . The resonance signal may arise both from localized magnetic moments interspersed in the metallic background and from conduction electrons themselves. In the latter case, two main characteristic times govern the resonance process, i. e., the intrinsic transverse relaxation time of electrons and the so-called diffusion time .Bar81 Here, is the length-scale of interest for the electron diffusion while represents a constant characteristic of the process. When the electron diffusion can be neglected, i. e., when
| (6) |
the absorbed can be conventionally expressed in terms of the sample impedance. In the ideal case of metallic spherical grains with diameter , the condition implies (bulk-impedance limit) while holds with in the opposite limit (surface-impedance limit), with () the real (imaginary) component of the magnetic susceptibility.Bar81 When a conventional Lorentzian relaxation process is being considered, the former condition implies for the ratio of the two quantities defined in the main panel of Fig. 1, while the latter condition typically results in and, accordingly, in a broadening of on the high-fields side.Bar81 ; Tay75a
On the other hand, anisotropic magnetic properties generally cause an inhomogeneous broadening of magnetic resonance lines for randomly-oriented powders as well.Sli90 It should be recalled that only the anisotropy-based distortion would still be detected in case the experimental apparatus allowed one to independently measure and . While this is not feasible with our X-band instrumentation, we could successfully disentangle the two signals by means of a different setup, as discussed below.
II.2.2 High-frequency/high-field regime
We performed ESR measurements at higher and at selected values by means of a home-made spectrometer based on a PNA network analyser N5227A (Keysight Technologies), generating and detecting microwaves with broad-band tunable frequency MHz GHz. We extended the upper limit to GHz by means of complementary millimiter-wave modules (Virginia Diodes, Inc.). We also accessed the GHz GHz regime by means of a home-made spectrometer based on a MVNA vector network analyser (AB Millimetre). We performed measurements at selected values in a transmission-configurationGol06 by exploiting gold-plated copper mirrors, German silver waveguides and brass concentrators to properly focus the radiation on the sample. We could generate quasi-static values up to kOe (with a typical ramping rate Oe/s) by means of a superconducting solenoid (Oxford Instruments) equipped with a 4He variable temperature insert.
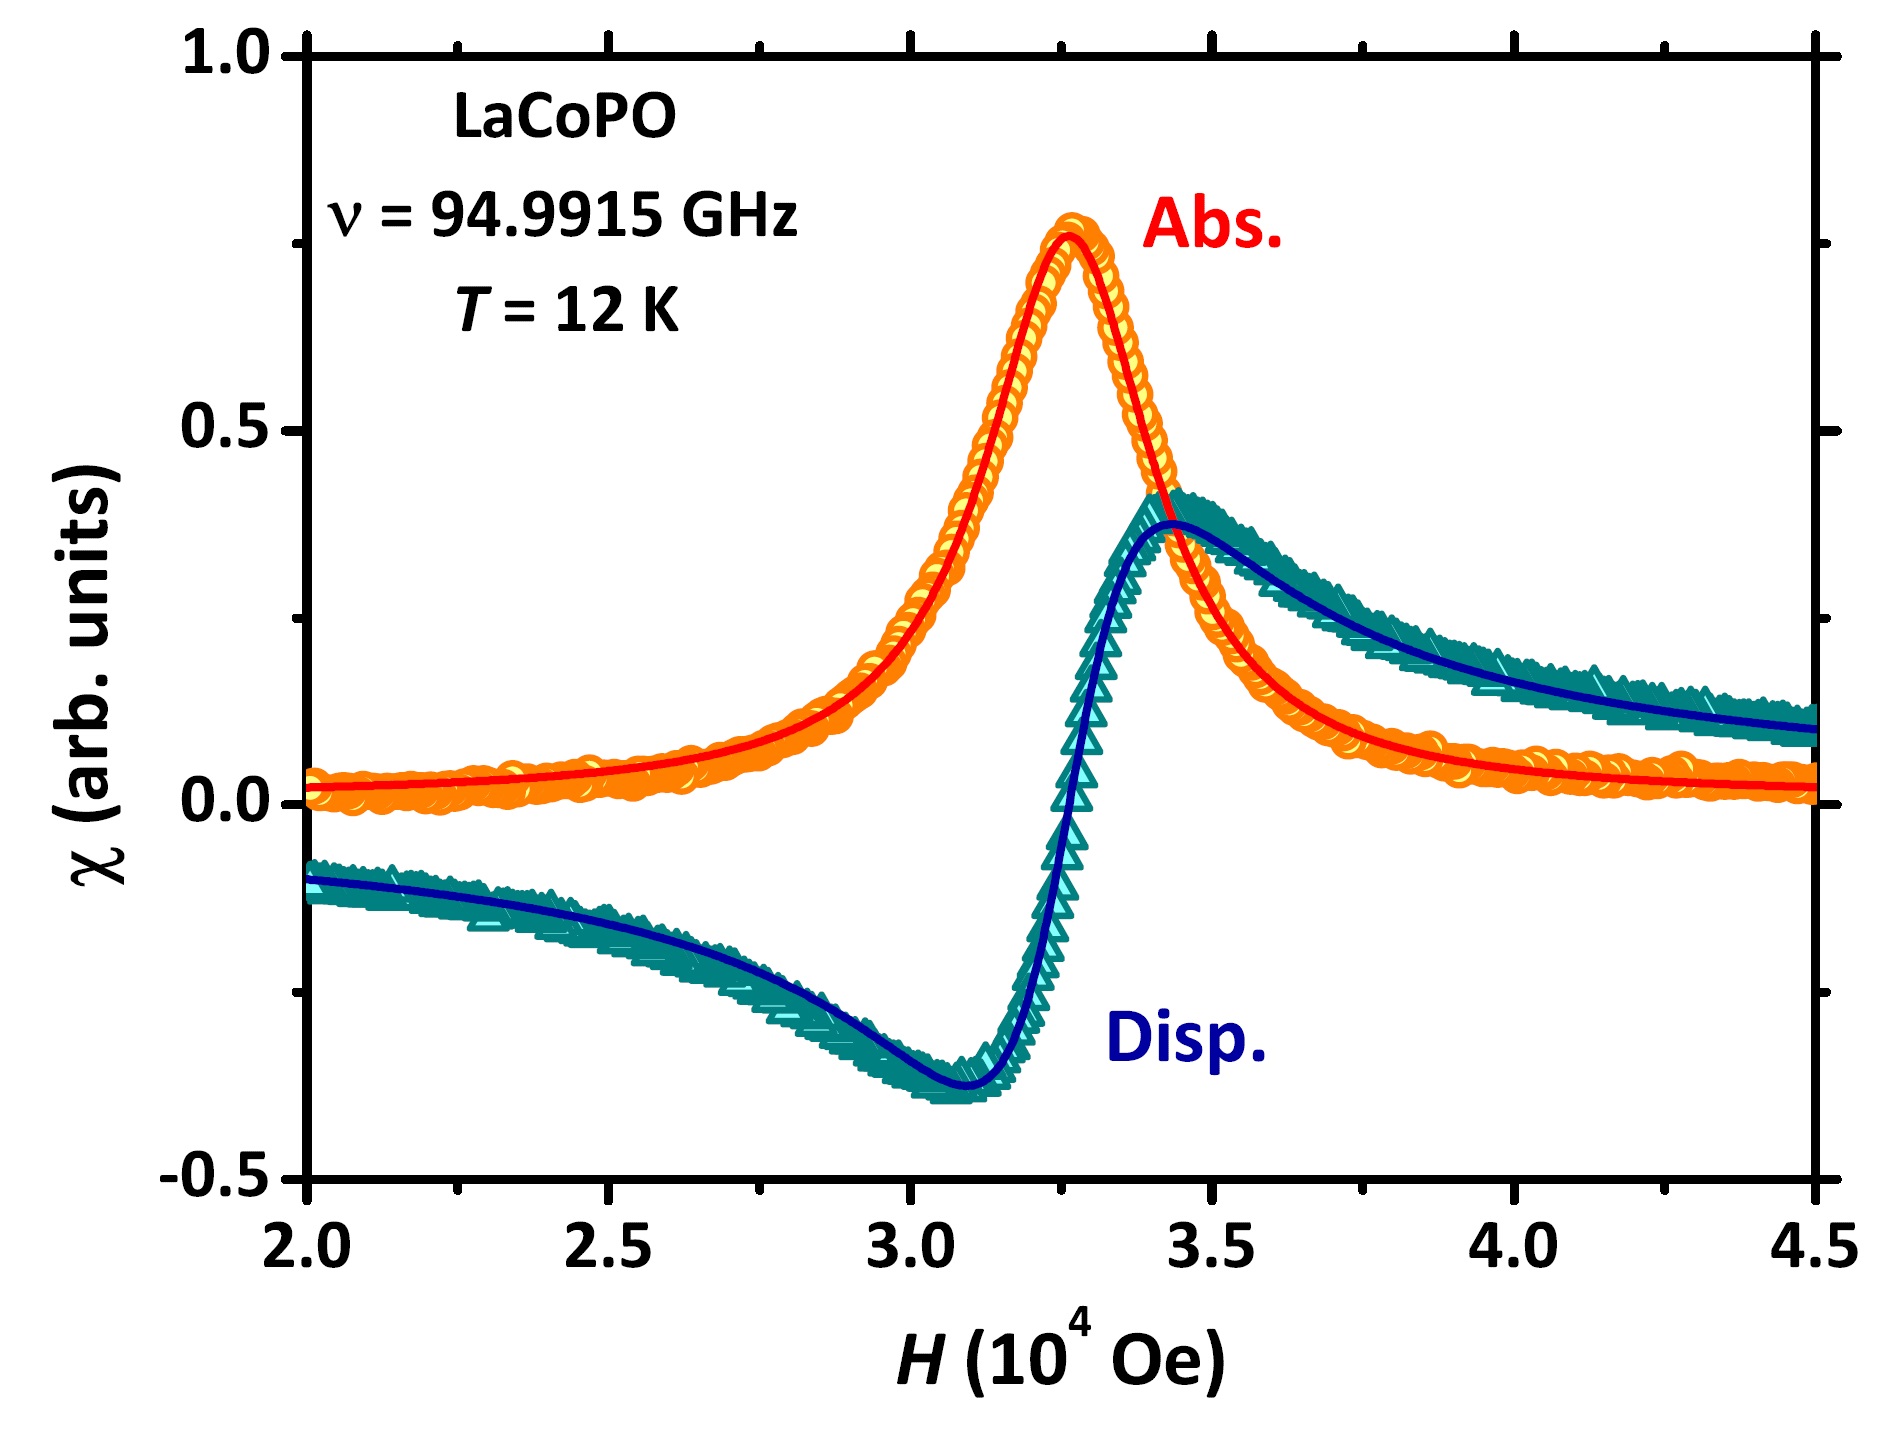
This experimental setup allowed us to directly measure the complex impedance of the whole system (sample and waveguides) and to associate anomalies induced by to the resonant absorption in the sample. Differently from the X-band setup, the network analyser allowed us to disentangle real and imaginary components of the signal, i. e., dispersive and absorptive components of the sample’s uniform magnetic susceptibility (see Fig. 2 for a representative experimental curve). After a proper background-subtraction and phase-correction, we defined , and from the absorptive component, analogously to the case of X-band (see the inset of Fig. 1).
III Results
III.1 Summary of the main magnetic properties of CoPO
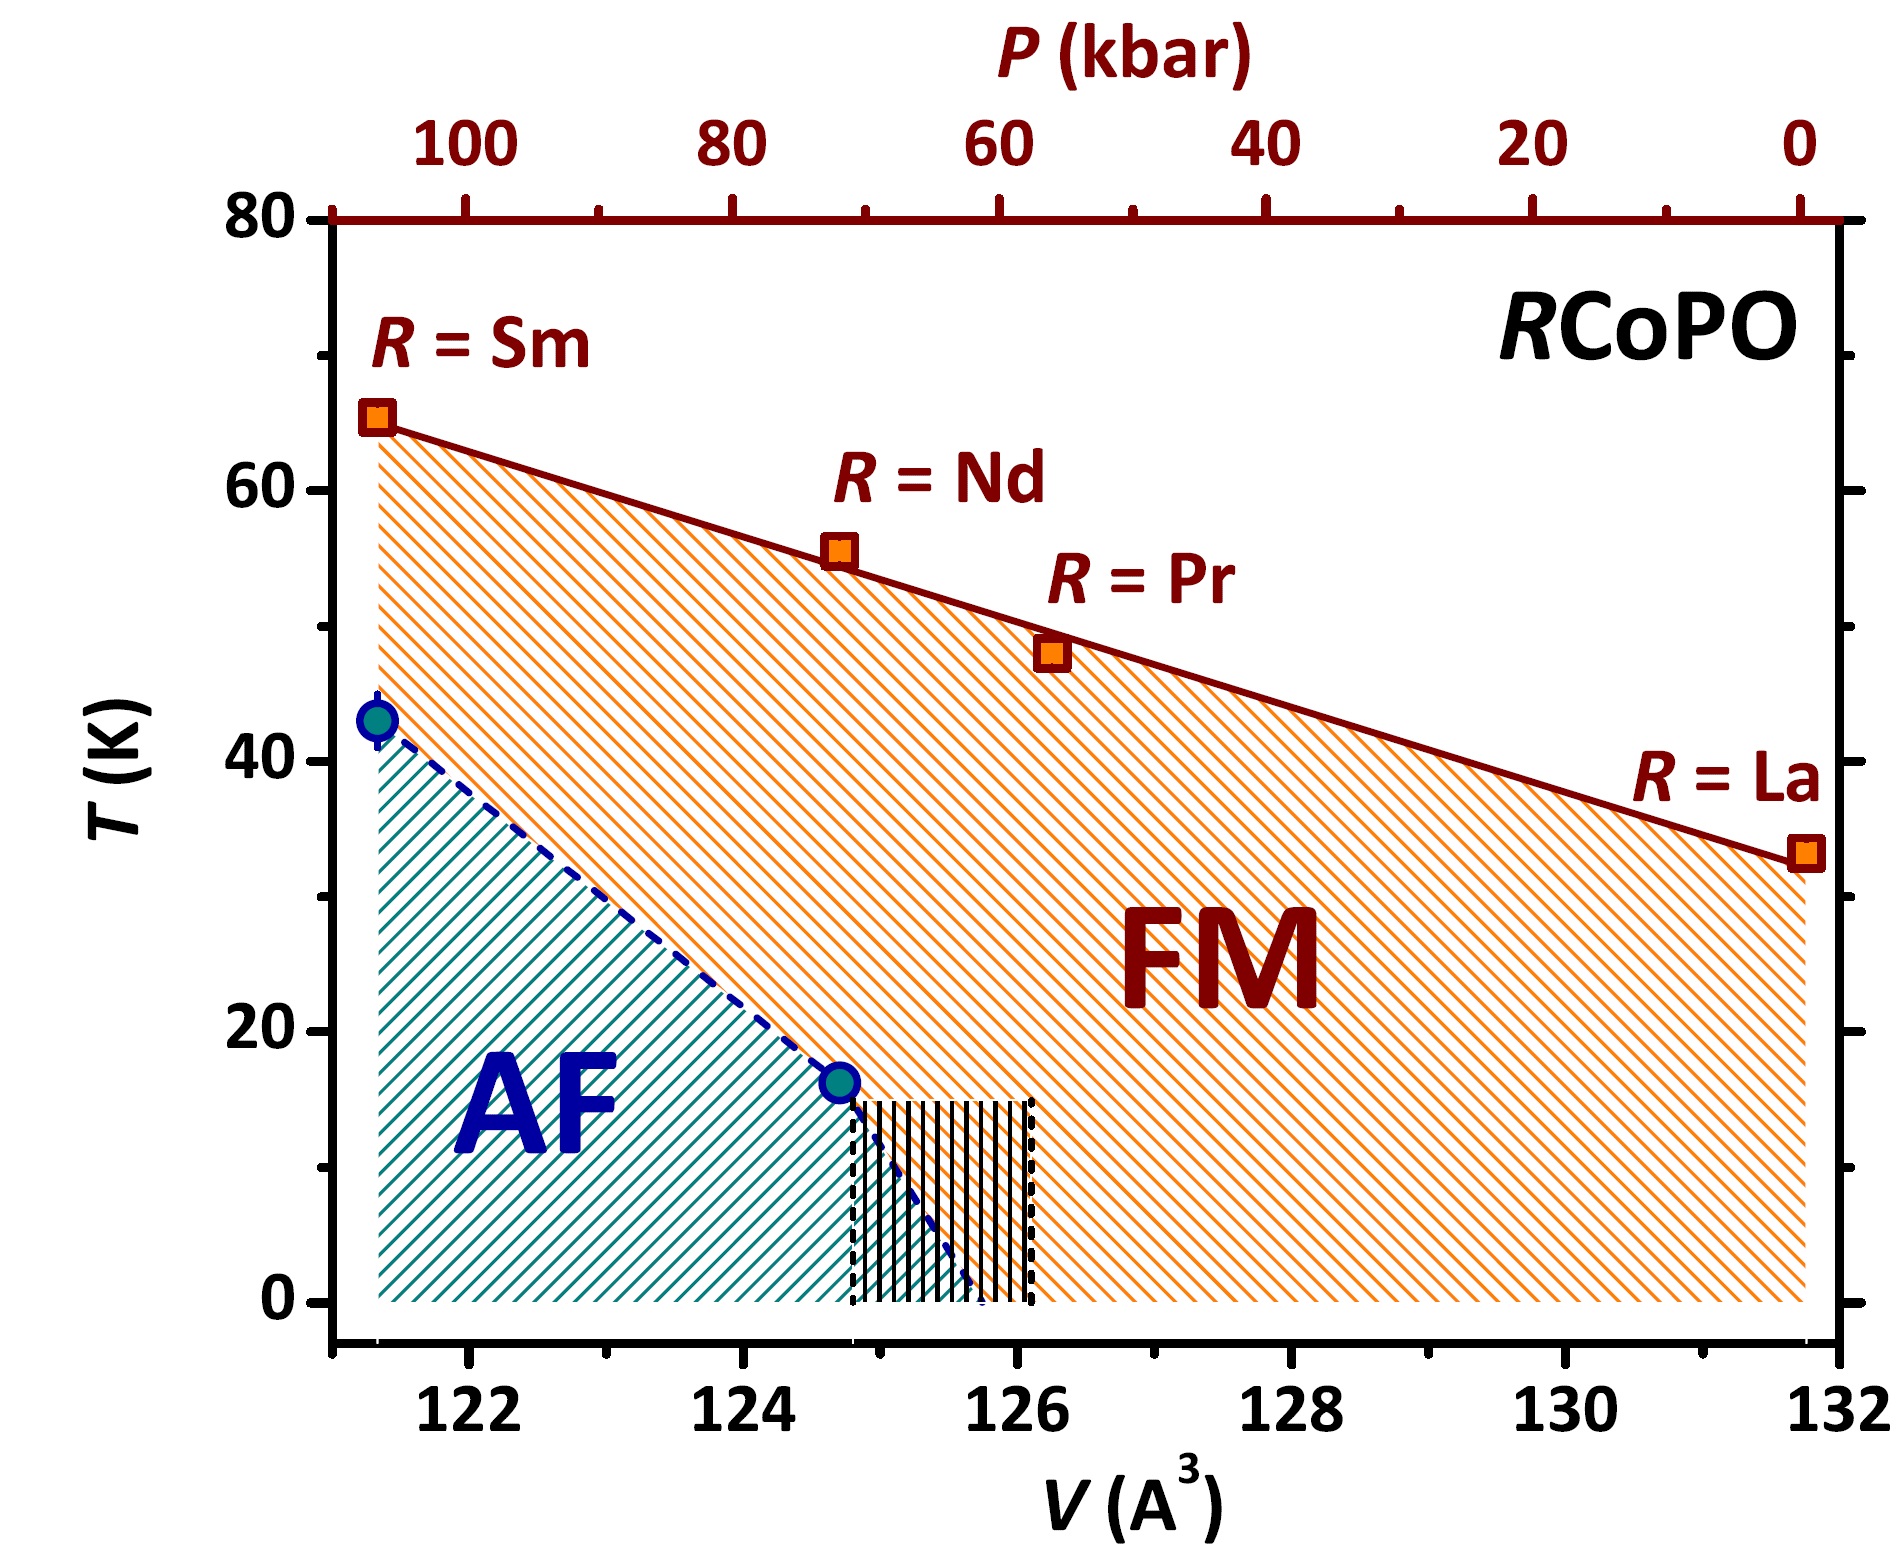
CoPO materials display a metallic behaviour for the dependence of the electrical resistivity (typical values m cm) with negligible qualitative and quantitative dependences on the actual ion.Yan08 ; Pal11 They exhibit interesting magnetic properties with the appearance of an itinerant FM phase below a characteristic critical temperature . This FM state is understood in terms of a conventional Stoner criterion after computing (density of states at the Fermi energy) which, as a result, is mainly of character and arising from Co orbitals.Yan08 ; Pra15 In a simple covalent picture, the valency of Co ions is and the measured value for the ordered magnetic moment per Co ion is for LaCoPO. This value slightly decreases with decreasing (ionic radius of the ion) or, equivalently, the equilibrium unit cell volume – see later on in Tab. 1. While density functional theory calculations are able to reproduce this trend, the absolute values typically overestimate the experimental ones by a factor .Yan08 ; Pra15 This is highly reminiscent of what is observed for the isostructural oxides based on Fe, as associated to the difficulties in describing these materials only from a fully-itinerant or a fully-localized perspective.Maz08 ; Han10 ; Yin11 ; DeM15 We observed a linear relation for the vs. trend and, as already discussed based on ZF-SR measurements, we quantitatively verified this dependence also with further decreasing by means of hydrostatic pressure, pointing to a one-to-one correspondence between chemical and external pressures in these materials (see Fig. 3).Pra13 ; Pra15 According to this picture, the active role of ions is limited to the generation of chemical pressure as long as the itinerant FM phase is concerned. Otherwise said, the electronic degrees of freedom localized on the ions do not influence significantly.
Upon gradually increasing the chemical pressure, a second magnetic phase appears at lower values, below the critical temperature . Here, the Co sublattice enters an AF (antiferromagnetic) phase, as marked by the sudden vanishing of the macroscopic magnetization and by clear modifications in the vs. hysteresis curves.Pra15 ; Pal11 The AF phase is observed in NdCoPO and SmCoPO but not in LaCoPO and PrCoPO. Since the localized magnetic moments on Pr3+ and Nd3+ ions are comparable,Ash76 this observation provides further evidence for the ineffectiveness of electronic degrees of freedom in driving the overall magnetic properties of CoPO. Once in the AF state, we observed a gradual orientation of the Nd3+ and Sm3+ magnetic moments, giving rise to a peculiar dependence of the internal magnetic field at the site.Pra15
III.2 ESR. Low-frequency regime (X-Band)
With decreasing and for all the investigated compounds, the onset for the detection of a well-defined ESR signal is K, i. e., well above the values estimated in zero magnetic field by means of SR.
III.2.1 Signal intensity
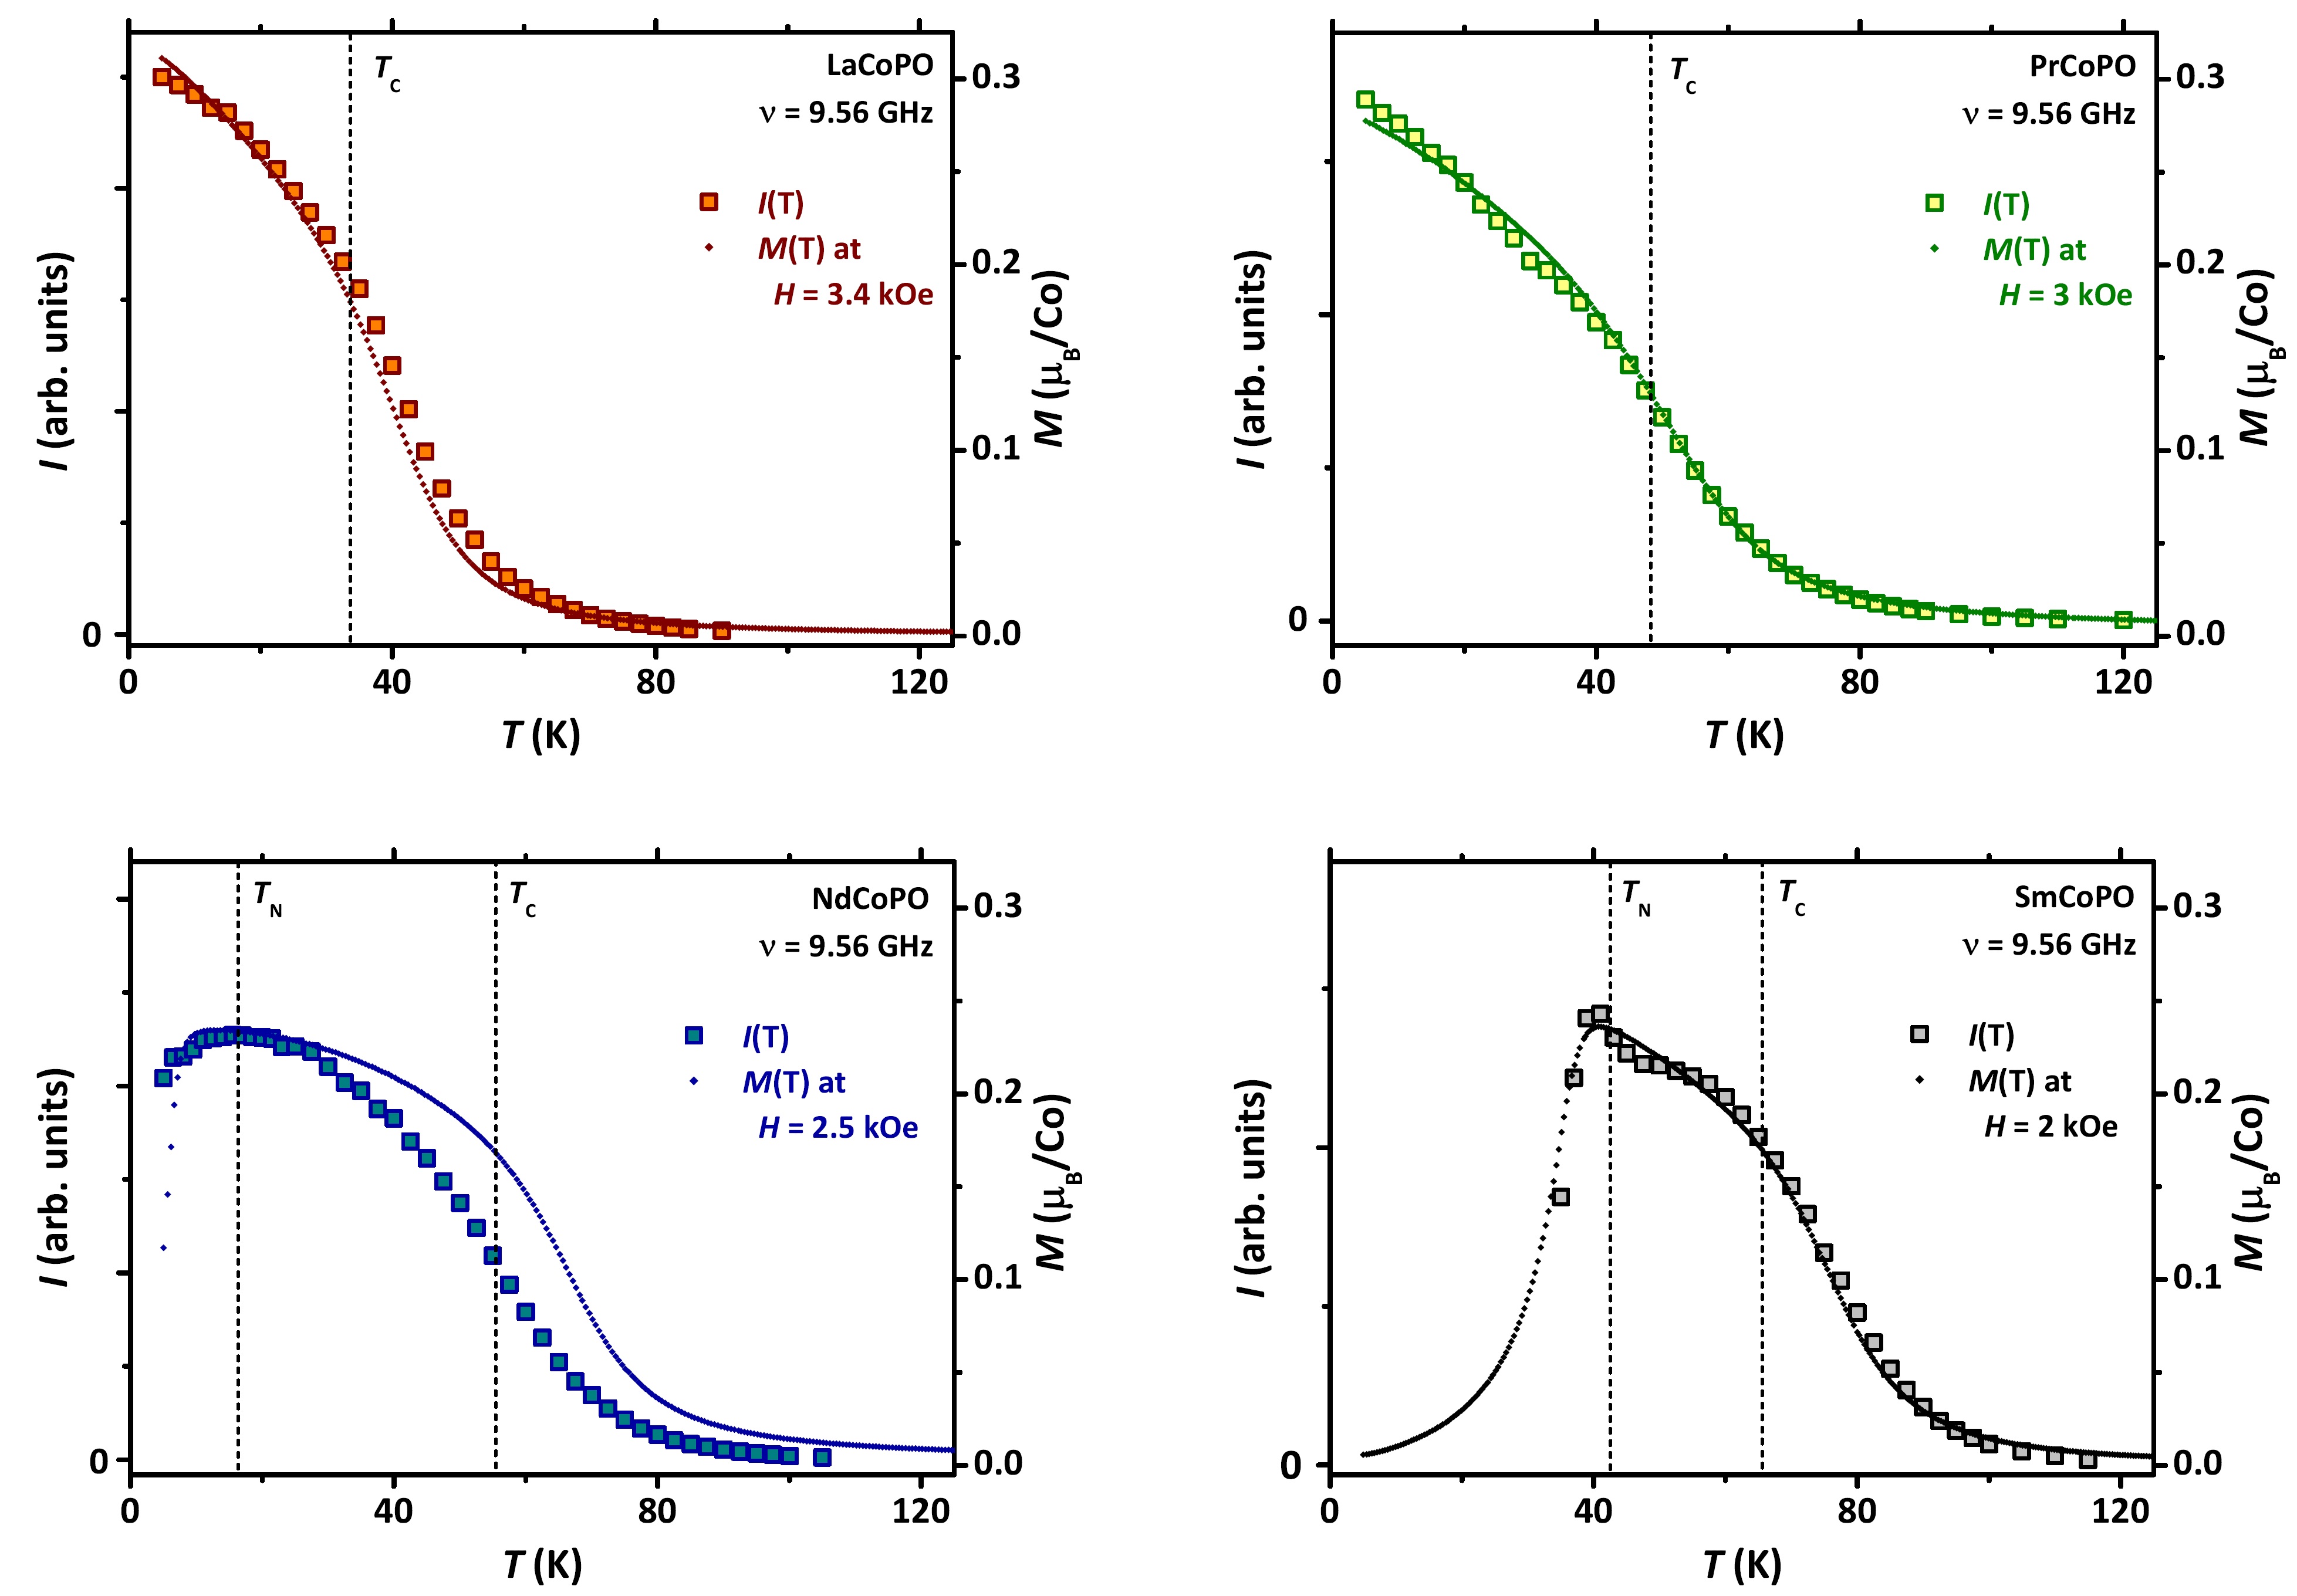
We show the behaviour of the integrated intensity for the four samples in comparison to in Fig. 4. We measured the latter quantity at sample-dependent values comparable to those of the central resonance field (see later on). The good agreement between and is an indication that the ESR signal is indeed intrinsic for every sample and not associated to, e. g., extrinsic magnetic impurities. In particular, we notice that is monotonously increasing with decreasing in LaCoPO and PrCoPO. On the other hand, both and go through a maximum at around K and K for NdCoPO and SmCoPO (respectively), i. e., in correspondence to the values detected by ZF-SR. The fast suppression of in the AF phase for NdCoPO and, in particular, for SmCoPO is a clear indication that ESR is actually probing the signal associated to the FM phase. For this reason, we will refer to FMRKit48 ; Von66 rather than ESR from now on. Moreover, in view of the general arguments discussed above about CoPO and after considering the fact that Co2+ is the only source of magnetism in LaCoPO, we are confident to assign the observed signal to Co electrons for all samples. We notice that a quantum mechanical treatment of the Co2+ ion in a tetrahedral crystalline environment (strong-ligand-field approach) would lead to an orbital singlet () associated with the upper triplet.Abr70
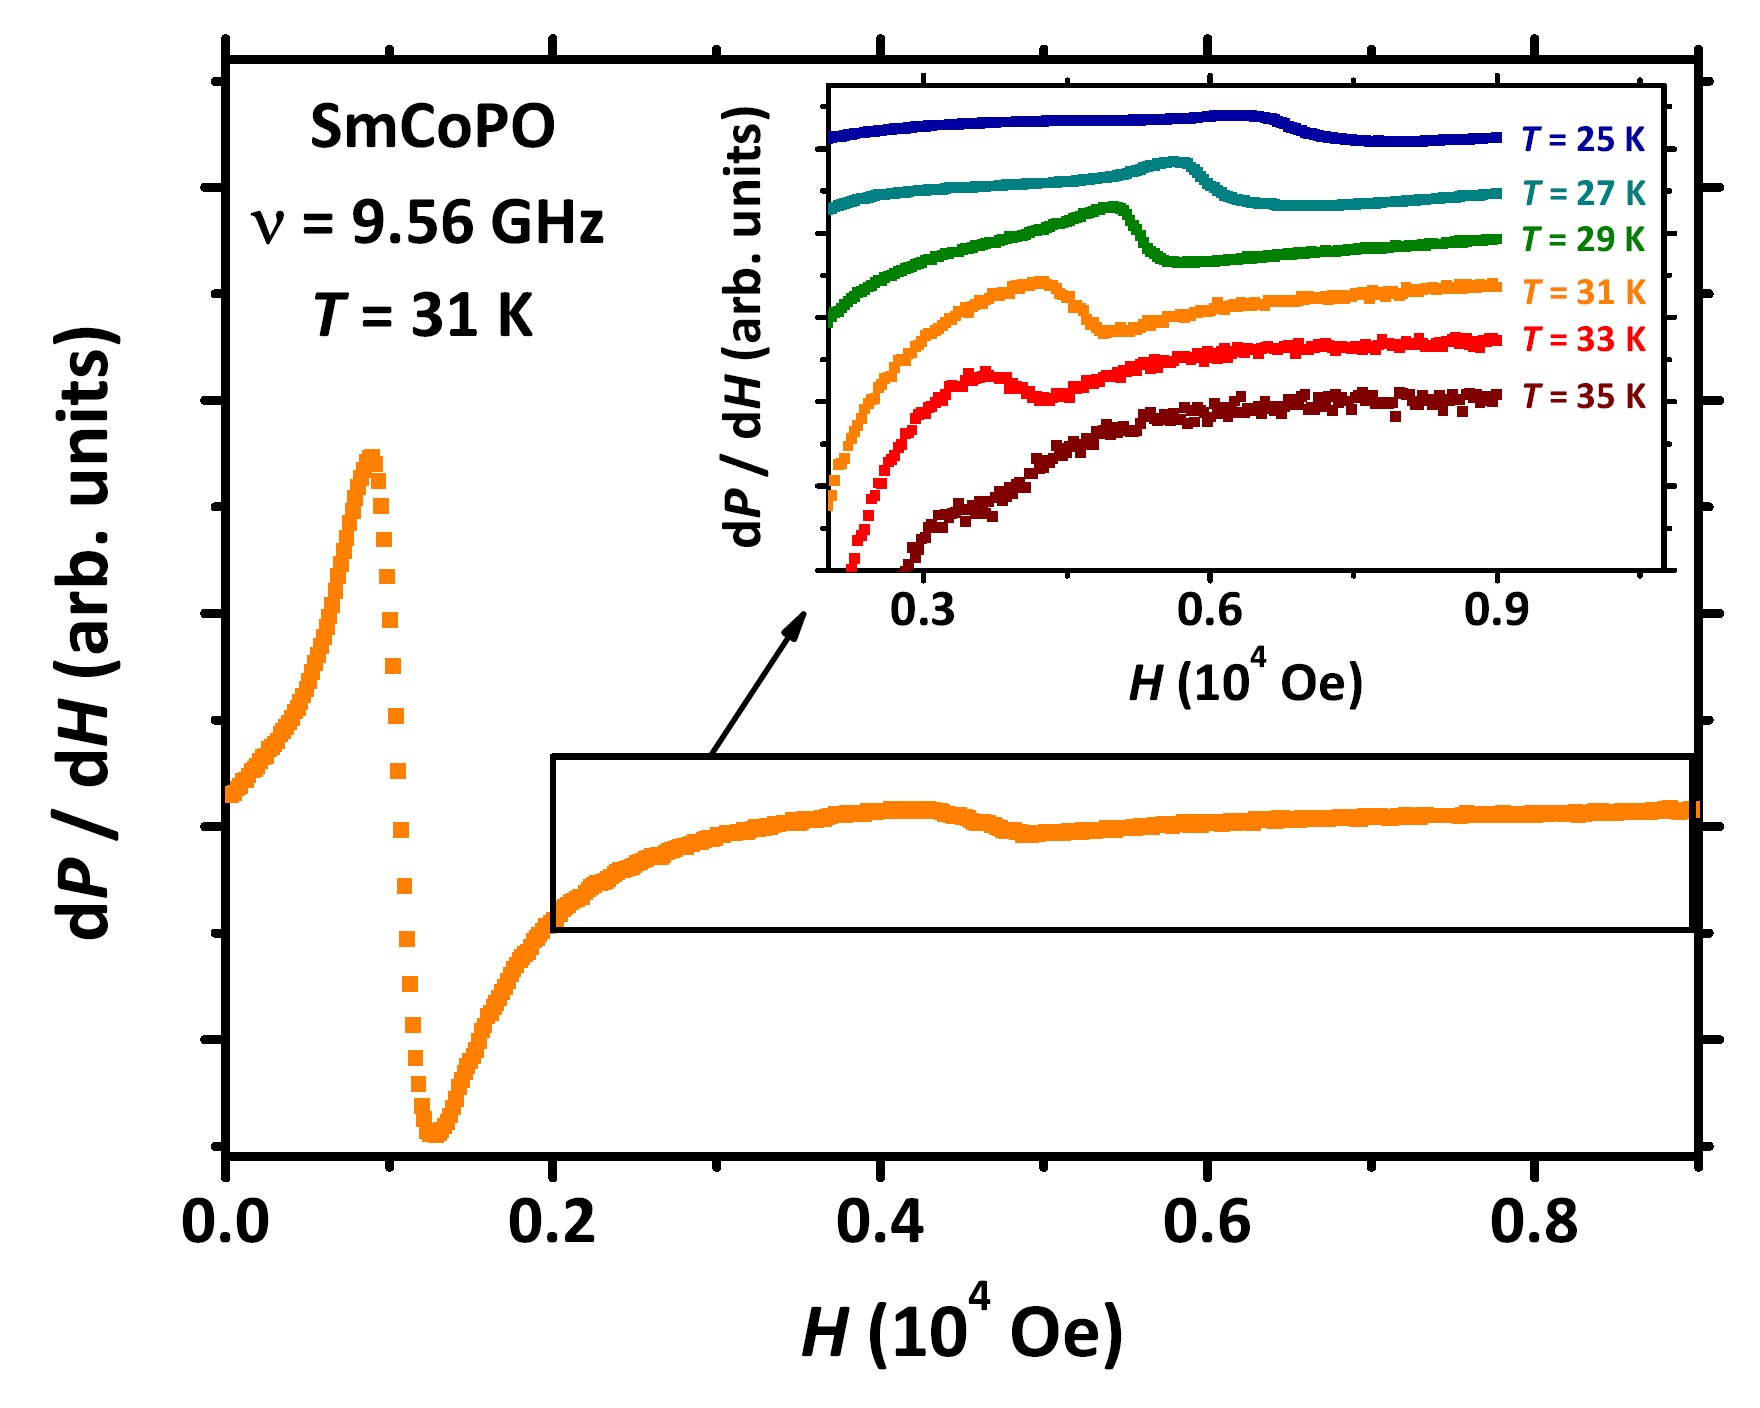
We need to discuss SmCoPO data further. As mentioned in Sect. II, curves are distorted for , making fitting attempts according to Eqs. (II.2.1), (2) and (3) unsuccessful in this whole region. Moreover, for , not only is sharply suppressed but the signal is also sizeably shifted to low values. This means that a non-negligible amount of the signal is located in negative fields for and, as such, it is simply not measured (see Fig. 5). This effect implies that a numerical integration of d/d data is also no longer possible in this limit, as a wide section of the resulting curve would take unphysical negative values for kOe irrespective of any attempted background subtraction. We also notice that the FMR signal for likely arises from an inhomogeneous state, where FM islands interspersed in an AF background still give a non-zero contribution to the overall FMR signal. This may introduce an additional not-controllable signal distortion. For all the reasons mentioned above, our data analysis for SmCoPO is limited to K as lowest temperature.
Finally, we stress that in SmCoPO a second signal develops for at high values, as is shown in Fig. 5. This is strongly shifting to even higher values with decreasing and it is completely lost for K. We interpret this as a signature of the AF phase, possibly belonging to an AF resonance branch. This signal will not be discussed in the rest of the manuscript.
III.2.2 Asymmetry of the FMR line
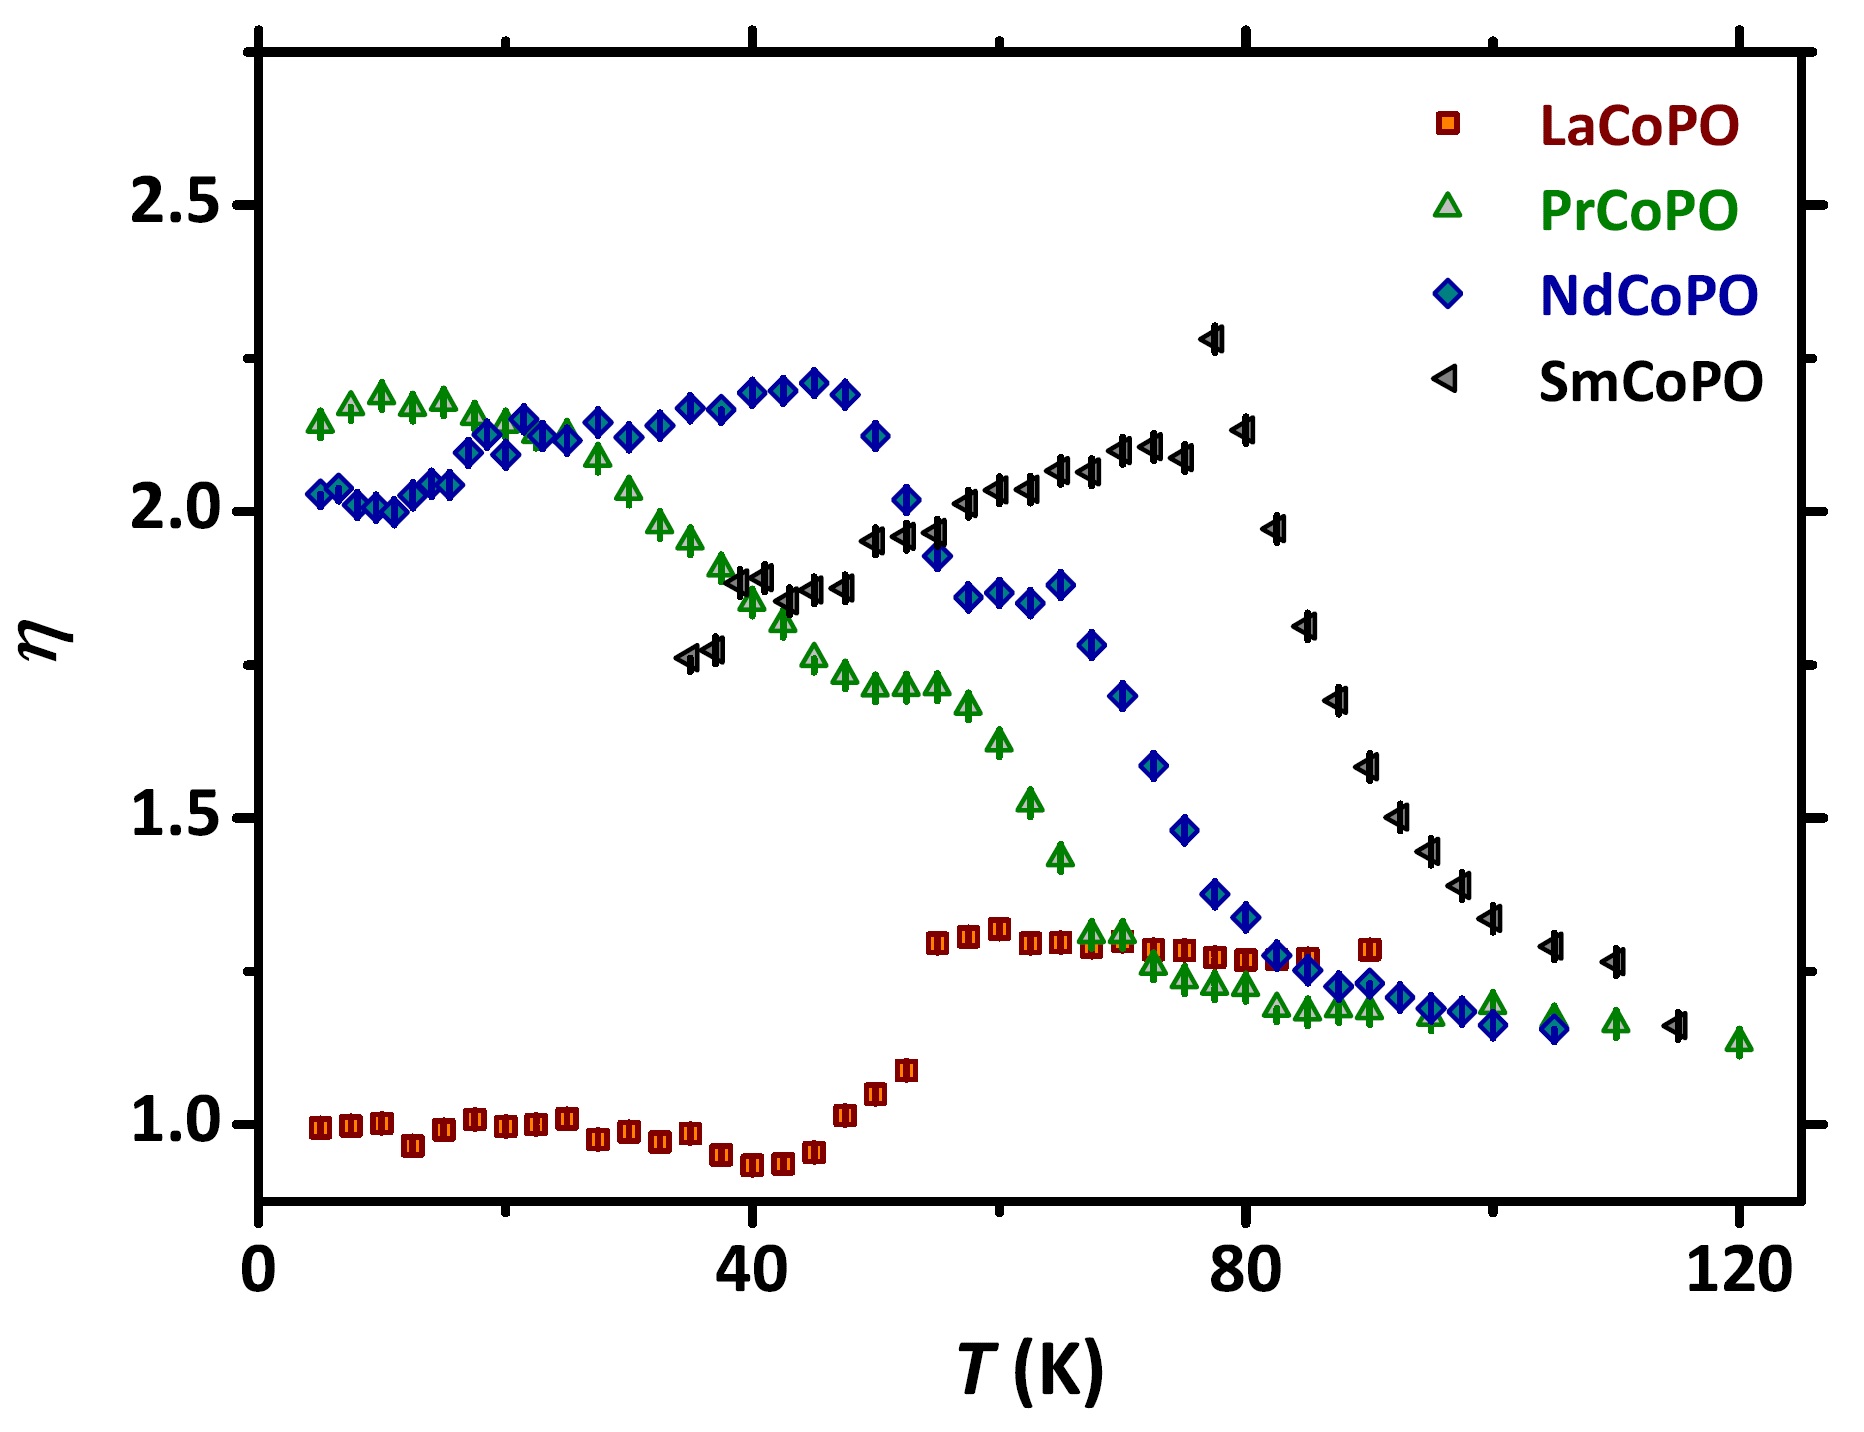
After estimating , we normalized the curves with respect to the relative maximum value observed at . The results are shown for the four samples in Fig. 6, globally displaying all the main features of the FMR line to be discussed in detail below. We first focus on the line asymmetry quantified by the parameter , whose behaviour for the four samples is displayed in Fig. 7. In the high paramagnetic limit, i. e., for , takes values independently on the actual sample. Accordingly, the origin of the slight asymmetry in this limit must be a common mechanism for all CoPO materials which, we argue, is associated with an incomplete Dyson-like distortion [Eqs. (II.2.1), (2) and (3) lead indeed to excellent fitting results for all the samples in this region]. On more physical grounds, as main argument in favour of the given interpretation, we notice that the powders’ morphology is identical for the four samples and, moreover, no substantial differences are noticed for the dependence of the electrical resistivity.Pal11 As a consequence, and have similar values for all the samples. A quantification of the ratio (see Sect. II) leads to as typical values, which are quite far from as expected in the case of full Dyson-like distortion with a negligible effect of electrons’ diffusion [or, equivalently, assuming that Eq. (6) is satisfied]. We conclude that our samples are in an intermediate regime . By considering m cm as typical value for the electrical resistivity at K,Pal11 we deduce m, which should be considered as a reasonable order of magnitude for .
The dependence of for LaCoPO evidences a sharp crossover at around K. In particular, below this temperature, the FMR line gets perfectly symmetric with (as also observed by eye in Fig. 1). We argue that the signal for K arises from a set of moments with FM correlations, hence the applicability of the Dyson’s theory and the resulting distortion, though partial. On the other hand, for K, the resonance signal is of collective nature, associated with an isotropic macroscopic magnetization of the sample which is not subject to the microscopic origin of the Dysonian distortion. This is in agreement with previous reports on itinerant ferromagnets with sizeable magnetization values.Tay75a We also notice that the onset of the FM state is not straightforward to locate precisely from these data alone but would be for sure higher than K estimated by means of ZF-SR. Considering that the current measurements are performed with a non-zero value, this result is consistent with the development of a FM phase.
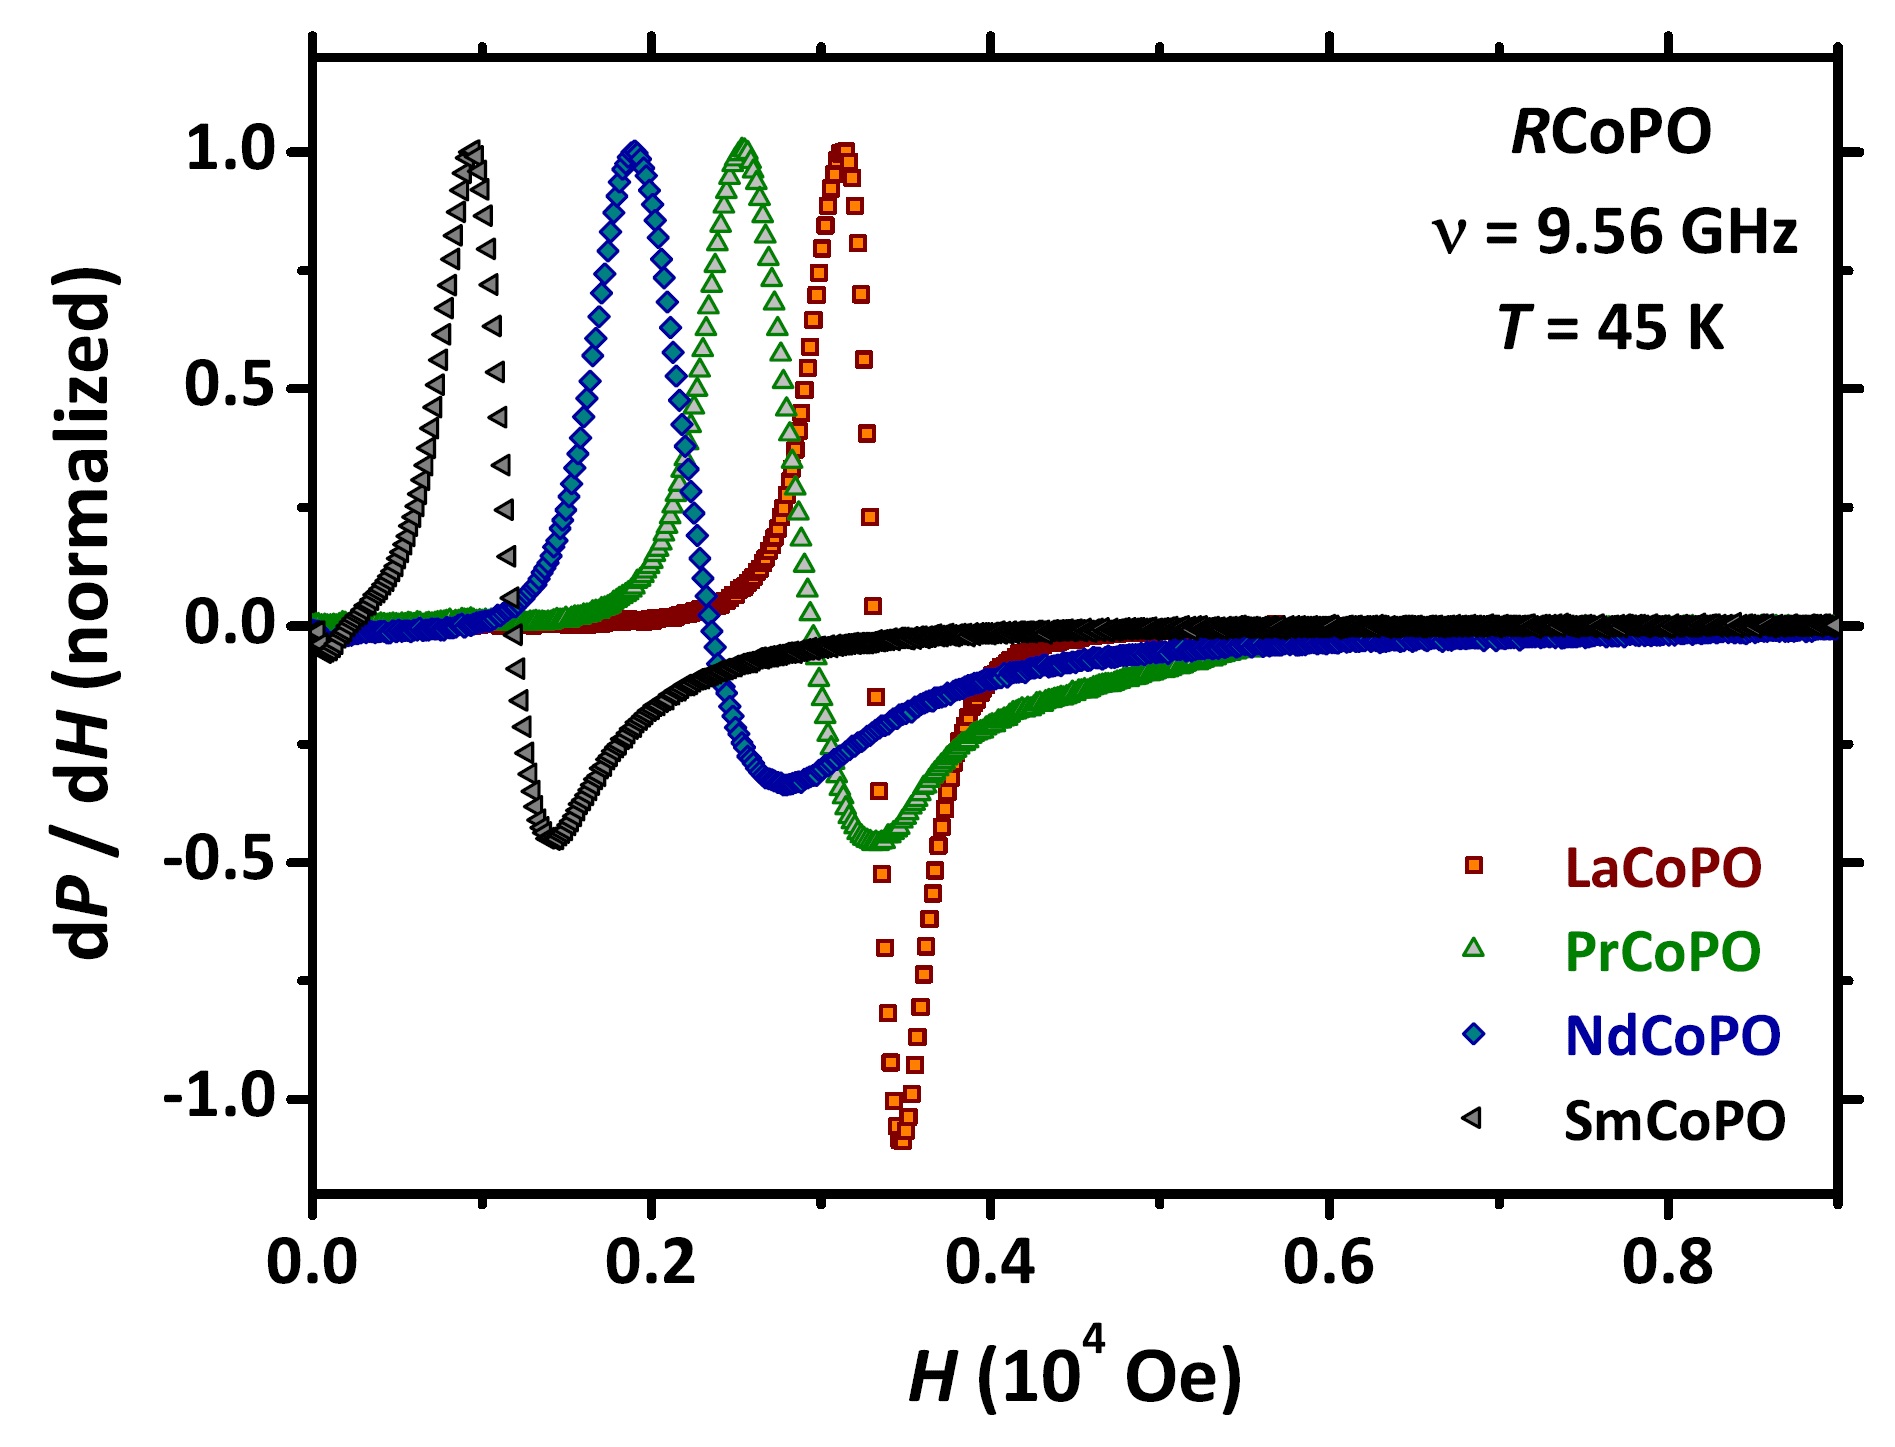
For PrCoPO, NdCoPO and SmCoPO, decreasing also results in a clear departure from the condition. However, for these materials, the behaviour is opposite if compared to LaCoPO, i. e., the FMR line asymmetry strongly increases. This is further displayed in Fig. 8 where we report d/d curves for all the samples at the common value K, i. e., safely above the AF phase for both NdCoPO and SmCoPO. As already mentioned above, there is no sign in the dependence of the electrical resistivity for the four samples which could explain the origin of this strong asymmetry in terms of Dyson-like distortions. Moreover, despite the qualitative resemblance to Dysonian lines, none of the experimental curves for PrCoPO, NdCoPO and SmCoPO can be precisely fitted by Eqs. (II.2.1), (2) and (3). We rather argue that this effect should be associated to an intrinsic magnetocrystalline anisotropy gradually developing within the FM phase of PrCoPO, NdCoPO and SmCoPO, leading to an inhomogeneous broadening of the FMR line.
III.2.3 Resonance field, effective factor and linewidth
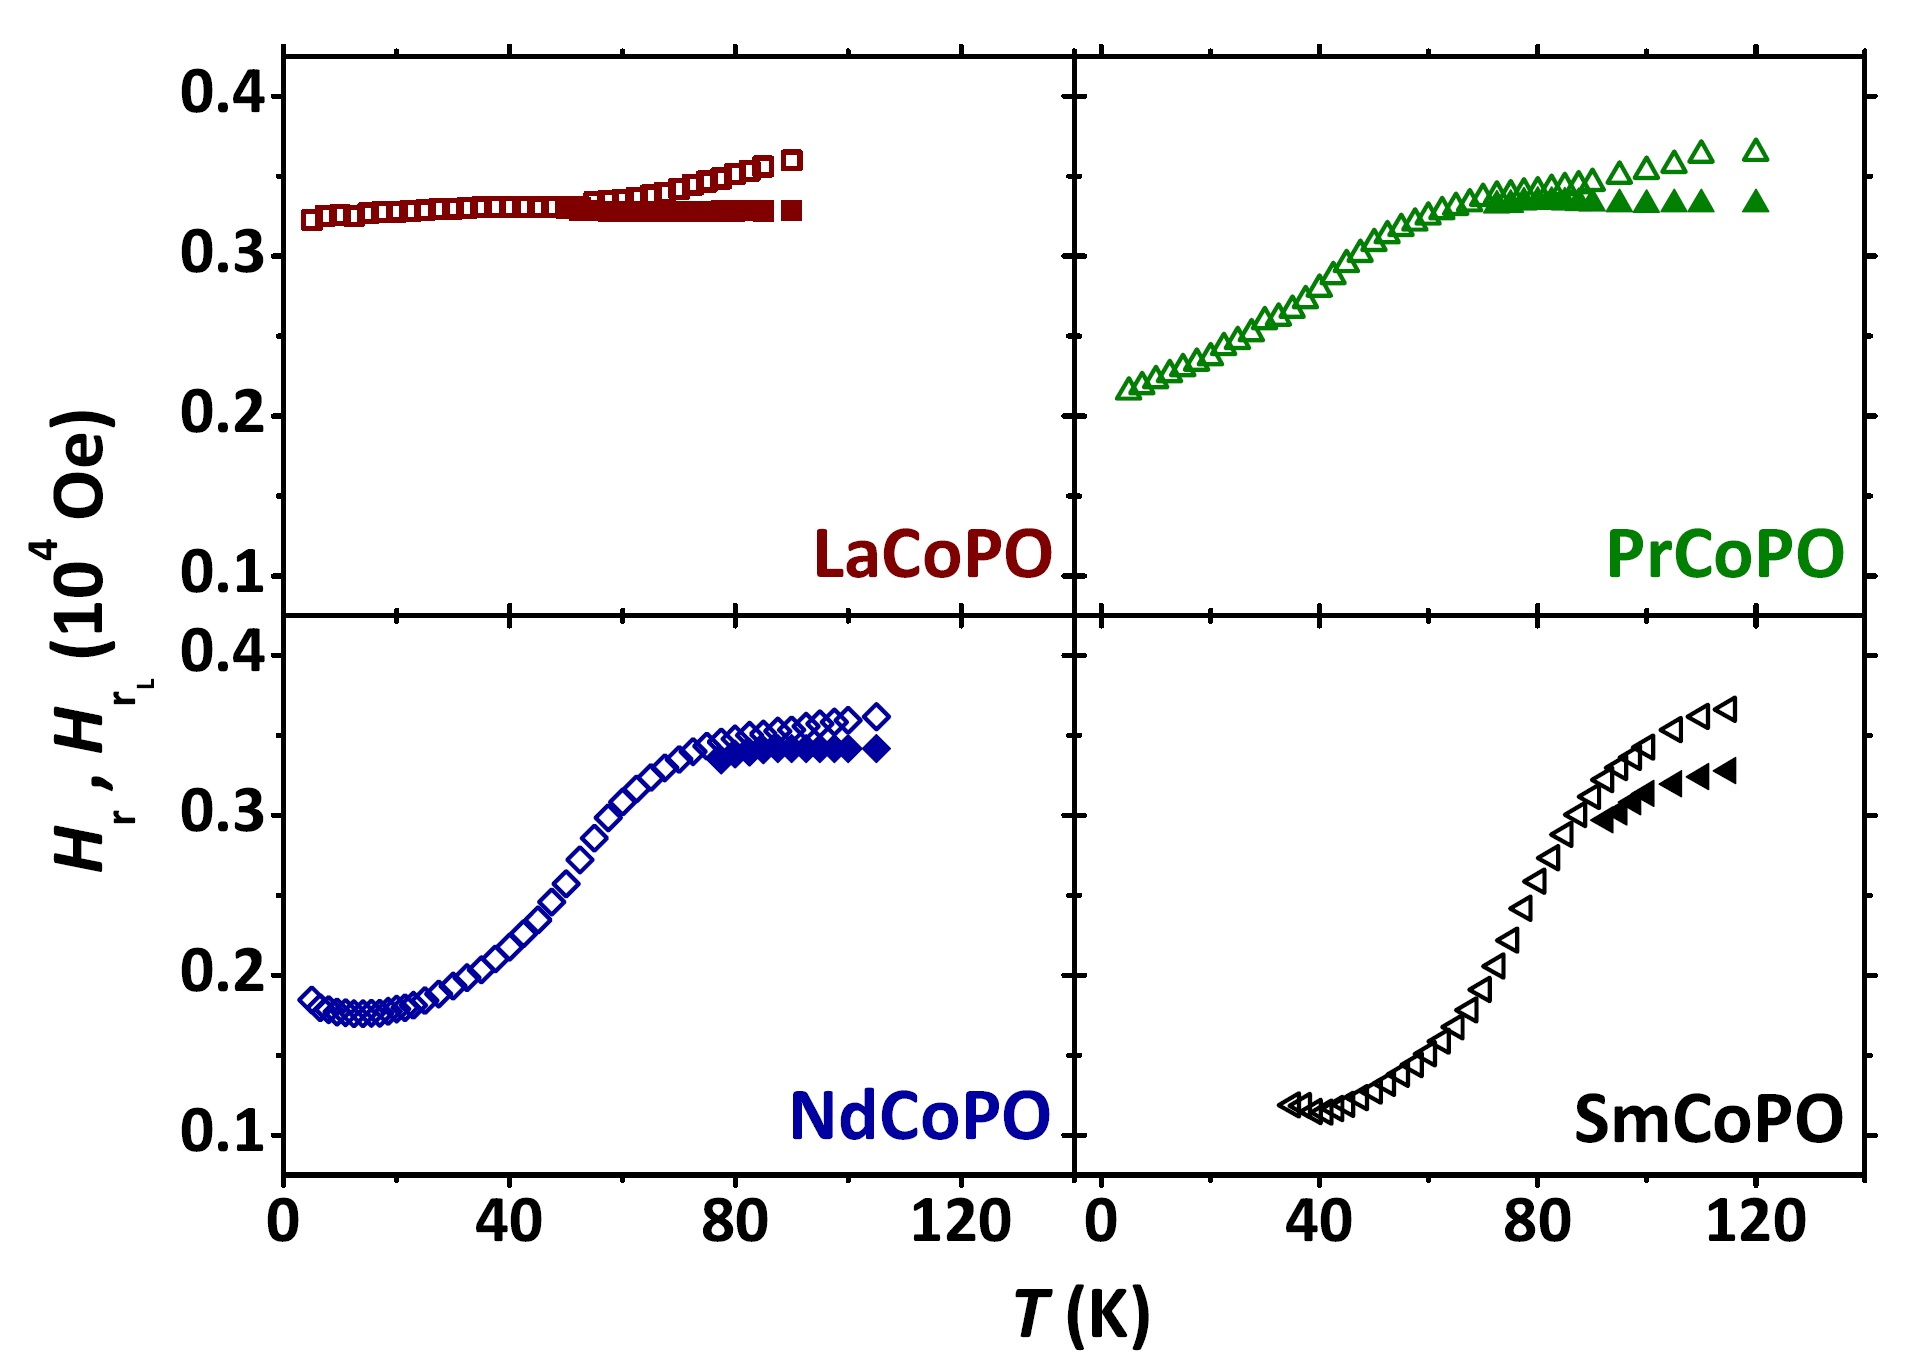
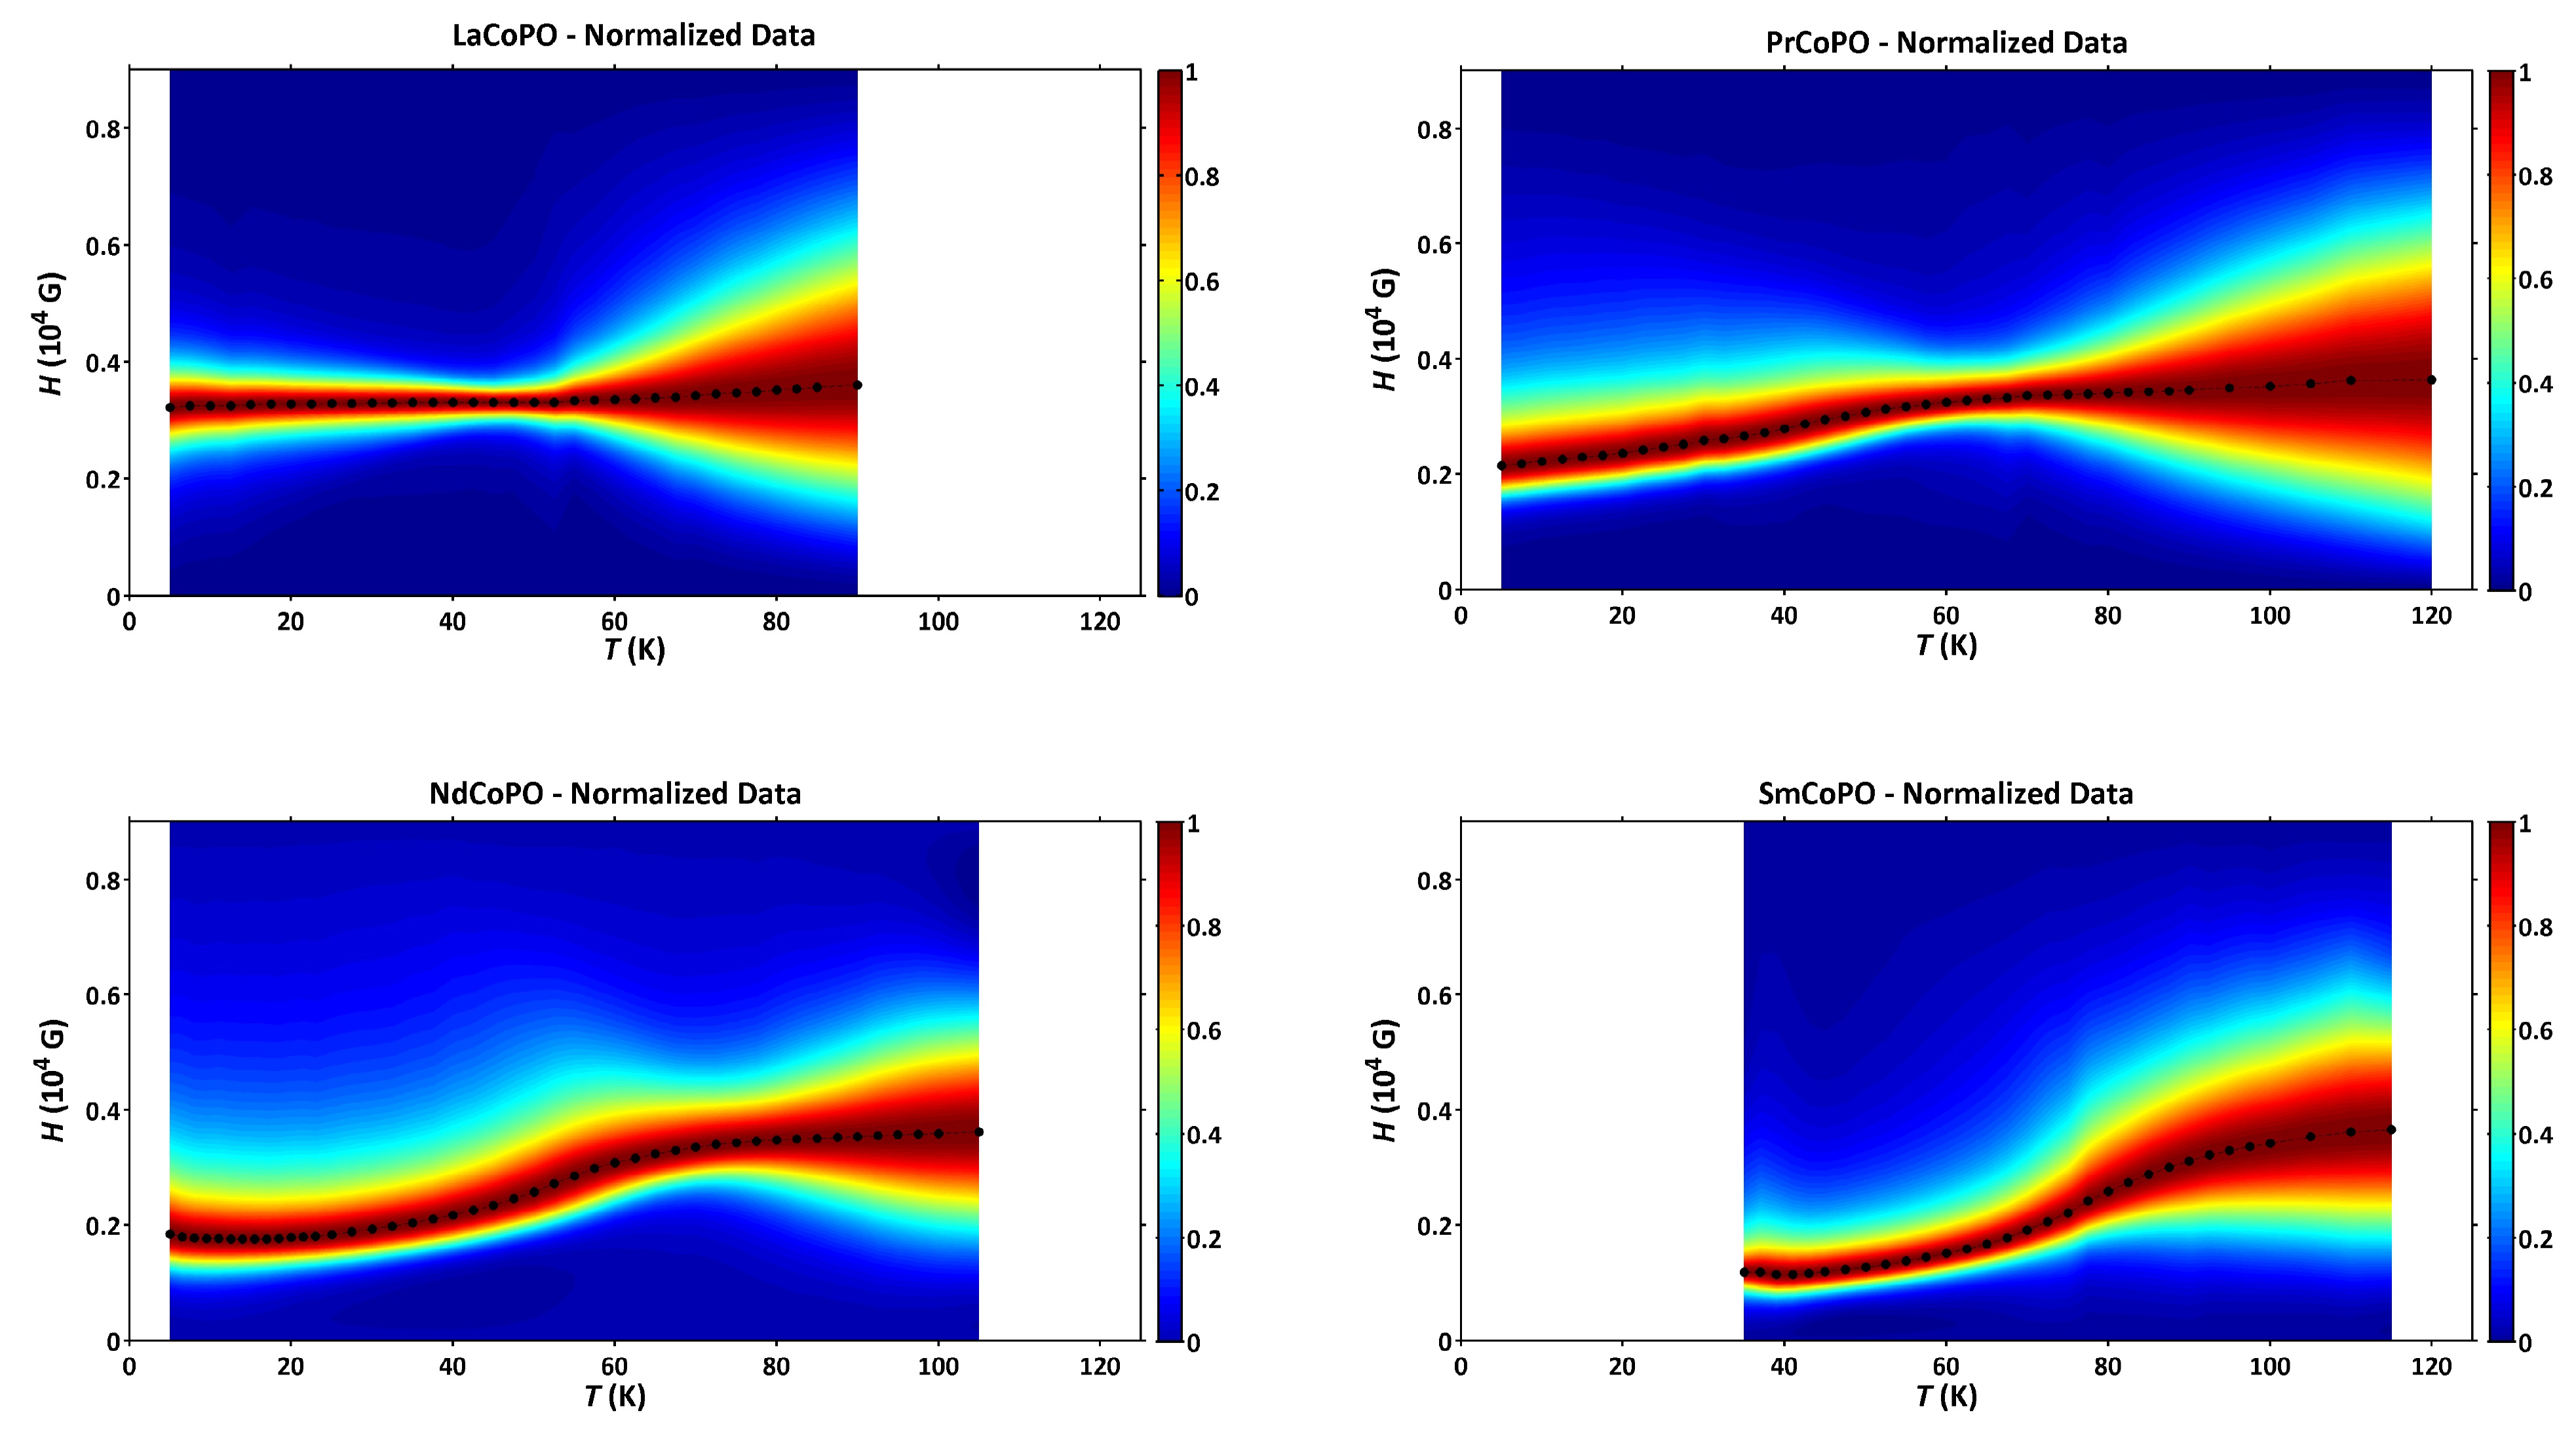
As is evident after inspecting Fig. 6, the central resonance field is not shifting for LaCoPO in the whole accessed experimental range but its dependence becomes gradually more and more marked when considering PrCoPO, then NdCoPO and finally SmCoPO. These arguments are made clearer in Fig. 9. The origin of the dependence of cannot be ascribed to the development of an internal magnetic field within the FM phase, as this cannot explain the almost complete lack of any shift for LaCoPO. In this respect, it should be further stressed that in LaCoPO the ordered magnetic moment per Co ion even takes its strongest value within the considered samples’ series (see later on in Tab. 1). Overall, this is another indication that an increasing magnetocrystalline anisotropy is developing in CoPO compounds while decreasing the volume of the unit cell .
A more detailed data analysis is needed in the paramagnetic regime where the signal distortion is arising after a Dyson-like mechanism. As is well known, a simple estimate of characteristic fields as done in the inset of Fig. 1 is indeed not accurate in the presence of a Dysonian distortion. In particular, this analysis introduces systematic shifts in which should be merely considered as artefacts.Tay75a ; Tay75b A proper way of accounting for these effects is to perform a conventional fitting procedure of the Dysonian line in the high- region by means of Eqs. (II.2.1), (2) and (3). Accordingly, with decreasing , we followed this strategy down to the point where the contribution of the magnetocrystalline anisotropy starts to introduce a severe distortion in the FMR line. With further decreasing , the line fitting is no longer possible and we then refer to the more empirical data analysis described in the inset of Fig. 1. As already mentioned in Sect. II, in LaCoPO a sizeable line distortion is only observed around the onset of the FM phase, i. e., in the narrow range K K and, accordingly, the two fitting approaches are equivalent for K. Still, we consider the empirical approach of Fig. 1 (inset) in this region for consistency with the other samples.
Results of both the analyses are presented in Fig. 9. A discrepancy between and data is confirmed in the paramagnetic regime. Here, while shows a marked dependence on , takes indeed a constant value for LaCoPO, PrCoPO and NdCoPO. The latter result reflects the intrinsic physical behaviour and it allows us to derive the effective factor values , and for Co2+ in LaCoPO, PrCoPO and NdCoPO, respectively. All these values are far from the reported for Co2+ in tetrahedral crystalline environments.Abr70 This estimate cannot be performed for SmCoPO in the accessed range, where is still showing a strong dependence in the paramagnetic regime, suggesting a flattening only at higher .
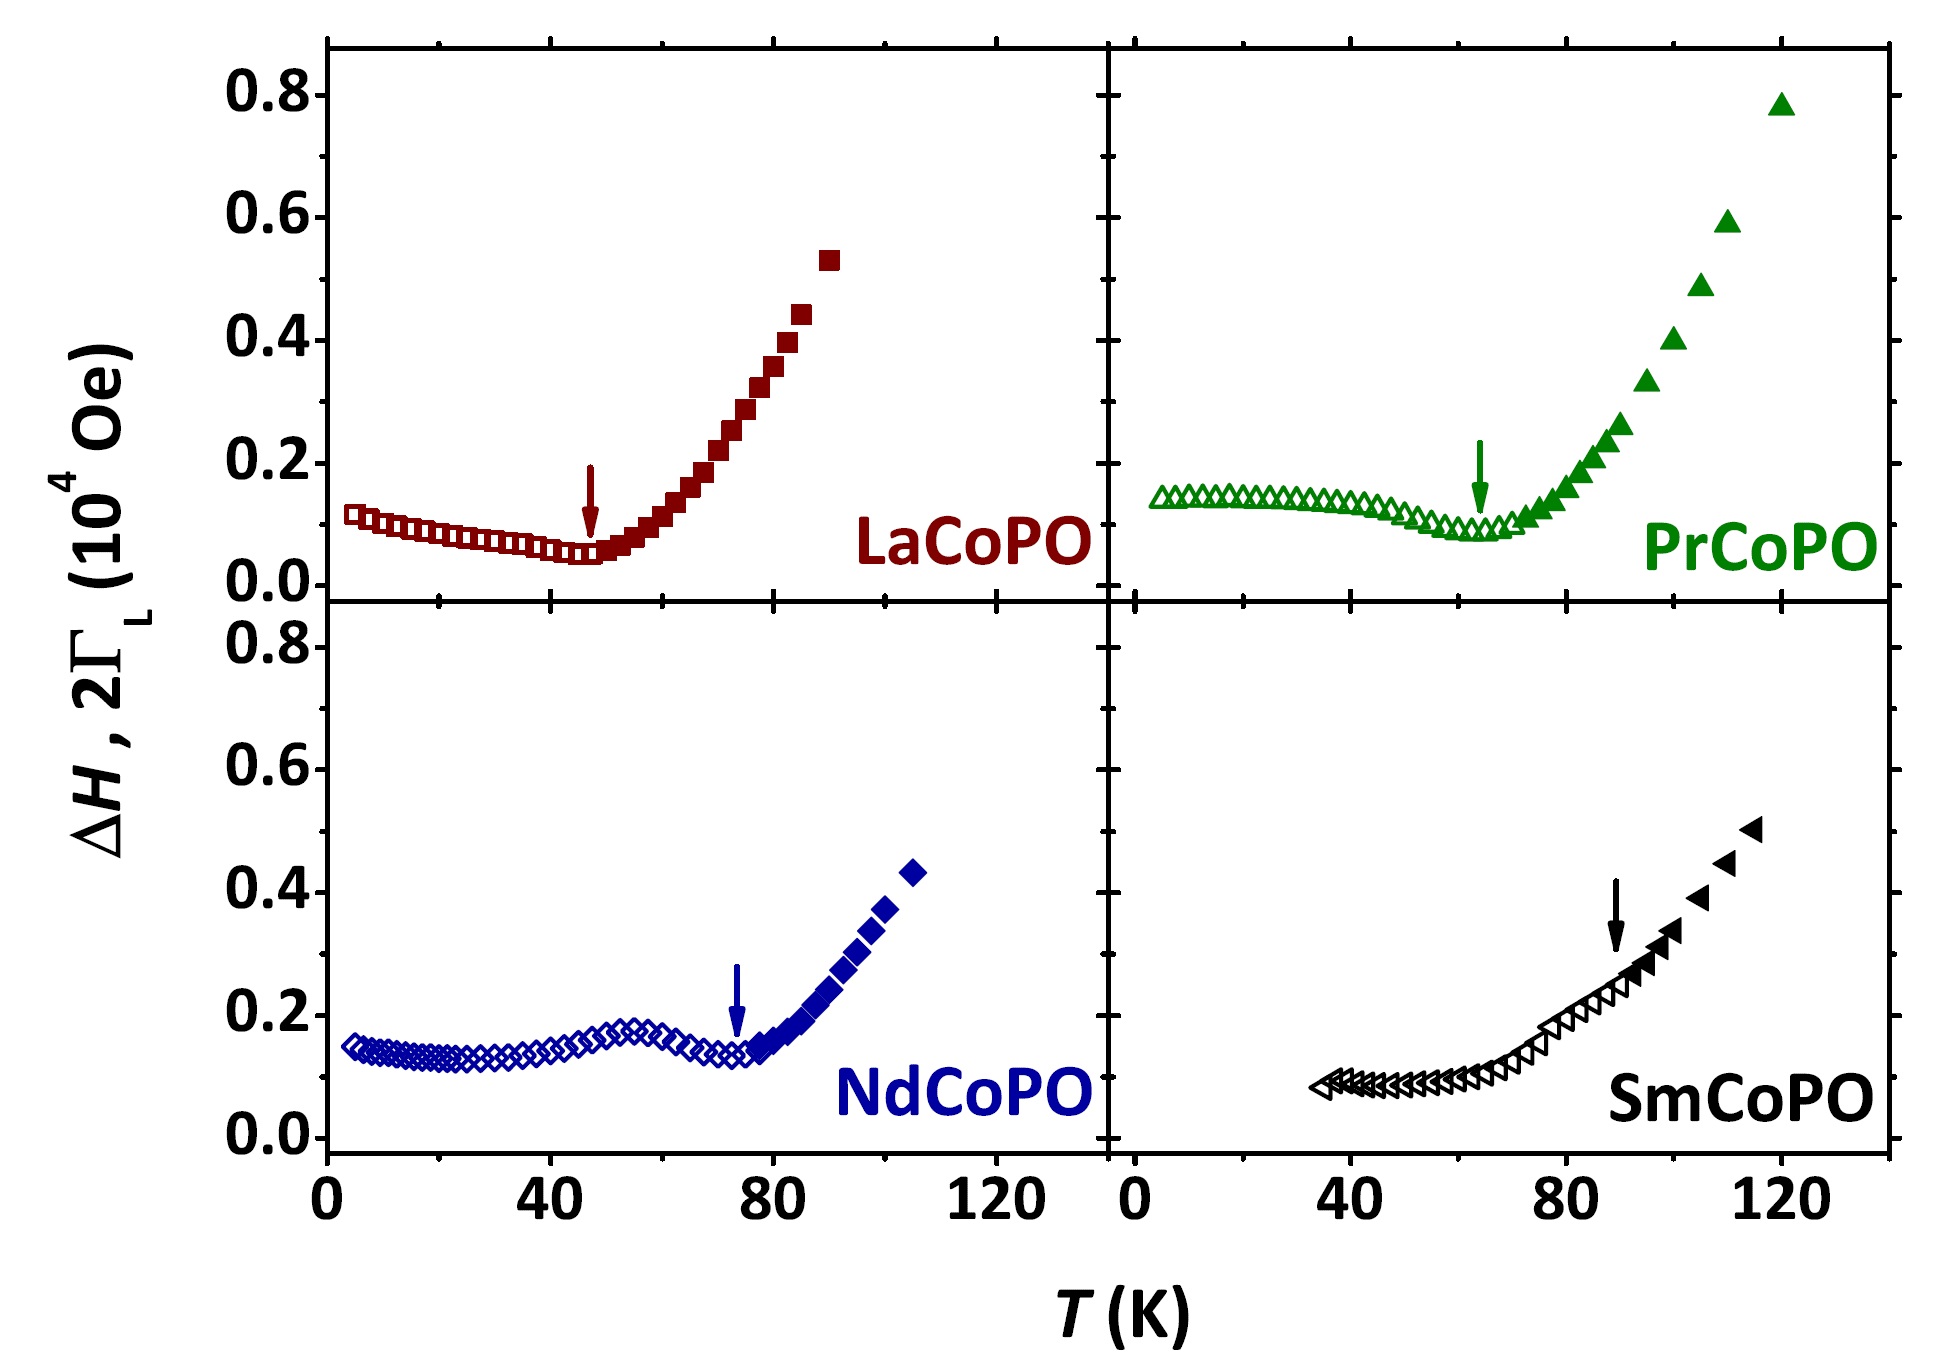
The dependence of the FWHM is displayed in Fig. 10 for the four samples. Similarly to Fig. 9, we report data from both the analysis procedures described above with the same meaning of symbols (however, only data are reported in the paramagnetic regime for the aim of clarity). In LaCoPO, a fast decrease is observed with decreasing in the paramagnetic regime until a minimum value is reached at . With further decreasing , the linewidth increases again with a much lower rate than in the paramagnetic regime. The observed result is in qualitative agreement with previous observations in itinerant compounds with diluted magnetic moments even if, in these systems, the observed rates are opposite (i. e., slow decrease and fast increase above and below , respectively).Bar81 ; Tay75a ; Tay75b A qualitatively similar dependence of the FWHM is observed also for PrCoPO, while a new feature emerges for NdCoPO. Here, below K, is further suppressed upon decreasing giving rise to a local maximum. We argue that this additional feature is associated to the increased magnetocrystalline anisotropy and, possibly, also to an additional dynamical contribution associated with the onset of antiferromagnetic correlations preluding to the AF phase. Finally, we stress that a similar effect is observed for SmCoPO as well. However, in this compound, the strong effects of the magnetocrystalline anisotropy (and, possibly, of additional dynamical contributions) set in at much higher values, making the overall vs. behaviour qualitatively different from the ones discussed above. Still, an inflection point can be distinguished at K.
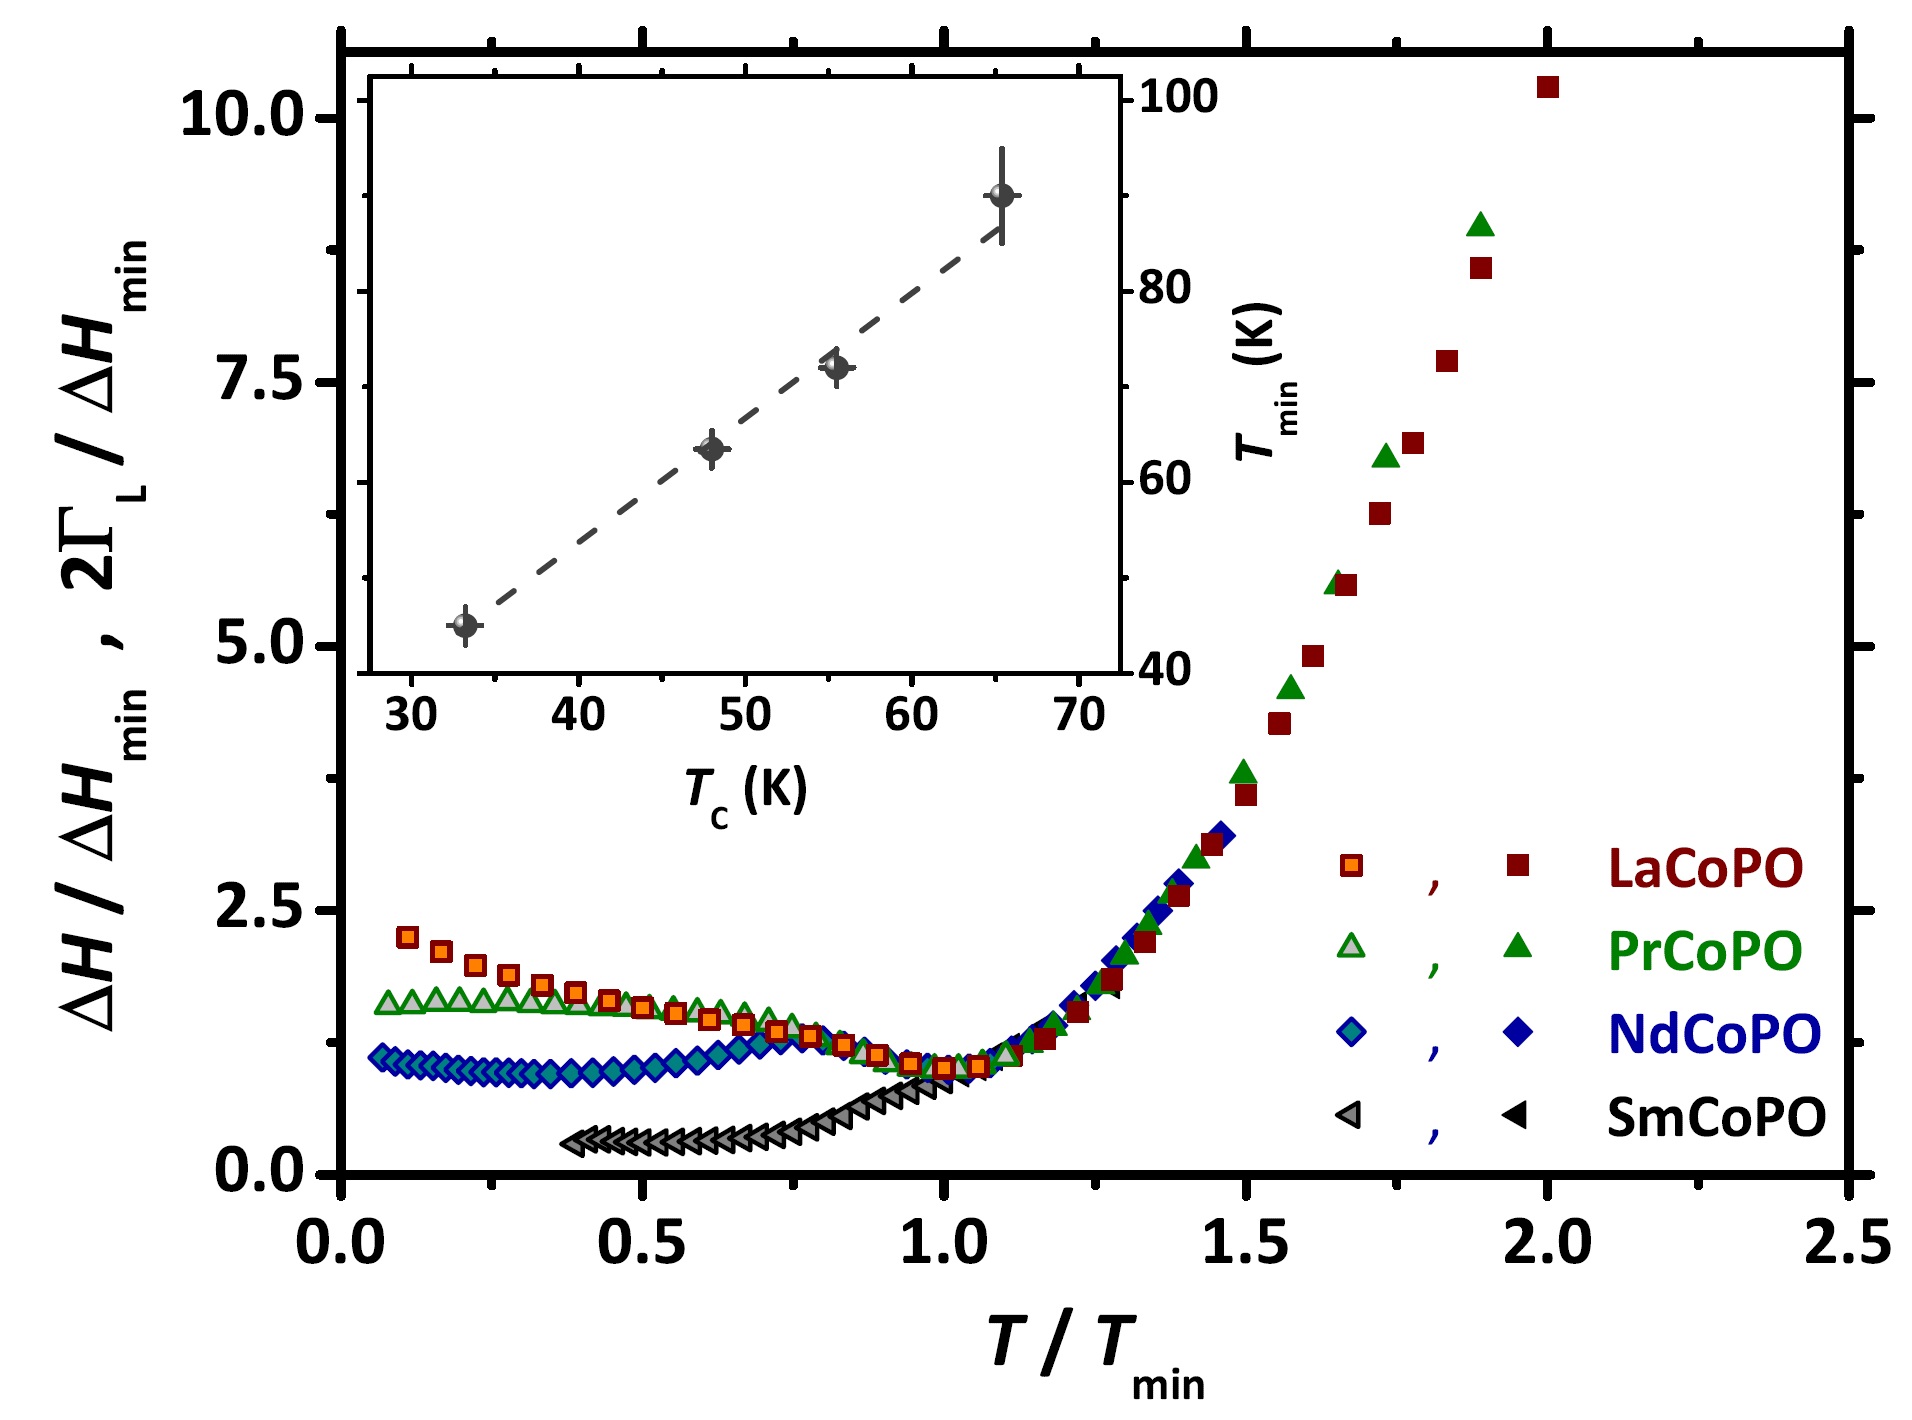
In Fig. 11, we report the data already presented in Fig. 10 after normalization by and values on the -axis and on the -axis, respectively (the meaning of the used symbols is preserved). Remarkably, the normalized experimental points collapse onto one single well-defined trend for . At the same time, as shown in the inset, we notice that linearly correlates with the values estimated by means of ZF-SR. Accordingly, we deduce that the FWHM is intimately governed by the growing ferromagnetic correlations within the Co sublattice for and that these latter show similar properties for all the samples. As already commented above, the deviations observed for should be ascribed to different contributions from the magnetocrystalline anisotropy and, possibly, from dynamical effects preluding to the AF phase.
III.3 ESR. High-frequency regime
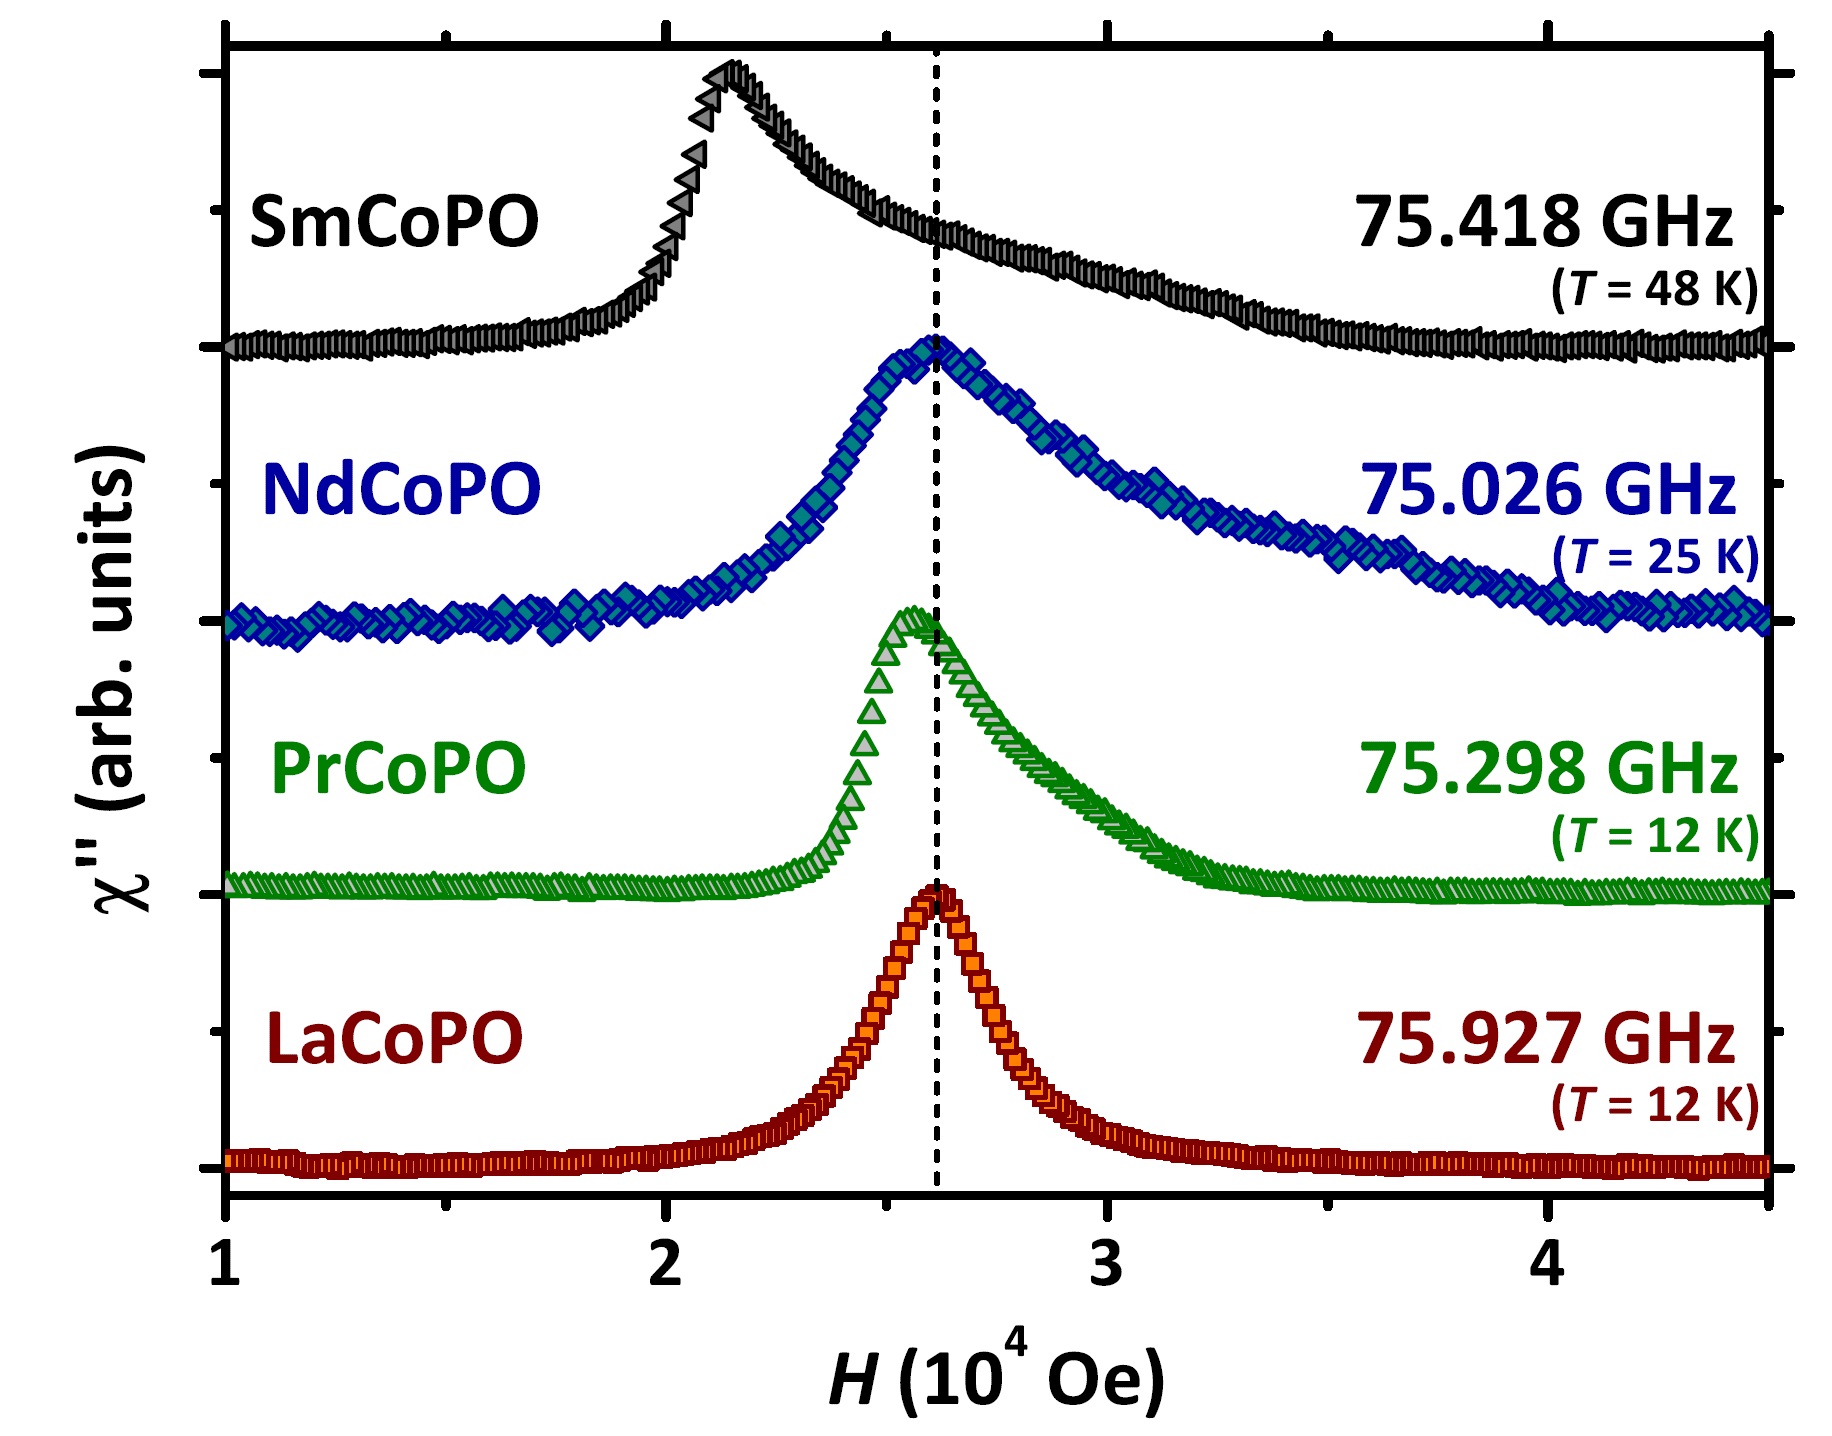
We performed measurements in the high-frequency regime at values selected in such a way that all the four samples are properly tuned within the FM phase (see Fig. 3). A comparison of the observed FMR lines at comparable values is presented in Fig. 12. Here, we clearly observe that the asymmetric line broadening is sizeably increasing when substituting the ion from La3+ to Pr3+, Nd3+ and finally Sm3+. Accordingly, we mainly recognize a further indication of what we have already argued above, namely that the substitution in CoPO gradually induces an increasing magnetocrystalline anisotropy and, accordingly, an inhomogeneous broadening of the powder-averaged FMR line. The lineshapes presented in Fig. 12 are highly reminiscent of hard-axis anisotropy limit,Sur95 as discussed in more detail in the next section.
IV Discussion

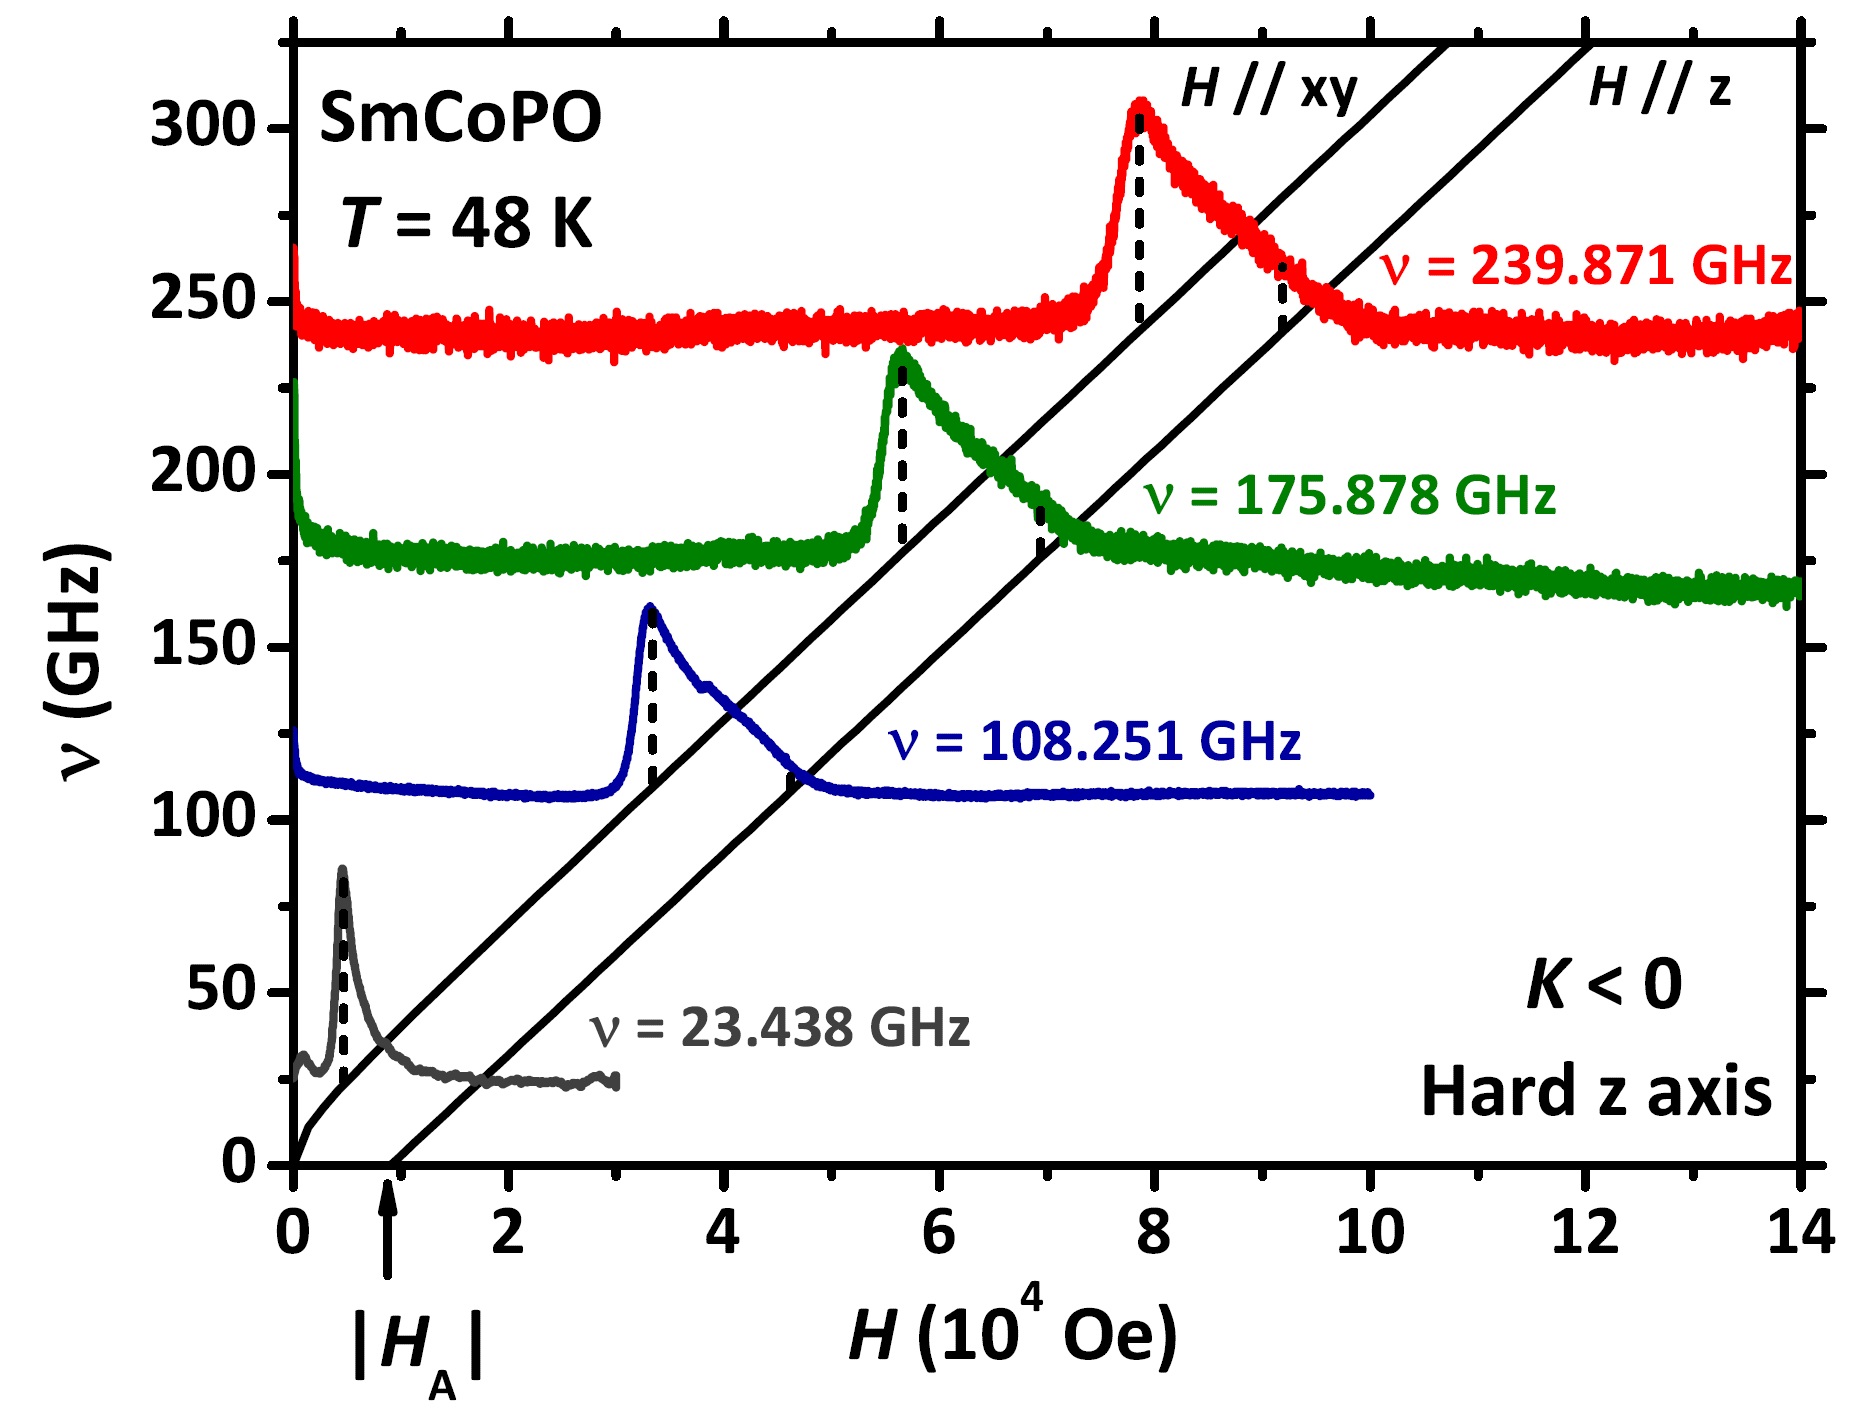
In Fig. 13 we report data extracted from Fig. 12 and from similar measurements performed at fixed and at several values. As enlightened in the inset of Fig. 13, we observe a non-linear behaviour in the trends of PrCoPO, NdCoPO and SmCoPO for small values. We also recognize that the non-linearity of the vs. datasets is progressively increasing for PrCoPO, then NdCoPO and finally SmCoPO. On the other hand, LaCoPO displays a linear behaviour over the whole accessed experimental window. By referring to the theory of FMR,Kit48 ; Von66 this property of LaCoPO can be considered as an a posteriori confirmation of our original assumption about the sample morphology, namely, the powder is composed of approximately spherical grains. Accordingly, we can neglect the effect of demagnetization factors (shape anisotropy) on the actual trend, assuming that the same holds for the other compounds as well.
In the light of the observed phenomenology, we analyze data by referring to a basic model for magnets with uniaxial symmetry.Tur65 Data in Fig. 13 are indeed highly reminiscent of the hard-axis (easy-plane) limit for the magnetocrystalline anisotropyTur65
| (7) |
where is an effective magnetic field quantifying the magnetocrystalline anisotropy within the FM phase and is the gyromagnetic ratio. The expression
| (8) |
relates this latter parameter to the usual magnetocrystalline anisotropy constant (easy-plane anisotropy) via the sample magnetization.Tur65 ; Cul09 Results of the fitting procedure to experimental data are shown in Fig. 13, denoting an excellent agreement with the experimental data upon properly setting and values.
| Compound | (/Co) | (erg/Oe cm3) |
|---|---|---|
| LaCoPO | 0.295 0.01 | 40.5 1.5 |
| PrCoPO | 0.27 0.01 | 37.1 1.5 |
| NdCoPO | 0.24 0.01 | 32.8 1.5 |
| SmCoPO | 0.225 0.01 | 31 1.5 |
It should be remarked that Eq. (7) is relative to one specific branch of the limit and, in particular, to the case of the external magnetic field lying within the easy plane (, where denotes the hard axis). In the opposite case (), one expectsTur65
| (9) | |||||
The exemplary trends for both and are visualized in Fig. 14 as continuous lines, after selecting GHz/Oe and kOe, i. e., the values previously obtained from a fitting procedure to SmCoPO data. Fig. 14 also reports some selected experimental curves for SmCoPO at different values. By considering each curve, it is clear that the overall vs. behaviour is the result of the contribution of grains with different orientations with respect to , giving rise to a powder-averaged, inhomogeneously-broadened absorption line. We further stress that the well-defined maximum observed in the experimental curves at should be associated to grains where the condition holds. The stronger intensity compared to the branch is easily explained from geometrical considerations of the powder average. Remarkably, the low- line is less asymmetric than the other ones. We attribute this effect to the low typical values of in this limit, which may result in an undetectable signal from the branch.
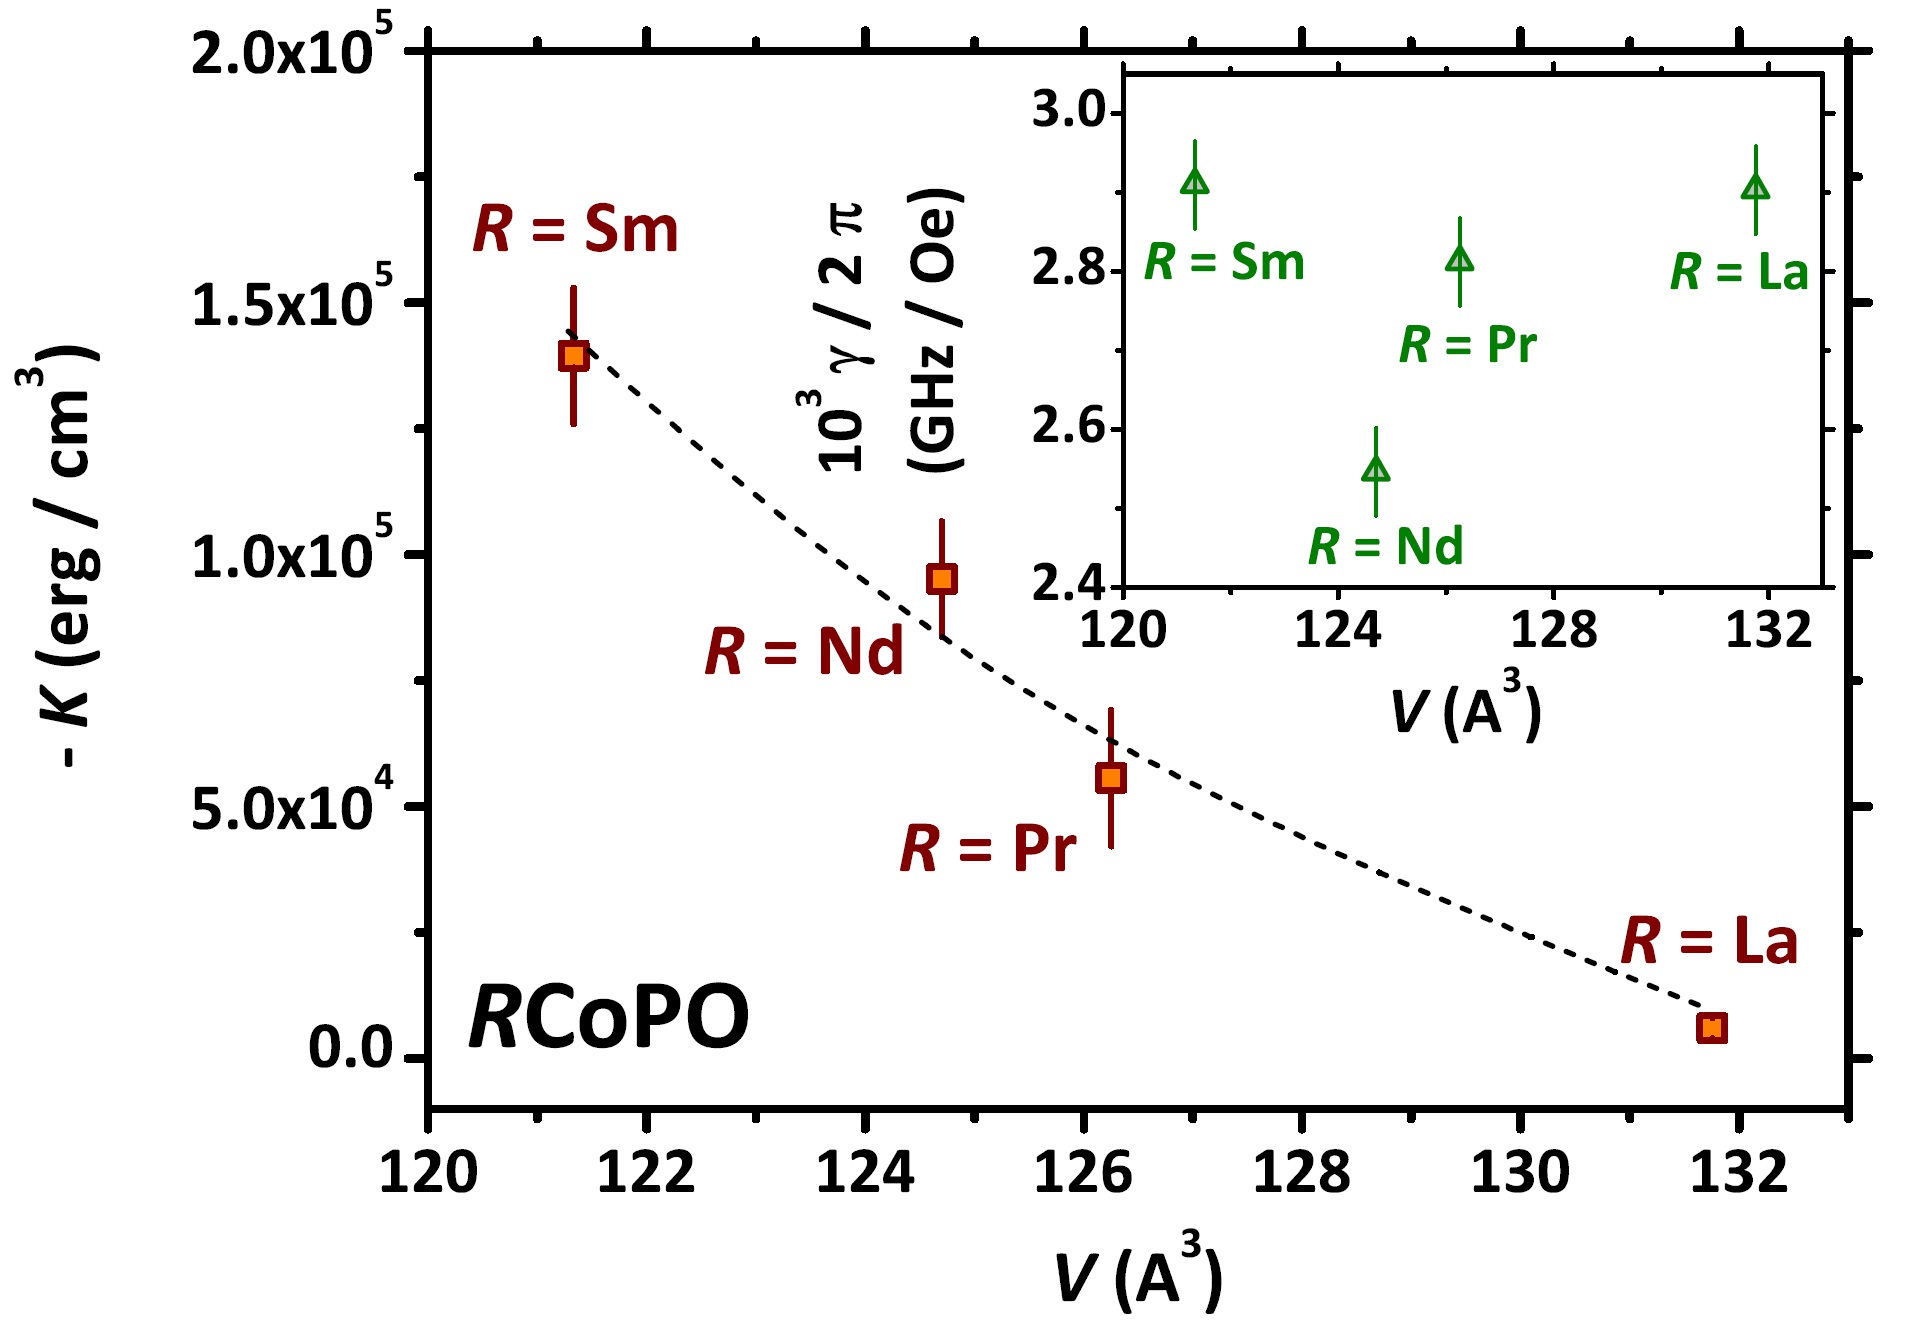
Estimates of values from Fig. 13 enable us to directly estimate the anisotropy constants for the four samples via Eq. (8). We used magnetization values derived from independent measurementsPra13 ; Pal11 and, in particular, we employed the saturation values estimated at temperatures close to the conditions of FMR measurements (see Fig. 12). The results are displayed in Fig. 15, showing a well defined trend for as a function of the unit cell volume . These results suggest that decreasing the value is the physical origin for triggering anisotropic magnetic properties for CoPO. Since previously reported dataPra15 evidence that smaller ions induce a reduction in and axes such that the ratio is approximately constant (i. e., the lattice is contracting isotropically), one reasonable conclusion is that the pnictogen height is reducing faster, making the local tetrahedral environment progressively more distorted. However, we also expect a sizeable interaction between and electronic degrees of freedom from rare-earth and pnictogen ions, respectively, which is typically measured by means of local-probe techniques for O oxides.Jeg09 ; Pra10 ; Alf11 While this effect may be well enhanced by the increasing chemical pressure, we argue that it may introduce an indirect transfer of anisotropic properties from the orbitals of ions to the bands arising from Co orbitals and ultimately influencing the magnetocrystalline anisotropy. In this respect, extending our measurements to a more complete set of CoPO samples with different prolaticity properties for the orbitals would lead to a important check on which of the two proposed mechanisms is indeed the dominant one.
Another scenario can be considered in order to understand the origin of the observed behaviour. One robust output of our investigation is that LaCoPO shows almost fully-isotropic magnetic properties within the FM phase, a fact which is surprising in the light of the typically anisotropic properties of uniaxial magnets.Cul09 These features may be only apparently isotropic if one assumes that a strong magnetocrystalline anisotropy could be effectively compensated by shape anisotropy effects, under the hypothesis that the spherical grains composing the investigated samples are coupled among them. While it seems quite unlikely that this compensation effect leads to completely symmetric lineshapes as the experimental ones measured for LaCoPO, the main conclusions outlined above (i. e., the magnetocrystalline anisotropy is enhanced by substitution) are robustly preserved also within this scenario.
V Conclusions
We reported on ferromagnetic resonance measurements in CoPO for different ions. We unambiguously detected the gradual development of a sizeable easy-plane magnetocrystalline anisotropy upon substituting the ion. The observed behaviour is discussed to a complex interplay of structural effects and of the sizeable interaction between and electronic degrees of freedom from rare-earth and pnictogen ions.
Acknowledgements
We thank M. Richter and U. Rößler for valuable discussions. G. Prando acknowledges support by the Humboldt Research Fellowship for Postdoctoral researchers and by the Sonderforschungsbereich (SFB) 1143 project granted by the Deutsche Forschungsgemeinschaft (DFG).
References
- (1) Y. Kamihara, H. Hiramatsu, M. Hirano, R. Kawamura, H. Yanagi, T. Kamiya, and H. Hosono, Iron-Based Layered Superconductor: LaOFeP, J. Am. Chem. Soc. 128, 10012 (2006).
- (2) Y. Kamihara, T. Watanabe, M. Hirano, and H. Hosono, Iron-Based Layered Superconductor La[O1-xFx]FeAs (x = 0.05 – 0.12) with = 26 K, J. Am. Chem. Soc. 130, 3296 (2008).
- (3) Z.-A. Ren, W. Lu, J. Yang, W. Yi, X.-L. Shen, Z.-C. Li, G.-C. Che, X.-L. Dong, L.-L. Sun, F. Zhou, and Z.-X. Zhao, Superconductivity at 55 K in Iron-Based F-Doped Layered Quaternary Compound Sm[O1-xFx]FeAs, Chin. Phys. Lett. 25, 2215 (2008).
- (4) G. Prando, P. Carretta, R. De Renzi, S. Sanna, H.-J. Grafe, S. Wurmehl, and B. Büchner, ac susceptibility investigation of vortex dynamics in nearly optimally doped RFeAsO1-xFx superconductors (R = La, Ce, Sm), Phys. Rev. B 85, 144522 (2012).
- (5) A. Martinelli, F. Bernardini, and S. Massidda, The phase diagrams of iron-based superconductors: theory and experiments, C. R. Physique 17, 5 (2016).
- (6) A. S. Sefat, A. Huq, M. A. McGuire, R. Jin, B. C. Sales, D. Mandrus, L. M. D. Cranswick, P. W. Stephens, and K. H. Stone, Superconductivity in LaFe1-xCoxAsO, Phys. Rev. B 78, 104505 (2008).
- (7) C. Wang, Y. K. Li, Z. W. Zhu, S. Jiang, X. Lin, Y. K. Luo, S. Chi, L. J. Li, Z. Ren, M. He, H. Chen, Y. T. Wang, Q. Tao, G. H. Cao, and Z. A. Xu, Effects of cobalt doping and phase diagrams of LFe1-xCoxAsO (L = La and Sm), Phys. Rev. B 79, 054521 (2009).
- (8) V. P. S. Awana, A. Pal, A. Vajpayee, R. S. Meena, H. Kishan, M. Husain, R. Zeng, S. Yu, K. Yamaura, and E. Takayama-Muromachi, Superconductivity in SmFe1-xCoxAsO (x = 0.0 – 0.30), J. Appl. Phys. 107, 09E146 (2010).
- (9) A. Marcinkova, D. A. M. Grist, I. Margiolaki, T. C. Hansen, S. Margadonna, and J. W. G. Bos, Superconductivity in NdFe1-xCoxAsO (0.050.20) and rare-earth magnetic ordering in NdCoAsO, Phys. Rev. B 81, 064511 (2010).
- (10) Y. Qi, L. Wang, Z. Gao, D. Wang, X. Zhang, C. Yao, C. Wang, C. Wang, and Y. Ma, Superconductivity and magnetic properties in SmFe1-xCoxAsO (x = 0 to 1), Europhys. Lett. 96, 17007 (2011).
- (11) T. Shang, L. Yang, Y. Chen, N. Cornell, F. Ronning, J. L. Zhang, L. Jiao, Y. H. Chen, J. Chen, A. Howard, J. Dai, J. D. Thompson, A. Zakhidov, M. B. Salamon, and H. Q. Yuan, Tunable interplay between 3d and 4f electrons in Co-doped iron pnictides, Phys. Rev. B 87, 075148 (2013).
- (12) G. Prando, O. Vakaliuk, S. Sanna, G. Lamura, T. Shiroka, P. Bonfà, P. Carretta, R. De Renzi, H.-H. Klauss, C. G. F. Blum, S. Wurmehl, C. Hess, and B. Büchner, Role of in-plane and out-of-plane dilution in CeFeAsO: Charge doping versus disorder, Phys. Rev. B 87, 174519 (2013).
- (13) H. Wadati, I. Elfimov, and G. A. Sawatzky, Where Are the Extra d Electrons in Transition-Metal-Substituted Iron Pnictides?, Phys. Rev. Lett. 105, 157004 (2010).
- (14) T. Berlijn, C.-H. Lin, W. Garber, and W. Ku, Do Transition-Metal Substitutions Dope Carriers in Iron-Based Superconductors?, Phys. Rev. Lett. 108, 207003 (2012).
- (15) H. Yanagi, R. Kawamura, T. Kamiya, Y. Kamihara, M. Hirano, T. Nakamura, H. Osawa, and H. Hosono, Itinerant ferromagnetism in the layered crystals LaCoOX (X = P, As), Phys. Rev. B 77, 224431 (2008).
- (16) G. Xu, W. Ming, Y. Yao, X. Dai, S.-C. Zhang, and Z. Fang, Doping-dependent phase diagram of LaOMAs (M = V – Cu) and electron-type superconductivity near ferromagnetic instability, Europhys. Lett. 82, 67002 (2008).
- (17) G. Prando, P. Bonfà, G. Profeta, R. Khasanov, F. Bernardini, M. Mazzani, E. M. Brüning, A. Pal, V. P. S. Awana, H.-J. Grafe, B. Büchner, R. De Renzi, P. Carretta, and S. Sanna, Common effect of chemical and external pressures on the magnetic properties of RCoPO (R = La, Pr), Phys. Rev. B 87, 064401 (2013).
- (18) G. Prando, G. Profeta, A. Continenza, R. Khasanov, A. Pal, V. P. S. Awana, B. Büchner, and S. Sanna, Common effect of chemical and external pressures on the magnetic properties of CoPO ( = La, Pr, Nd, Sm). II., Phys. Rev. B 92, 144414 (2015).
- (19) K. Miyoshi, E. Kojima, S. Ogawa, Y. Shimojo, and J. Takeuchi, Superconductivity under pressure in RFeAsO1-xFx (R = La, Ce–Sm) by dc magnetization measurements, Phys. Rev. B 87, 235111 (2013).
- (20) G. Prando, Th. Hartmann, W. Schottenhamel, Z. Guguchia, S. Sanna, F. Ahn, I. Nekrasov, C. G. F. Blum, A. U. B. Wolter, S. Wurmehl, R. Khasanov, I. Eremin, and B. Büchner, Mutual Independence of Critical Temperature and Superfluid Density under Pressure in Optimally Electron-Doped Superconducting LaFeAsO1-xFx, Phys. Rev. Lett. 114, 247004 (2015).
- (21) C. P. Poole, Electron Spin Resonance. A Comprehensive Treatise on Experimental Techniques (Wiley, New York, 1983).
- (22) V. Kataev, K.-Y. Choi, M. Grüninger, U. Ammerahl, B. Büchner, A. Freimuth, and A. Revcolevschi, Strong Anisotropy of Superexchange in the Copper-Oxygen Chains of La14-xCaxCu24O41, Phys. Rev. Lett. 86, 2882 (2001).
- (23) H.-A. Krug von Nidda, L. E. Svistov, M. V. Eremin, R. M. Eremina, A. Loidl, V. Kataev, A. Validov, A. Prokofiev, and W. Aßmus, Anisotropic exchange in LiCuVO4 probed by ESR, Phys. Rev. B 65, 134445 (2002).
- (24) Z. Guguchia, A. Shengelaya, H. Keller, J. Köhler, and A. Bussmann-Holder, Tuning the structural instability of SrTiO3 by Eu doping: The phase diagram of Sr1-xEuxTiO3, Phys. Rev. B 85, 134113 (2012).
- (25) J. P. Joshi and S.V. Bhat, On the analysis of broad Dysonian electron paramagnetic resonance spectra, J. Magn. Res. 168, 284 (2004).
- (26) A. Shengelaya, G.-M. Zhao, H. Keller, and K. A. Müller, EPR Evidence of Jahn-Teller Polaron Formation in La1-xCaxMnO3+y, Phys. Rev. Lett. 77, 5296 (1996).
- (27) S. E. Barnes, Theory of electron spin resonance of magnetic ions in metals, Adv. Phys. 30, 801 (1981).
- (28) J. D. Jackson, Classical Electrodynamics (Wiley, 1999).
- (29) R. H. Taylor and B. R. Coles, Electron spin resonance studies of the onset of magnetic order in intermetallic compounds, J. Phys. F: Metal Phys. 5, 121 (1975).
- (30) C. P. Slichter, Principles of Magnetic Resonance (Spinger, Berlin-Heidelberg, 1990).
- (31) C. Golze, A. Alfonsov, R. Klingeler, B. Büchner, V. Kataev, C. Mennerich, H.-H. Klauss, M. Goiran, J.-M. Broto, H. Rakoto, S. Demeshko, G. Leibeling, and F. Meyer, Tuning the magnetic ground state of a tetranuclear nickel(II) molecular complex by high magnetic fields, Phys. Rev. B 73, 224403 (2006).
- (32) A. Pal, S. S. Mehdi, M. Husain, B. Gahtori, and V. P. S. Awana, Complex magnetism and magneto-transport of RECoPO (RE = La, Nd, and Sm), J. Appl. Phys. 110, 103913 (2011).
- (33) I. I. Mazin, M. D. Johannes, L. Boeri, K. Koepernik, and D. J. Singh, Problems with reconciling density functional theory calculations with experiment in ferropnictides, Phys. Rev. B 78, 085104 (2008).
- (34) P. Hansmann, R. Arita, A. Toschi, S. Sakai, G. Sangiovanni, and K. Held, Dichotomy between large local and small ordered magnetic moments in iron-based superconductors, Phys. Rev. Lett. 104, 197002 (2010).
- (35) Z. P. Yin, K. Haule, and G. Kotliar, Kinetic frustration and the nature of the magnetic and paramagnetic states in iron pnictides and iron chalcogenides, Nat. Mater. 10, 932 (2011).
- (36) L. De’ Medici, Weak and Strong Correlations in Fe Superconductors, Springer Series in Materials Science 211, 409 (Springer, Berlin, 2015).
- (37) N. W. Ashcroft and N. D. Mermin, Solid State Physics (Harcourt, 1976).
- (38) C. Kittel, On the Theory of Ferromagnetic Resonance Absorption, Phys. Rev. 73, 155 (1948).
- (39) S. V. Vonsovskii (ed.), Ferromagnetic Resonance (Pergamon Press, Oxford, 1966).
- (40) A. Abragam and B. Bleaney, Electron Paramagnetic Resonance of Transition Ions (Oxford University Press, 1970).
- (41) R. H. Taylor, Electron spin resonance of magnetic ions in metals. An experimental review, Adv. Phys. 24, 681 (1975).
- (42) C. Sürig, K. A. Hempel, R. Müller, and P. Görnert, Investigations on Zn2-xCox W-type hexaferrite powders at low temperatures by ferromagnetic resonance, J. Magn. Magn. Mat. 150, 270 (1995).
- (43) E. A. Turov, Physical Properties of Magnetically Ordered Crystals (Academic Press, London, 1965).
- (44) B. D. Cullity and C. D. Graham, Introduction to Magnetic Materials (I.E.E.E. Press – Wiley, London, 2009).
- (45) P. Jeglič, J.-W. G. Bos, A. Zorko, M. Brunelli, K. Koch, H. Rosner, S. Margadonna, and D. Arčon, Influence of the Nd 4f states on the magnetic behavior and the electric field gradient of the oxypnictides superconductors NdFeAsO1?xFx, Phys. Rev. B 79, 094515 (2009).
- (46) G. Prando, P. Carretta, A. Rigamonti, S. Sanna, A. Palenzona, M. Putti, and M. Tropeano, 19F NMR study of the coupling between 4f and itinerant electrons in the pnictide superconductors SmFeAsO1?xFx (0.15 x 0.2), Phys. Rev. B 81, 100508(R) (2010).
- (47) A. Alfonsov, F. Murányi, V. Kataev, G. Lang, N. Leps, L. Wang, R. Klingeler, A. Kondrat, C. Hess, S. Wurmehl, A. Köhler, G. Behr, S. Hampel, M. Deutschmann, S. Katrych, N. D. Zhigadlo, Z. Bukowski, J. Karpinski, and B. Büchner, Phys. Rev. B 83, 094526 (2011).