Current address: ]Centro Brasileiro de Pesquisas Físicas, Rua Doutor Xavier Sigaud 150, CEP 22290-180, Brazil.
Converse effect of pressure on quadrupolar and magnetic transition in Ce3Pd20Si6
Abstract
The heavy fermion compound Ce3Pd20Si6 displays unconventional quantum criticality as the lower of two consecutive phase transitions is fully suppressed by magnetic field. Here we report on the effects of pressure as additional tuning parameter. Specific heat and electrical resistivity measurements reveal a converse effect of pressure on the two transitions, leading to the merging of both transitions at 6.2 kbar. The field-induced quantum criticality is robust under pressure tuning. We rationalize our findings within an extended version of the global phase diagram for antiferromagnetic heavy fermion quantum criticality.
pacs:
71.27.+a; 71.10.Hf; 62.50.-p; 75.30.KzI Introduction
Quantum criticality in heavy fermion systems continues to attract great attention [Löhneysen et al., 2007; Gegenwart et al., 2008; Si, 2010; Si and Paschen, 2013]. The ground state of these materials is determined by the competition between the RudermanKittelKasuyaYosida (RKKY) interaction and the Kondo interaction. When the RKKY interaction dominates a magnetic, typically antiferromagnetic, ground state is realized. The opposite case results in a paramagnetic heavy fermion state. By applying a non-thermal control parameter such as pressure or magnetic field, transitions between the two phases can frequently be realized. If the suppression of the finite-temperature phase transition remains continuous a quantum critical point (QCP) is accessed.
Various scenarios have been proposed to describe quantum critical behavior. The spin-density wave scenario [Hertz, 1976; Millis, 1993; Moriya and Takimoto, 1995] attributes all effects to the suppression of the order parameter and the critical fluctuations associated with it. Other scenarios assume that a second mode is critical at the QCP. In the theory of local quantum criticality [Si et al., 2001] this is the Kondo interaction. This Kondo breakdown scenario was argued to describe the quantum criticality of various heavy fermion (HF) compounds [Löhneysen et al., 2007,Gegenwart et al., 2008,Si and Paschen, 2013] much better than the spin-density wave scenario. The Kondo breakdown at the border between an antiferromagnetic (AF) and paramagnetic (PM) state requires the presence of quasi-two dimensional spin fluctuations. These are not unlikely to be present in systems such as YbRh2Si2 [Trovarelli et al., 2000,Custers et al., 2003], CeRhIn5 [Hegger et al., 2000] or CeCu6-xAux [von Löhneysen, 1996], which show strong magnetic anisotropy. More recently, signatures of Kondo breakdown were observed in the magnetic-field induced QCP of the cubic system Ce3Pd20Si6 [Custers et al., 2012]. Since this system is isotropic at the QCP, this raised questions about the role of dimensionality in Kondo breakdown quantum criticality. One way to reconcile the experimental observation with the suggested global phase diagram for AF heavy fermion quantum criticality [Si, 2010] is to assume that field-induced magnetic order is present within the putative antiferroquadrupolar phase below [Si and Paschen, 2013,Custers et al., 2012]. In this case, the Kondo breakdown transition could be seen as a small Fermi surface to large Fermi surface transition within the AF portion of the global phase diagram at low values of the frustration parameter that corresponds to the 3D limit [Custers et al., 2012].
The cubic HF compound Ce3Pd20Si6 crystallizes in a Cr23C6-type structure with space group [Gribanov et al., 1994]. The Ce atoms in Ce3Pd20Si6 occupy two sites with different cubic point symmetry. At the 4 site ( symmetry) the Ce atoms are positioned inside a cage of 12 Pd atoms and 6 Si atoms whereas at the 8 site ( symmetry) the Ce atoms are surrounded by 16 Pd atoms. In polycrystalline samples, two successive phase transitions are observed at = 0.3 K and = 0.5 K and have tentatively been attributed to AF and to antiferroquadrupolar (AFQ) order, respectively [Strydom et al., 2006]. The crystal electric field (CEF) scheme at the two Ce sites is still a matter of debate [Goto et al., 2009; Mitamura et al., 2010; Deen et al., 2010]. The suppression of to zero at 0.9 T leads to a field-induced QCP with Kondo breakdown [Custers et al., 2012]. In polycrystalline samples, signatures of can be discerned in magnetic fields up to at least 10 T (Ref. [Custers et al., 2012]). Recent investigations on single crystals under magnetic field () revealed that at fields above 1 T, is anisotropic with respect to the direction along which is applied [Goto et al., 2009,Mitamura et al., 2010,Ono et al., 2013,Martelli et al., 2014].
An alternative route to quantum criticality in Ce3Pd20Si6 might be to use pressure as control parameter. The critical pressure necessary to fully suppress was estimated to be 5 kbar [Prokofiev et al., 2009]. Electrical resistivity and specific heat investigations on a lower quality polycrystalline Ce3Pd20Si6 sample up to 80 kbar (8 GPa) in temperatures down to 0.5 K revealed an increase of the Kondo temperature () with pressure [Hashiguchi et al., 2000]. However, no information about the pressure evolution of or could be inferred from those measurements. More recently, electrical resistivity measurements up to 40 kbar in the isostructural germanide compound Ce3Pd20Ge6 revealed that both the AF ( = 0.75 K) and the ferroquadrupolar ( = 1.2 K) transition show a tendency to disappear at pressures higher than 50 kbar [Hidaka et al., 2012].
Here, we present a study of the pressuremagnetic fieldtemperature phase diagram of Ce3Pd20Si6 using hydrostatic pressure conditions. Our aim is to investigate how and evolve with pressure in the range where the pressure-tuned AF QCP was predicted [Prokofiev et al., 2009]. We also explore whether the field induced quantum criticality is modified under pressure.
II Experimental
Polycrystalline Ce3Pd20Si6 samples were synthesized by melting Ce, Pd and Si in a horizontal water-cooled copper boat using high-frequency heating. Details on the synthesis and characterization are described elsewhere [Prokofiev et al., 2009]. The sample used for the present study is of the same quality as those reported in previous works [Custers et al., 2012,Strydom et al., 2006,Prokofiev et al., 2009]. Electrical resistivity and specific heat measurements were performed in a CuBe piston-cylinder pressure cell for pressure up to 6.2 kbar, with kerosene as pressure transmitting medium and Pb as in-situ manometer. All electrical contacts were spot welded onto the same piece of sample with dimensions 3.0 mm2.0 mm0.25 mm. The conventional four-probe AC method was used to measure electrical resistivity. Specific heat was measured by AC calorimetry. For the latter, a constantan wire and a pair of Au-Fe(0.07) and chromel wires of 25 m diameter were used as a heater and thermocouple, respectively. An oscillating excitation current with 0.5 Hz and = 0.2 mA was applied to the sample heater. The sample modulation temperature was read out by a lock-in amplifier in a second harmonic mode and recorded as pick-up voltage (). The inverse of this quantity is approximately proportional to the sample’s specific heat [Larrea et al., 2013]. The sample temperature was corrected for a DC offset due to Joule heating by separately measuring the temperature signal with a DC nanovoltmeter. This correction was found to be at maximum 0.02 K at the lowest temperature. The pressure cell was inserted into a 3He/4He dilution refrigerator with a superconducting magnet to measure both and down to 0.05 K and under magnetic field up to 14 T. The magnetoresistance measurements at constant temperature and pressure were carried out with a field sweep of 50 mT/min and with a temperature stabilization of 1 mK.
III Results and discussion
III.1 Electrical transport
The temperature dependence of the electrical resistivity (), normalized to the room temperature value () at different pressures (), is shown in Fig. 1. For clarity data are shifted by fixed amounts (see caption). With decreasing temperature, for all pressures, first decreases until it reaches a local minimum around 120 K, then increases roughly as -ln until it develops a broad maximum around . Below , falls rapidly, showing an -shaped profile below 3 K, with a broad hump around 1 K. This profile is similar to data previously reported for 80 kbar and 0.5 K in a sample that showed a lower and no clear sign of quadrupolar order [Hashiguchi et al., 2000].
The maximum and the kink might either be due to Kondo scattering from the excited and ground state crystal electric field levels, respectively, as expected in the Cornut and Coqblin scenario [Cornut and Coqblin, 1972], or due to Kondo scattering from the two different Ce sites of the crystal structure as suggested previously [Hashiguchi et al., 2000,Hidaka et al., 2012]. In either case, we expect the temperature of the maximum () to contain information on the Kondo temperature of at least one site. We determine in Fig. 1 as the temperature where is zero. increases slightly with pressure, in particular above 4 kbar (Fig. 4a). A positive slope was also reported at higher pressures [Hashiguchi et al., 2000]. Assuming that the relatively low pressure does not sizably affect the CEF level scheme, the increase of with may be associated with an increase of the Kondo interaction due to an enhancement of the effective hybridization between the Ce 4 and the conduction electrons.
The electrical resistivity at different pressures at the lowest temperatures is shown in Fig. 2a. For all pressures, first decreases gradually with decreasing temperature down to 0.6 K, then more steeply below 0.6 K, and finally tends to saturate below 0.15 K. This behavior is typical of antiferromagnetic heavy fermion metals where the magnetic ordering temperature is associated either with the position of a kink in or with the temperature where the first derivative of the electrical resistivity () shows a maximum [Löhneysen et al., 2007]. Here, we use the latter criterion to determine , as is shown in Fig. 2b. At 0 kbar, we can distinguish a clear maximum at 0.3 K and a shoulder at = 0.5 K. and are tentatively assigned to the onset of antiferromagnetic and antiferroquadrupolar order, respectively. With increasing pressure up to 3.6 kbar, these two features follow converse trends, i.e., is enhanced whereas is reduced (Fig. 4d, open symbols). For pressures above 4.9 kbar, broadens. This is likely due to the fact and are too close to be distinguished. increases in the whole investigated pressure range, with a small step-like feature at 3.2 kbar. At the same pressure a pronounced increase of the residual resistance ratio RRR is observed (Fig. 4a).
The relative change of electrical resistivity from 0 to , , as well as the residual resistivity (Fig. 2a) are plotted as a function of in Fig. 4b. was determined by least squares fitting of the data below 0.2 K to (Fig. 3). As the size of is generally considered to be a measure of the strength of the AF order [Löhneysen et al., 2007,Hegger et al., 2000,Larrea et al., 2013,Seo et al., 2012,Rosch, 1999], its increase with pressure confirms that pressure stabilizes the AF order, at least up to 6.2 kbar.
To determine the pressuremagnetic fieldtemperature phase diagram, isothermal magnetoresistance (MR) measurements were done at different pressures (Fig. 5). For all pressures and for the lowest temperature 0.05 K, MR() first increases up to a maximum and then decreases. In Ref. [Custers et al., 2012] was determined by fitting a phenomenological function to MR(). Here, for simplicity, we define the position of the maximum as the magnetic field for the suppression of AF order at constant temperature. As temperature increases, is reduced and completely suppressed above . isobars define the boundary of the AF phase for different pressures (Fig. 6).
We can interpret these data also as data and use them to estimate the critical field ( ( 0)) with the mean field expression (full lines in Fig. 6). increases from 0.75(8) T at 0 to about 0.91(2) T at 4.9 kbar. This increase of with pressure supports the strengthening of the AF order with pressure.
III.2 Specific heat
Our specific heat measurements provide valuable independent information about the evolution of the two phase transitions under pressure. According to the heat dissipation equation, the sample’s specific heat () is either proportional to the inverse of the AC-pick up voltage signal () or to the phase shift () measured directly by AC calorimetry [Wilhelm, 2003; Eberhard, 1997; Knebel et al., 2009]. In the pressure range investigated here, the employed thermocouple and heater have negligible pressure variation [Choi et al., 2002] and we can detect the absolute value of phase transition temperatures with an accuracy of 4 . An independent specific heat measurement was performed at 0.1 Hz to estimate the addenda contribution. The specific heat measured in the pressure cell at 0 kbar agrees with the one measured under adiabatic conditions [Prokofiev et al., 2009] (below 0.2 K) if is scaled by a factor 1.5. This calibrates the absolute values of the AC specific heat for all pressures.
Figure 7 shows the temperature dependence of the sample’s specific heat at different pressures. At 0 kbar, two anomalies are observed at 0.3 K and 0.5 K, associated tentatively with an antiferromagnetic and an antiferroquadrupolar transition, respectively. and are determined as the temperatures where has local maxima (not shown). and are plotted in Fig. 4d. The increase of has opposite effects on the two anomalies: increases whereas decreases. At 6.2 kbar, both transitions seem to merge, being essentially undistinguishable at pressures close to 6.2 kbar.
The application of magnetic field helps to identify both transitions because field is known to suppress and to enhance at 0 kbar and low fields [Custers et al., 2012]. Figure 8 shows at 4.9 and 6.2 kbar, in different magnetic fields. The frequency of the excitation current for our AC calorimeter was kept constant for all temperature scans. No measurements were done at lower frequencies to estimate the addenda contribution. Thus, Fig. 8 depicts isofield curves without the substraction of an addenda contribution. As we only extract phase transition temperatures from these data this procedure is fully justified. At 4.9 kbar and 0 T (Fig. 8a), shows two different anomalies at 0.37 K and 0.43 K. The lower anomaly is monotonically shifted to lower temperatures and is completely suppressed at a field slightly above 0.8 T. The upper transition is continuously shifted to higher temperatures. In analogy with the data at 0 this identifies the lower and upper transitions as and , respectively. Similar behavior is observed at 6.2 kbar (Fig. 8b) which confirms that the single broadened anomaly indeed still contains both transitions. and are plotted in the pressuremagnetic fieldtemperature phase diagram in Fig. 6. obtained from our measurements is in good agreement with the results from our MR measurements. For 6.2 kbar, where no MR data are available, we use the same mean field fit (solid line in Fig. 6) as above, and obtain a critical field 1.32(3) T. Thus, the AF order is strengthened under pressure up to at least 6.2 kbar.
III.3 Quantum criticality under and
The pressuremagnetic fieldtemperature phase diagram (Fig. 6) hosts a line of zero temperature phase transitions from which quantum critical behavior might emerge. This has been shown to be the case for ( 0) 0.9 T [Custers et al., 2012]. Here, we investigate the behavior at 4.9 kbar, a pressure where and are close to each other (0.37 and 0.41, respectively) in zero magnetic field. Figure 9a shows the corresponding electrical resistivity data at different magnetic fields. Similar to in Fig. 2a, an -shaped curve below 0.7 K indicates the presence of AF order below from 0 up to 0.8 T. is estimated as the temperature where has a maximum (marked with solid arrows in Fig. 9b). The values are in good agreement with the values extracted above from MR and measurements (Fig. 6). For 1 T, the low temperature maximum in is absent. Thus 1 T is above the critical field for the suppression of the AF order. is seen as a shoulder in at higher temperatures and finite fields (dashed arrows in Fig. 9b). It shifts to higher temperatures with increasing field, in agreement with extracted above from at 4.9 kbar (Fig. 8a).
To search for signs of field-induced quantum criticality at 4.9 kbar we first analyse the Landau-Fermi liquid (LFL) behavior. best explains the lowest temperature electrical resistivity, indicating the absence of significant magnon scattering and the dominance of LFL behavior in the various phases. The coefficient is determined by a least squares linear fit of plotted vs. (not shown) up to the temperature where the fit deviates by more than 0.2 from the data. This temperature () is indicated by arrows in Fig. 9. The values and obtained from these fits are plotted in Fig. 10a,b. For comparison we also show the and values of a sample at ambient pressure, which has a slightly higher AF transition temperature ( 0.35 K) [K.-A. Lorenzer, 2012].
At 4.9 kbar, the strong enhancement of from 0 to 0.8 T and the smaller value at 1 T point to a QCP between 0.8 and 1 T. A fit using the expression [Moriya and Takimoto, 1995] describes the enhancement of below 1 T very well (solid line in Fig. 9a) with 0.91 T and -0.42. A similar value of and 0.87 T was reported for at ambient pressure (Fig. 10a) [K.-A. Lorenzer, 2012]. Moreover, at 4.9 kbar, the residual resistivity is only slightly enhanced towards , with 4.92 cm at 0 T and 5.6 cm at 0.8 T (Fig. 10b). We observe that the relative enhancement from 0 T up to 0.8 T is = 0.03 and = 2.3 for 0 kbar, and = 0.13 and = 1.2 for 4.9 kbar.
Finally, we analyse deviations from the LFL behavior. at 4.9 kbar and 1.0 T is linear in temperature from below 0.18 K to 0.6 K. The range of linear -dependence slightly shrinks at 0.8 T where it persists from below 0.2 K up to 0.56 K. The non-Fermi liquid temperature dependence has frequently been observed in systems with Kondo breakdown QCP [Löhneysen et al., 2007,Paschen et al., 2007]. The latter together with the enhancement of and towards 0.91 T indicates a field-induced QCP for 4.9 kbar, that is similar to one seen at ambient pressure.
III.4 Temperature-pressure phase diagram
The temperaturepressure () phase diagram in Fig. 4d shows the converse effects of pressure of and : increases with pressure ( 6.2 kbar) +0.1 K) whereas decreases with pressure ( -0.1 K). This phase diagram is distinctly different from the phase diagrams reported for the related compounds CeB6 [Brandt et al., 1985] and Ce3Pd20Ge6 [Hidaka et al., 2012]. These are cubic heavy fermion compounds that were shown to undergo magnetic and quadrupolar transitions [For a review see Silke Paschen and Julio Larrea, 2014]. In CeB6, decreases whereas increases with pressure up to 10 kbar [Brandt et al., 1985], which is a trend opposite to what we observe for Ce3Pd20Si6. For Ce3Pd20Ge6, and at first increase and subsequently decrease with pressure [Hidaka et al., 2012]. In spite of the similarities of the zero-pressuretemperaturefield phase diagrams of all these compounds, this points to different origins thereof.
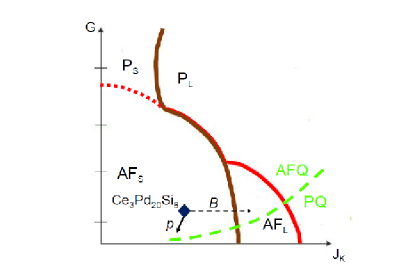
We now try to rationalize our findings within the framework of the global phase diagram for antiferromagnetic heavy fermion compounds [Si, 2010,Custers et al., 2012]. This is a 0 two-dimensional phase diagram spanned by the magnetic frustration parameter and the Kondo coupling constant . In systems with antiferromagnetic order, the antiferromagnetic phase expands with decreasing . It has been previously shown that the ground state of Ce3Pd20Si6 at 0 and 0 is located in the AF ordered regime with small Fermi surface (AFS). At 0, drives Ce3Pd20Si6 to another ordered (presumably still AF) state with a large Fermi surface (AFL), passing through a Kondo breakdown QCP. This AF-QCP has been associated with an increase of at constant [Custers et al., 2012]. Our experiments revealed that the field to reach this QCP is increased with pressure. This suggests that pressure drives Ce3Pd20Si6 even deeper into the antiferromagnetic phase (Fig. 11). Simultaneous application of pressure and field induces a quantum critical point with quantum critical resistivity characteristics very similar to the 0 case. This indicates that the criticality remains dominated by even though is sizably decreased by pressure. The quadrupolar phase boundary is not captured by the present version of the theoretical global phase diagram. Our experiments reveal that its dependence on and is very different from the phase boundary between AFS and AFL. To visualize this, we tentatively draw a line of quantum critical points between an AFQ phase and a phase without quadrupolar order (PQ, Fig. 11). It shows that pressure tuning ultimately exposes a quadrupolar QCP within an AF background, which is an exciting prospect for future research.
IV Conclusions
To summarize, we have investigated the pressure evolution of the putative antiferromagnetic and antiferro-quadrupolar orders in Ce3Pd20Si6 using electrical resistivity, magnetoresistance and specific heat measurements. Our results reveal an increase of the antiferromagnetic () and a decrease of the antiferroquadroplar () ordering temperatures with pressure and the merging of both transitions at about 6.2 kbar. This converse effect of pressure on and is rather unique in cubic heavy fermion compounds.
At pressures where , the application of magnetic field induces a QCP, with a critical field that is larger than at 0 but with the same quantum critical behavior. Our findings are consistent with pressure moving the location of Ce3Pd20Si6 in the global phase diagram for quantum critical heavy fermion compounds towards lower values of the frustration parameter and the Kondo coupling . This would imply that the role of pressure is to enhance the three-dimensional character of the low-lying magnetic and quadrupolar interactions.
Finally, our experimental findings qualify pressure as ideal tool to disentangle effects of dipolar and higher multipolar ordering, and quantum criticality emerging from their suppression. This will likely trigger further experiments in higher pressures.
Acknowledgements.
We acknowledge the European Research Council (ERC Advanced Grant No 227378) and the Austrian Science Fund (FWF Grant I623-N16) for financial support. JLJ acknowledges the FRC/URC of UJ for funding of a Postdoctoral Fellowship under joint supervision of SP and AMS. JLJ also acknowledges the CNPq/MCTI-Brazil and VM acknowledges FAPERJ (Nota 10).References
- Löhneysen et al. (2007) H. v. Löhneysen, A. Rosch, M. Vojta, and P. Wölfle, Rev. Mod. Phys. 79, 1015 (2007).
- Gegenwart et al. (2008) P. Gegenwart, Q. Si, and F. Steglich, Nature Phys. 4, 186 (2008).
- Si (2010) Q. Si, physica status solidi (b) 247, 476 (2010).
- Si and Paschen (2013) Q. Si and S. Paschen, physica status solidi (b) 250, 425 (2013).
- Hertz (1976) J. A. Hertz, Phys. Rev. B 14, 1165 (1976).
- Millis (1993) A. J. Millis, Phys. Rev. B 48, 7183 (1993).
- Moriya and Takimoto (1995) T. Moriya and T. Takimoto, J. Phys. Soc. Jpn. 64, 960 (1995).
- Si et al. (2001) Q. Si, S. Rabello, K. Ingersent, and J. L. Smith, Nature 413, 804 (2001).
- Trovarelli et al. (2000) O. Trovarelli, C. Geibel, S. Mederle, C. Langhammer, F. M. Grosche, P. Gegenwart, M. Lang, G. Sparn, and F. Steglich, Phys. Rev. Lett. 85, 626 (2000).
- Custers et al. (2003) J. Custers, P. Gegenwart, H. Wilhelm, K. Neumaier, Y. Tokiwa, O. Trovarelli, C. Geibel, F. Steglich, C. Pépin, and P. Coleman, Nature 424, 524 (2003).
- Hegger et al. (2000) H. Hegger, C. Petrovic, E. G. Moshopoulou, M. F. Hundley, J. L. Sarrao, Z. Fisk, and J. D. Thompson, Phys. Rev. Lett. 84, 4986 (2000).
- von Löhneysen (1996) H. von Löhneysen, J. Phys. Cond. Mat. 8, 9689 (1996).
- Custers et al. (2012) J. Custers, K. Lorenzer, M. Müller, A. Prokofiev, A. Sidorenko, H. Winkler, A. M. Strydom, Y. Shimura, T. Sakakibara, R. Yu, Q. Si, and S. Paschen, Nature Mater. 11, 189 (2012).
- Gribanov et al. (1994) A. V. Gribanov, Y. D. Seropegin, and O. I. Bodak, J. Alloys Compd. 204, L9 (1994).
- Strydom et al. (2006) A. Strydom, A. Pikul, F. Steglich, and S. Paschen, J. Phys.: Conf. Series 51, 239 (2006).
- Goto et al. (2009) T. Goto, T. Watanabe, S. Tsuduku, H. Kobayashi, Y. Nemoto, T. Yanagisawa, M. Akatsu, G. Ano, O. Suzuki, N. Takeda, A. Dönni, and H. Kitazawa, J. Phys. Soc. Jpn. 78, 024716 (2009).
- Mitamura et al. (2010) H. Mitamura, T. Tayama, T. Sakakibara, S. Tsuduku, G. Ano, I. Ishii, M. Akatsu, Y. Nemoto, T. Goto, A. Kikkawa, and H. Kitazawa, J. Phys. Soc. Jpn. 79, 074712 (2010).
- Deen et al. (2010) P. P. Deen, A. M. Strydom, S. Paschen, D. T. Adroja, W. Kockelmann, and S. Rols, Phys. Rev. B 81, 064427 (2010).
- Ono et al. (2013) H. Ono, T. Nakano, N. Takeda, G. Ano, M. Akatsu, Y. Nemoto, T. Goto, A. Dönni, and H. Kitazawa, J. Phys. Cond. Mat. 25, 126003 (2013).
- Martelli et al. (2014) V. Martelli, J. Larrea, J. Hänel, K.-A. Lorenzer, A. Prokofiev, and S. Paschen, J. Phys. Soc. Jpn. (Conf. Proc) 3, 012008 (2014).
- Prokofiev et al. (2009) A. Prokofiev, J. Custers, M. Kriegisch, S. Laumann, M. Müller, H. Sassik, R. Svagera, M. Waas, K. Neumaier, A. M. Strydom, and S. Paschen, Phys. Rev. B 80, 235107 (2009).
- Hashiguchi et al. (2000) T. Hashiguchi, N. Takeda, J. Kitagawa, N. Wada, S. Takayanagi, M. Ishikawa, and N. Mōri, J. Phys. Soc. Jpn. 69, 667 (2000).
- Hidaka et al. (2012) H. Hidaka, S. Ramos, E. Hering, M. Fontes, E. Saitovitch, S. Otani, T. Wakabayashi, Y. Shimizu, T. Yanagisawa, and H. Amitsuka, J. Phys.: Conf. Series 391, 012019 (2012).
- Larrea et al. (2013) J. Larrea, J. Teyssier, H. Rnnow, K.-A. Lorenzer, and S. Paschen, physica status solidi (b) 250, 511 (2013).
- Cornut and Coqblin (1972) B. Cornut and B. Coqblin, Phys. Rev. B 5, 4541 (1972).
- Seo et al. (2012) S. Seo, V. A. Sidorov, H. Lee, D. Jang, Z. Fisk, J. D. Thompson, and T. Park, Phys. Rev. B 85, 205145 (2012).
- Rosch (1999) A. Rosch, Phys. Rev. Lett. 82, 4280 (1999).
- Wilhelm (2003) H. Wilhelm, Advances in Solid State Physics 43, 889 (2003).
- Eberhard (1997) G. Eberhard, Thermochim. Acta 304, 1 (1997).
- Knebel et al. (2009) G. Knebel, D. Aoki, G. Lapertot, B. Salce, J. Flouquet, T. Kawai, H. Muranaka, R. Settai, and Y. Ōnuki, J. Phys. Soc. Jpn. 78, 074714 (2009).
- Choi et al. (2002) E. Choi, H. Kang, Y. Jo, and W. Kang, Rev. Sci. Instrum. 73, 2999 (2002).
- K.-A. Lorenzer (2012) K.-A. Lorenzer, Ph.D. thesis, Vienna University of Technology (2012).
- Paschen et al. (2007) S. Paschen, M. Müller, J. Custers, M. Kriegisch, A. Prokofiev, G. Hilscher, W. Steiner, A. Pikul, F. Steglich, and A. Strydom, J. Magn. Magn. Mater. 316, 90 (2007).
- Brandt et al. (1985) N. Brandt, V. Moshchalkov, S. Pashkevich, M. Vybornov, M. Semenov, T. Kolobyanina, E. Konovalova, and Y. B. Paderno, Solid state Commun. 56, 937 (1985).
- For a review see Silke Paschen and Julio Larrea (2014) For a review see Silke Paschen and Julio Larrea, J. Phys. Soc. Jpn. 83, 061004 (2014).