Signs of magnetic acceleration and multi-zone emission in GRB 080825C
Abstract
One of the major results from the study of gamma-ray bursts with the Fermi Gamma-ray Space Telescope has been the confirmation that several emission components can be present in the energy spectrum. Here we reanalyse the spectrum of GRB 080825C using data from the Fermi LAT and GBM instruments. Although fairly weak, it is the first gamma-ray burst detected by the Fermi-LAT. We improve on the original analysis by using the LAT Low Energy (LLE) events covering the 30–100 MeV band. We find evidence of an additional component above the main emission peak (modelled using a Band function) with a significance of in 2 out of the 4 time bins. The component is well fitted by a Planck function, but shows unusual behaviour: the peak energy increases in the prompt emission phase, reaching energies of several MeV. This is the first time such a trend has been seen, and implies that the origin of this component is different from those previously detected. We suggest that the two spectral components likely arise in different regions of the outflow, and that strong constraints can be achieved by assuming one of them originates from the photosphere. The most promising model appears to be that the high-energy peak is the result of photospheric emission in a Poynting flux dominated outflow where the magnetisation increases with time.
keywords:
gamma-ray bursts: GRB 080825C – methods: data analysis – radiation mechanisms: general1 Introduction
The launch of the Fermi gamma-ray satellite has led to much progress in the study of gamma-ray bursts (GRBs). Spectral features hinted at in the CGRO BATSE and EGRET data have been fully confirmed and their properties further studied: for example the presence of an extra component modeled as a power law rising at high energies and lasting for longer than the bulk of the keV–MeV emission (González et al., 2003; Ackermann et al., 2013); or a low-energy (tens of keV) thermal component modelled with a Planck function (Ryde, 2004; Axelsson et al., 2012). Moreover, new spectral features have been discovered thanks to the unprecedented energy coverage for transient events (8 keV to more than 300 GeV) of Fermi and to its timing capabilities. For example in the case of GRB 090926A (Ackermann et al., 2011) the high-energy power-law component shows a significant cut-off at about 1.5 GeV. In the case of GRB 100724B a cut-off of the Band function (Band et al., 1993) high-energy slope has been observed at about 40 MeV (Ackermann et al., 2013).
While extra components can be detected in bright bursts, as the photon statistics decrease so does the statistical significance of such deviations from the Band function. The results from the LAT (Large Area Telescope, Atwood et al., 2009) GRB catalog (Ackermann et al., 2013) demonstrate that the brighter bursts indeed have more complex spectra with respect to the simple Band function. In dimmer bursts, the presence of these extra components cannot be excluded, as they might not be detectable due to inadequate photon statistics. The search for extra components in the dimmer bursts will therefore result in less significant detections, making the identification of such spectral features more difficult. It is not clear whether intrinsically weak GRBs are the result of different conditions in the surrounding medium, lower energy input from the central engine, or whether they reflect differences in the relativistic outflow itself, making such searches important. For the LAT GRB catalog, a lower limit of (corresponding to a chance probability ) was set in order to claim a significant deviation from a pure Band function.
In order to search for features with lower significance we initiated a systematic re-examination of the LAT-detected GRBs, to look for features with lower significance that may have been missed in previous searches due to the lack of photon statistics. In this paper we present the results from the first such reanalysis, of GRB 080825C. It is the first LAT-detected dim burst and was chosen merely on account of its detection date; no other selection criteria were applied. It is a faint burst which has previously been presented in Abdo et al. (2009). There, and in the LAT GRB catalog, the spectrum was found to be adequately described by a Band function. We begin by describing the observations and our data analysis in Sect. 2. Thereafter we present our results in Sect. 3. Finally, we discuss our findings.
2 Observations and data analysis
GRB 080825C is the first GRB detected by the LAT. It was triggered at 4:13:48 UTC on 2008 August 25 from the Fermi-GBM (Gamma-ray Burst Monitor, Meegan et al., 2009) flight software. On the basis of a dedicated off-line analysis, the GBM team localized this burst at RA = , Dec = (J2000), with a statistical uncertainty of and a standard systematic uncertainty of 2∘–3∘. The duration (the time during which 90% of the flux is received) estimated from the GBM data (8–1000 keV) is about 27 s, although after 25 s the emission detected from the BGO detectors is extremely weak. In the NaI detectors, as well as in the LAT, emission is seen up to 35 s (Abdo et al., 2009).
In our analysis we use the data from both the GBM and LAT instruments. The detectors used, the definition of the time bins and the energy intervals are the same as in the previous studies (Abdo et al., 2009; Ackermann et al., 2013). However, in our spectral analysis we also include a new type of data-set, LAT Low Energy Pass 7 (LLE) events (Pelassa et al., 2010; Ajello et al., 2014). The LLE data-set is obtained by applying different (somewhat looser) selection criteria on the reconstruction quality of the LAT events. It is thereby possible to lower the energy range of the spectral analysis in the case of transient events like GRBs, where the signal-to-noise ratio is favourable. The standard LAT data are selected with Pass 7 reconstruction and classification (Ackermann et al., 2012). We use the TRANSIENT class of Pass 7 reprocessed data111http://fermi.gsfc.nasa.gov/ssc/data/analysis/documentation/Pass7REP_usage.html.. The LAT data were selected within a region of interest of 12 degrees around the location of the burst together with a zenith angle cut of 100 degrees and a low energy cut of 100 MeV to not overlap with the LLE data. The latest GBM data products (time-tagged event, TTE) and response files are used for the spectral analysis in the keV region. Following Abdo et al. (2009) we use NaI detectors 9 and 10 and both BGO detectors. The background estimation for the GBM and the LLE data-sets were made following the procedure described in Ackermann et al. (2013), and for the standard LAT data the Background Estimator (Vasileiou, 2013) was used. The spectral analysis and the simulations to calculate the significance were performed with the xspec package, v12.8.2.
Again following Abdo et al. (2009), the GRB light curve was divided into 5 time bins from 0.0 s to 35.45 s. For each time bin a dedicated spectral analysis was performed to compare a fit using the Band function only to one with a Band function plus extra “components”: cut off power law, Planck function or an extra Band function. As test statistic we used pgstat222PG-statistics are used in the case of a Poissonian distributed signal and a Gaussian distribution of the background (full details can be found in the xspec manual)..
Due to the limitations arising from poor count statistics, we accept a lower significance than Ackermann et al. (2013) when considering the possibility of extra spectral components, and investigate deviations . The statistical results are reported together with a Band-only fit for comparison. The parameters of this model agree with the previously published ones in the first two time bins, while the results in the subsequent time bins do not match those of Abdo et al. (2009). The discrepancy is greatest for the parameter, corresponding to the high-energy index of the Band function. This change is a result of adding the LLE data, which help to better constrain this part of the spectrum.
3 Results
In the first and the third time bins there is no emission in the LAT above 100 MeV; however, we do find emission in the LLE range. In the last bin there is only very weak emission in the BGO detectors, but significant emission above 100 MeV. The time-resolved spectral analysis of (Abdo et al., 2009) identifies the Band function as the best fit in all the time bins but the last, where a power law gave the best fit.
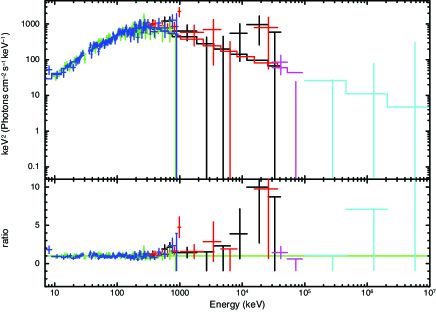
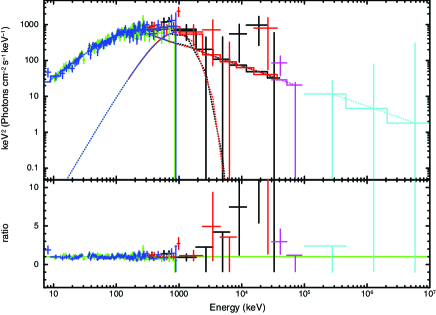
As in Abdo et al. (2009) we find that a single power law is statistically preferred over the more complex Band function in the last time bin. However, in our analysis we also find signs of a deviation from a Band function in the first and fourth time bins. In particular, there appears to be an additional feature in the spectrum at high energies (above 800 keV). We therefore add a Planck function in our model to capture this peak. This function is physically motivated as it expresses a thermal emission spectrum, and has been used to model photospheric emission at low energy (for example Axelsson et al., 2012). However, in this first step our goal is to capture the extra peak without making assumptions about its origin; possible interpretations will be discussed in Sect. 4. A Planck function is a simple function with only two degrees of freedom, which allows us to model the spectral feature with the fewest free parameters.
Determining the presence of an extra component by comparing values of pgstat (or other test statistics) is not straight-forward (see, e.g., the discussion in Protassov et al., 2002), so to derive an estimate of significance from the pgstat values we use Monte Carlo simulations. For each Band function fit, spectra were generated and fit with a single Band function as well as with a Band function plus a Planck function. The resulting distribution of pgstat values were then used to derive the chance probability to see the improvement obtained in the actual fit to the data. We find that the significance of the extra component is in the first and fourth time intervals. These fits are shown in Figs. 1 and 2.
The full results of the time-resolved spectral fits can be found in Table 1. The fact that the component is seen in both early and late stages of the burst motivates us to include an additional Planck function in all time bins. With respect to the first and the fourth time bins, in the second and third time bins the significance of the extra component drops below . This is likely due to the energy region the component passes through at these times. In the second and third time bins the second spectral peak is found in the region of 2–5 MeV, where only the BGO detectors are sensitive. Unfortunately this is also the energy range where the GBM effective area drops significantly. Therefore the lower sensitivity in this region hampers the search for significant extra components. In the fourth time bin the second peak appears between the BGO and the LLE sensitivity regions, around 15 MeV. The use of the LLE data is thus important to establish the presence of the component at later times. We note that although the significance of the extra component is not the same in all time bins, its parameters are constrained throughout (Table 1). In addition, the smooth evolution of the extra component decreases the risk that it is a spurious detection.
| Time (s) | /DoF | ||||||||
| 0.0 – 2.69 | - | 523/493 | 16 | ||||||
| 2.69 – 4.74 | - | 496/493 | 3 | ||||||
| 4.74 – 12.93 | - | 505/493 | 4 | ||||||
| 12.93 – 25.22 | - | 541/493 | 15 | ||||||
| 25.22 – 35.46 | - | - | - | - | - | 464/499 | -8 |
Since we have lowered our threshold for accepting additional components, the effects of systematic errors are a concern. We therefore investigated their impact on the spectral fits. To test the dependence of the result on the response function of the GBM instruments we used response matrices generated for locations three degrees away from the GRB position. As the component lies between different detectors in the first (NaI–BGO) and fourth (BGO–LLE) time bins we also investigated the impact of the relative difference in the detector effective areas. Independently increasing or decreasing the effective area of the GBM-NaI, GBM-BGO and LLE data sets by 15% did not give any strong effect. In all the above tests, the fitted parameter values remained in agreement with the original ones, and the significance of the extra component did not change more than marginally (the lowest significance measured was ). Discussion with the Fermi-GBM team indicated that other effects on the energy dispersion and calibration were likely below the statistical errors. The energy calibration is checked by the GBM team by the means of emission lines of the background and of solar flares (Meegan et al., 2009). The energy dispersion was studied in the on-ground calibrations (Bissaldi et al., 2009). Additionally, we see the feature in several different detectors and in different time bins. We therefore conclude that it is unlikely to be caused by systematic effects.
Because of the unusually high energy of the second peak, and the fact that the Planck function has hitherto only been seen below the Band function peak, we investigate the possibility that the two components have switched position in our fits, with the Planck function capturing the peak normally described by a Band function. However, we find that it is not possible to change places of the two components - the peak at lower energy is too wide to be well described by a Planck function. On the other hand we note that the second peak is compatible with a wider fitting function. It is for example possible to fit the spectra with two Band functions, indicating that the width of the second peak is not necessarily as narrow as a Planck function. Unfortunately, the limited statistics mean that we are unable to fully constrain the parameters of more complex models, such as two Band functions. Although we do not report these fits it is important to note that the high-energy peak can be described by a wider function than the Planck one.
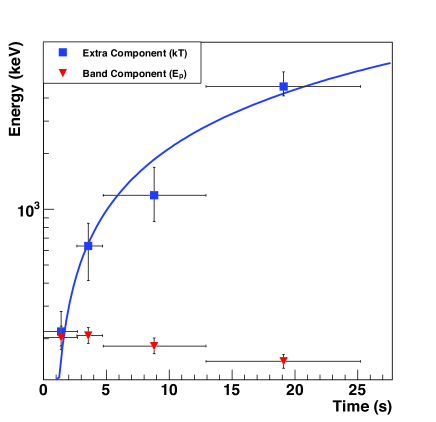
Looking at the temporal evolution throughout the burst, it is clear that the Band component and the extra peak show different behaviour. The evolution of the two peaks is shown in Fig. 3. While the low- and high-energy indices of the Band function remain stable in the first four time bins ( and ), the shows a sign of decreasing towards the end of the burst (matching the standard behaviour). The parameters of the extra component evolve throughout the emission phase: the energy of the second component increases sharply throughout the burst, reaching a value of MeV in the fourth time bin, while the normalisation decreases.
4 Discussion
As presented in the previous section, we find evidence for an extra peak in the spectrum of GRB 080825C. While the significance is only in the first and fourth time bins, the fact that the recovered peak energy follows a linear relation (blue line in Fig. 3) for all bins suggests that this spectral component is actually present during the full burst emission. A component showing such behaviour has never been observed before: the spectral characteristics and its time evolution are dissimilar to the standard hard-to-soft peak evolution (Kaneko et al., 2006; Ryde & Pe’er, 2009). As this is the first GRB in our sample to be investigated, we cannot rule out the possibility of other bursts having similar components. The population studies made so far (e.g., Ackermann et al., 2013) have not included any doubly-peaked model (e.g., Band+blackbody). Combined with the low number of bursts included (35), this means that it is difficult to draw any firm conclusions regardless of the intensity of the GRB.
Previous studies have found extra spectral components in spectra of bright GRBs, such as GRB 110721A (Axelsson et al., 2012). However, while these components are also typically modelled with Planck functions, they appear at much lower energies ( keV). They are ascribed to photospheric emission, and the temperature typically decreases with time as a broken power law. The peak of this component increases with time, in contrast to the standard hard-to-soft peak evolution (Kaneko et al., 2006; Ryde & Pe’er, 2009).
The high-energy peak in GRB 080825C is also different from the typical Band function seen in other GRBs. For instance, the peak energy generally decreases with time, such as in GRB 110721A (Axelsson et al., 2012) or GRB 130427A (Ackermann et al., 2014). The different temporal behaviour of the highest-energy peak in GRB 080825C may therefore suggest a different physical origin, for example Inverse-Compton (IC) cooling as suggested in Vurm et al. (2014). In addition to the deviating temporal behaviour, the second peak also reaches very high energies. Indeed, the energy of this peak in the fourth time bin is MeV, which is very close to the value GRB 110721 had in its first time bin ( MeV). Such high energies are similar to the modeled Inverse Compton component in the slow heating scenario presented in Pe’er et al. (2006).
If there are two components in the spectrum of GRB 080525C, it is possible to attribute them to two separate emission components. The question then arises if the emission comes from the same region, or two separate regions. In the case the emission comes from the photospheric radius we can distinguish two different scenarios. In the scenario of no dissipation below the photospheric radius the black body component of the last bin has too high temperature (in relation to its luminosity) to be the thermal emission (for example Hascoët, Daigne & Mochkovitch, 2013). Thus the Band component must be tied to thermal emission, leaving the black body component to be explained. On the other hand, if there is dissipation below the photosphere, in particular from multiple radiation-mediated shocks, a double-peaked spectrum could be produced similar to the one Keren & Levinson (2014) find. However, we note that the observed temperature evolution of the high-energy peak does not match the one predicted by Keren & Levinson (2014) of a strong shock followed by weaker ones. We therefore conclude that the mismatch disfavours this interpretation of the data together with the possibility the emission solely comes from the photospheric radius.
In the context of a two-zone scenario it is not clear which component is related with the photosphere. If the second peak is chosen, the high temperature points to the presence of magnetic dissipation in the outflow, because in the case of pure thermal emission, high temperature is correlated with high radiative efficiency (Hascoët, Daigne & Mochkovitch, 2013). In the case of a Poynting flux dominated outflow, the high-energy peak can thus be interpreted as photospheric emission in the presence of magnetic dissipation below the photosphere (as in Bégué & Pe’er, 2015). This would lead to a high temperature of the peak and give low efficiency, providing only a few percent of the burst total emission which matches the observation. Strongly magnetised outflows lead to a suppression of the photon production, which leads to the thermal peak reaching very high energies, above 8 MeV. Depending on the details of the energy deposition, the spectrum can attain shapes that are very different from, and wider than, a Wien or a Planck spectrum (for example, Bégué & Pe’er, 2015, use this scenario to explain the main Band-function component in GRB 110721A). We note that the blackbody temperature at the beginning of the emission is lower than in the last bins. In the early phases the magnetic dissipation would therefore be low, and the temperature more similar to a pure photospheric outflow without dissipation. The emission of the outflow can vary with time according to the conditions of the environment, the central engine activity and the dynamics of the emitting shells. Subsequent shells can be emitted under different conditions and therefore carry different properties like the amount of magnetisation and the bulk Lorentz factor (see Hascoët, Daigne & Mochkovitch, 2013). Magnetically dominated outflows are not expected to have shocks, but the Band component could be explained through synchrotron emission of electrons accelerated via reconnection (such as the ICMART scenario of Gao & Zhang, 2015).
It is also possible to tie the Band component to the photosphere. The high efficiency then indicates that transparency occurs in the acceleration phase, possibly in the transition between coasting and acceleration. The challenge is however to explain the blackbody component. In the scenario of inverse Compton emission suggested by Beloborodov, Hascoët and Vurm (2014), a delay between the two components is expected but this is not seen in the data. A more severe constraint is that the energy of the second component is too low (it would be expected to peak in the GeV range). A more plausible scenario is synchrotron emission from electrons accelerated in internal shocks. This scenario could be possible given that the width of this peak is not constrained to be as narrow as a Planck function.
Finally, we note that it may also be that neither of the components arises from the photosphere. This would of course open the possibility of many different origins, like the emission from two optically thin regions. However, it also means that there are few constraints; as discussed above, tying one component to the photosphere provides strong limitations to the origins of the other component. We therefore refrain from such speculations.
5 Summary and Conclusions
We have analysed the time-resolved spectrum of GRB 080825C using both the GBM and LAT instruments on Fermi. We find evidence for a second peak at energies above the previously reported Band component, present at the level of . The temporal behaviour of this peak is different from components previously seen in GRB spectra; the peak energy increases throughout the emission episode, from a few hundred keV to several MeV. If real, this is the first time such a feature has been detected. The two components likely arise in different regions of the outflow, and assuming one of the components arises in the photosphere sets strong constraints on the possible origins of the other. The most promising appears to be that the high-energy peak is photospheric emission in a Poynting flux dominated outflow, where the magnetisation increases with time.
Acknowledgements
We would like to thank Damien Bégué for valuable comments and discussions. MA is an International Research Fellow of the Japan Society for the Promotion of Science.
The Fermi-LAT Collaboration acknowledges generous ongoing support from a number of agencies and institutes that have supported both the development and the operation of the LAT as well as scientific data analysis. These include the National Aeronautics and Space Administration and the Department of Energy in the United States, the Commissariat à l’Energie Atomique and the Centre National de la Recherche Scientifique / Institut National de Physique Nucléaire et de Physique des Particules in France, the Agenzia Spaziale Italiana and the Istituto Nazionale di Fisica Nucleare in Italy, the Ministry of Education, Culture, Sports, Science and Technology (MEXT), High Energy Accelerator Research Organization (KEK) and Japan Aerospace Exploration Agency (JAXA) in Japan, and the K. A. Wallenberg Foundation, the Swedish Research Council and the Swedish National Space Board in Sweden.
Additional support for science analysis during the operations phase is gratefully acknowledged from the Istituto Nazionale di Astrofisica in Italy and the Centre National d’Études Spatiales in France.
References
- Abdo et al. (2009) Abdo A. A., Ackermann M., Asano K., et al. 2009, ApJ 707, 580A
- Ackermann et al. (2011) Ackermann M., Ajello M., Asano K., et al. 2011, ApJ, 729, 114
- Ackermann et al. (2012) Ackermann, M., Ajello, M., Albert, A., et al. 2012, ApJS, 203, 4
- Ackermann et al. (2013) Ackermann M., Ajello M., Asano K., et al. 2013, ApJS 209, 11A
- Ackermann et al. (2014) Ackermann M., Ajello M., Asano K., et al. 2014, Science, 343, 42
- Ajello et al. (2014) Ajello, M., Albert, A., Allafort, A., et al. 2014, ApJ, 789, 20
- Atwood et al. (2009) Atwood, W. B., Abdo, A. A., Ackermann, M., et al. 2009, ApJ, 697, 1071
- Axelsson et al. (2012) Axelsson M., Baldini L., Barbiellini G., et al. 2012, ApJ, 757, L31
- Band et al. (1993) Band D., Matteson J., Ford L., et al. 1993, ApJ, 413, L281
- Bégué & Pe’er (2015) Bégué D. & Pe’er A. 2015, ApJ, 802, 134
- Beloborodov, Hascoët and Vurm (2014) Beloborodov A. M., Hascoët R. & Vurm I., 2014, ApJ, 788, 36
- Bissaldi et al. (2009) Bissaldi, E., von Kienlin, A., Lichti, G., et al. 2009, Experimental Astronomy, 24, 47
- Hascoët, Daigne & Mochkovitch (2013) Hascoët R., Daigne F., & Mochkovitch R. 2013, A&A, 551, A124
- Gao & Zhang (2015) Gao H., & Zhang B. 2015, ApJ, 801, 103
- González et al. (2003) González, M. M., Dingus, B. L., Kaneko, Y., et al. 2003, Nature, 424, 749
- Kaneko et al. (2006) Kaneko Y., Preece R. D., Briggs M. S., Pacesias W. S., Meegan C. A., Band D. L. 2006, ApJS, 166, 298
- Keren & Levinson (2014) Keren S., & Levinson A., 2014 ApJ, 789, 128
- Meegan et al. (2009) Meegan C., Lichti G., Bhat P. N., et al. 2009, ApJ, 702, 791
- Pe’er et al. (2006) Pe’er A., Mészáros P., & Rees M. J. 2006, ApJ, 642, 995
- Pelassa et al. (2010) Pelassa V., Preece R., Piron F., et al. 2010, Proceedings for the 2009 Fermi Symposium. eConf Proceedings C091122 (arXiv:1002.2617)
- Protassov et al. (2002) Protassov R., van Dyk D. A., Connors A., Kashyap V. L., Siemiginowska A. 2002, ApJ, 571, 545
- Ryde (2004) Ryde F. 2004, ApJ, 614, 827
- Ryde & Pe’er (2009) Ryde F. & Pe’er A. 2009, ApJ, 702, 1211
- Vasileiou (2013) Vasileiou, V. 2013, Astroparticle Physics, 48, 61
- Vurm et al. (2014) Vurm I., Hascoët R., & Beloborodov A. M. 2014, ApJL, 789, L37