Phonon anomalies in some iron-telluride materials
Abstract
The detailed temperature dependence of the infrared-active mode in Fe1.03Te ( K) and Fe1.13Te ( K) has been examined, and the position, width, strength, and asymmetry parameter determined using an asymmetric Fano profile superimposed on an electronic background. In both materials the frequency of the mode increases as the temperature is reduced; however, there is also a slight asymmetry in the line shape, indicating that the mode is coupled to either spin or charge excitations. Below there is an anomalous decrease in frequency and the mode shows little temperature dependence, at the same time becoming more symmetric, suggesting a reduction in spin- or electron-phonon coupling. The frequency of the infrared-active mode and the magnitude of the shift below are predicted reasonably well by first-principles calculations; however, the predicted splitting of the mode is not observed. In superconducting FeTe0.55Se0.45 ( K) the infrared-active mode displays asymmetric line shape at all temperatures, which is most pronounced between K, indicating the presence of either spin- or electron-phonon coupling, which may be a necessary prerequisite for superconductivity in this class of materials.
pacs:
63.20.-e, 71.27.+a, 78.30.-jI Introduction
The discovery of superconductivity in the iron-based materials has prompted a thorough investigation of this class of materials in an effort to understand the mechanism responsible for the superconductivity, as well as the normal state from which it emerges Johnston (2010). While much of this work has focussed on the electronic and magnetic structure, lattice vibrations are also useful for probing electron-phonon coupling and the effects of chemical substitution Xu et al. (2015). Among the iron-based materials, iron telluride is of particular interest because it is thought to be among the most strongly correlated of the iron-chalcogenide materials Yin et al. (2011). At room temperature, the nearly stoichiometric Fe1+δTe is a tetragonal, paramagnetic metal that undergoes a first-order structural and magnetic transition to a monoclinic, antiferromagnetic (AFM) metal at K Bao et al. (2009); Han and Savrasov (2009); Martinelli et al. (2010); Zaliznyak et al. (2011, 2012); Fobes et al. (2014). The introduction of excess iron leads to an increase in the resistivity and the suppression of Liu et al. (2011); Rodriguez et al. (2011). The substitution of Se for Te in FeTe1-xSex suppresses the structural and magnetic transition and results in a superconducting phase for a broad range of compositions Li et al. (2009); Liu et al. (2010), with a maximum critical temperature of K Fang et al. (2008); Taen et al. (2009); Sales et al. (2009); Chen et al. (2009). The optical and transport properties of Fe1+δTe and FeTe1-xSex have been investigated Chen et al. (2009); Hancock et al. (2010); Dai et al. (2014); Homes et al. (2010, 2015); Pimenov et al. (2013); Perucchi et al. (2014) and in addition there have been a number of reports on the vibrational properties of these materials; however, only the Raman-active modes have been studied Xia et al. (2009); Okazaki et al. (2011); Gnezdilov et al. (2011); Um et al. (2012); Popović et al. (2014), leaving the infrared-active modes largely unexplored.
In this work we examine the optical properties of Fe1.03Te () and Fe1.13Te () above and below , as well as FeTe0.55Se0.45 ( K), and determine the detailed temperature dependence of the position, width, strength and asymmetry parameter of the infrared-active mode using an asymmetric (Fano) line shape; in several cases the electronic properties of these materials have been previously discussed by us Homes et al. (2010); Dai et al. (2014); Homes et al. (2015). In both Fe1+δTe materials the infrared-active mode displays a slight asymmetry, suggesting either spin- or electron-phonon coupling, and increases in frequency with decreasing temperature, as expected for an anharmonic decay process; below the mode undergoes an anomalous decrease in frequency at and the asymmetry parameter decreases, indicating reduced coupling. The vibrational frequencies and atomic intensities have been calculated at the center of the Brillouin zone from first-principles methods for both the high-temperature tetragonal phase, and the low-temperature monoclinic phase. In the latter case, spin ordering is shown in some cases to alter the character of the mode resulting in a large predicted frequency shift below . Interestingly, the predicted splitting of the infrared-active mode below is not observed. In FeTe0.55Se0.45 the mode displays an asymmetry at all temperatures, which is most pronounced between K. The asymmetric profile is a signature of either spin- or electron-phonon coupling, which may be necessary condition for superconductivity in this class of materials.
II Experiment
Single crystals of Fe1.03Te and Fe1.13Te with good cleavage planes (001) have been grown by a unidirectional solidification process; these crystals undergo structural and magnetic transitions Bao et al. (2009); Han and Savrasov (2009); Martinelli et al. (2010); Zaliznyak et al. (2011, 2012); Fobes et al. (2014) at K and K, respectively. Single crystals with a nominal composition of FeTe0.55Se0.45 have also been grown using this similar process with K and a transition width of K. The reflectance of these materials with the light polarized in the Fe–As (a-b) planes has been measured over a wide frequency range ( meV to over 3 eV) using an in situ evaporation technique Homes et al. (1993) for a wide range of temperatures. The complex optical properties have been calculated from a Kramers-Kronig analysis of the reflectance Dressel and Grüner (2001). The large-scale structure and temperature dependence of the optical conductivity of some of these materials have been previously discussed Homes et al. (2010); Dai et al. (2014); Homes et al. (2015).
III Results and Discussion
Lattice vibrations in solids are often described using a Lorentzian oscillator superimposed on a linear (or polynomial) background. The complex dielectric function for the Lorentz oscillator is
| (1) |
where , and are the position, width, and strength of the vibration, respectively. The complex conductivity is , where is a high-frequency contribution to the real part, and is the impedance of free space, yielding units for the conductivity of cm-1. The real part of the optical conductivity for the oscillator may then be written as
| (2) |
While this approach accurately describes a symmetric line shape, the coupling of lattice vibrations to either the spin or electronic background may lead to an asymmetric line shape, often referred to as the Fano profile Fano (1961). The Fano line shape is written as , where A is a constant, , and the asymmetry is described by the dimensionless parameter . A more useful expression,
| (3) |
incorporates the oscillator strength; however, this from contains no information about and does not satisfy the Kramers-Kronig relation. To resolve this issue a phenomenological dielectric function for a Fano-shaped Lorentz oscillator is employed in which is Kramers-Kronig consistent Damascelli (1996); ref ,
| (4) |
where . Unlike the simple Fano profile, a complex conductivity may be calculated which satisfies . The real part of the optical conductivity is then
| (5) |
In the limit a symmetric Lorentzian is recovered [Eq. (2)]; however, as increases the line shape becomes increasingly asymmetric. We adopt this latter form for asymmetric line shapes to fit the infrared-active vibrations in Fe1+δTe and FeTe0.55Se0.45.
III.1 Fe1+δTe
III.1.1 Vibrational properties
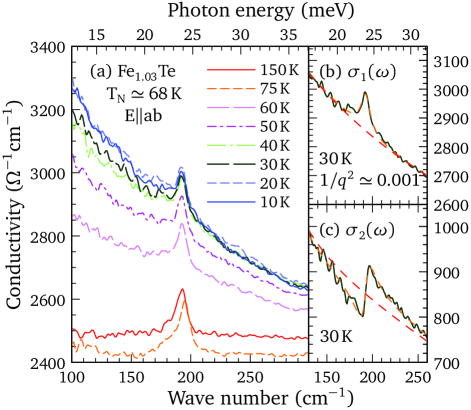
The real part of the optical conductivity of Fe1.03Te in the region of the infrared-active phonon is shown in Fig. 1(a). The rapid increase in the low-frequency conductivity below has been attributed to the closing of the pseudogap below leading to an increase in the free-carrier concentration Dai et al. (2014). In the room-temperature tetragonal phase, the space group with two formula units per unit cell yields the irreducible vibrational representation Xia et al. (2009)
Two infrared-active modes are expected, a doubly-degenerate mode active in the planes, and an mode active along the c axis. In the low-temperature monoclinic phase, the space group with two formula units per unit cell yields the irreducible vibrational representation Gnezdilov et al. (2011)
where the mode is infrared active along the c axis and the modes splits into two modes that are active in the a-b plane.
The infrared-active mode is fit simultaneously to the real and imaginary parts of the complex conductivity using the asymmetric line shape described by the dielectric function in Eq. (4) superimposed on a free-carrier (Drude) response in combination with several symmetric Lorentz oscillators that describe the mid-infrared response. Because the iron-telluride compounds are multiband materials Subedi et al. (2008) the minimal description of the dielectric function usually consists of at least two Drude components Wu et al. (2010),
| (6) |
where has been previously defined, and are the square of the plasma frequency and scattering rate for the delocalized (Drude) carriers, respectively, in the th band, and and are the carrier concentration and effective mass. The values for and and the mid-infrared oscillators are initially fit to the complex conductivity up to at least 1 eV using a non-linear least-squares technique. Fits to the infrared-active mode encompass only a narrow region around the mode (typically cm-1), and as a result in addition to the vibrational parameters, only the Drude components and the width and strength of the lowest mid-infrared oscillator are allowed to vary, while the other parameters remain fixed. The temperature dependence of , and the mid-infrared oscillators in these materials have been previously discussed Dai et al. (2014); Homes et al. (2015). As Figs. 1(b) and 1(c) illustrate, both the background and the line shape are reproduced quite well using this approach.
| (HT) | Atomic intensity | (LT) | Atomic intensity | Atomic intensity | ||||||
|---|---|---|---|---|---|---|---|---|---|---|
| Symmetry | Theory | Fe | Symmetry | Theory-NSP | Fe | Theory-SP | Fe | Expt.a | ||
| 98 (77) | 0.11 (0.12) | 98 (57) | 0.10 (0.17) | 84 (81) | 0.13 (0.11) | |||||
| 99 (72) | 0.10 (0.13) | 85 (79) | 0.13 (0.08) | |||||||
| 170 (141) | 0.00 (0.00) | 173 (137) | 0.00 (0.00) | 145 (139) | 0.15 (0.00) | 160 | ||||
| 249 (203) | 0.70 (0.70) | 245 (203) | 0.70 (0.70) | 241 (195) | 0.70 (0.70) | 196 | ||||
| 300 (254) | 0.70 (0.70) | 306 (267) | 0.70 (0.70) | |||||||
| 272 (221) | 1.00 (1.00) | 270 (210) | 1.00 (0.89) | 167 ( — ) | 0.85 ( — ) | 203 | ||||
| 292 (223) | 0.89 (0.88) | 289 (226) | 0.90 (0.92) | 287 (243) | 0.87 (0.89) | |||||
| 292 (215) | 0.90 (0.87) | 288 (245) | 0.87 (0.92) | |||||||
| 304 (257) | 0.70 (0.69) | 248 (196) | 0.70 (0.70) | 244 (189) | 0.70 (0.70) | |||||
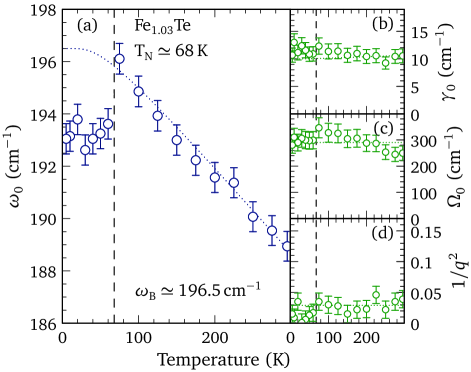
The temperature dependence of , , , and the asymmetry parameter of the infrared-active mode in Fe1.03Te are shown in Fig. 2. The frequency of the mode increases (hardens) in an almost linear fashion with decreasing temperature. At there is an anomalous decrease (softening) in the frequency of the mode followed by a very weak temperature dependence; there is no evidence for a new infrared active mode appearing below . This is similar to the temperature dependence of the frequency of the mode in these materials Gnezdilov et al. (2011); Um et al. (2012); Popović et al. (2014). The width of this mode shows very little temperature dependence either above or below . While strength of this mode may increase slightly as the temperature is lowered to , it is also possible that, within error, it is constant; below there is very little change. Above , the asymmetry parameter , suggesting weak spin- or electron-phonon coupling Xu et al. (2015). Below the asymmetry parameter decreases and the line shape becomes almost perfectly symmetric; this inferred reduction in the electron-phonon coupling may be related to the fact that in the AFM state the spin fluctuations are observed to decrease Zhang et al. (2010) and most signs of correlations disappear Lin et al. (2013).
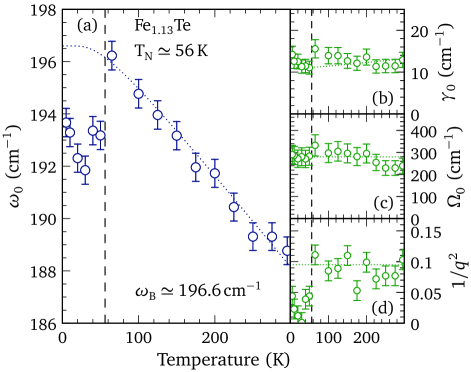
The temperature dependence of the infrared-active mode in Fe1.13Te has been fit using procedure described above, and the results are shown in Fig. 3 (the temperature dependence of the optical conductivity and the fit at 30 K is shown in Fig. S1 in the Supplemental Material). The behavior of , , and are quite similar to those of Fe1.03Te, although there does tend to be a bit more scatter in the data points. However, above the asymmetry parameter , suggesting that the spin- or electron-phonon coupling is stronger in this material; as in Fe1.03Te, below the asymmetry parameter decreases, suggesting a decrease in correlations and a commensurate reduction in the coupling of the phonons to either the spin or charge.
Above the behavior of can be described quite well assuming a symmetric anharmonic decay into two acoustic modes with identical frequencies and opposite momenta Klemens (1966); Menéndez and Cardona (1984). A slightly modified functional form is employed here,
| (7) |
| (8) |
where is the bare phonon frequency, is a residual line width, C and are constants, and ; an advantage of this form is that the bare phonon frequency (residual line width) is recovered in the limit. The model fits to the data are indicated by the dotted lines in Figs. 2 and 3, yielding nearly identical values of and 196.6 cm-1 for Fe1.03Te and Fe1.13Te, respectively.
The behavior of the infrared-active mode at is also reminiscent of the mode in BaFe2As2 which also experiences an anomalous softening below the magnetic and structural transition at K Akrap et al. (2009); however, in that material the oscillator strength nearly doubles below , whereas in Fe1+δTe it remains more or less unchanged.
III.1.2 Lattice dynamics
The frequencies and atomic intensities (square of the vibrational amplitude of each atom that sum to unity) for the zone-center phonons have been calculated from first principles using the so-called frozen-phonon method, the details of which are described the Appendix. The results for the high-temperature tetragonal phase using the relaxed (experimental) unit cell parameters (Table 2 in the Appendix) are shown in Table 1 and compared with experimental results; these results are in good agreement with other calculations Xia et al. (2009); Okazaki et al. (2011). It has been remarked that in this material the frequencies calculated using the experimental unit cell parameters are in better agreement with the experimentally-observed frequencies than the values determined from a relaxed unit cell Xia et al. (2009), and that is indeed the case here. In the relaxed unit cell the Fe–Te bond is shorter, which has the effect of scaling up all of the frequencies by %; however, we note that the character of the atomic intensities is essentially unaffected. The and Raman modes are calculated using the relaxed (experimental) unit cell parameters at 170 (141) and 272 (221) cm-1, respectively, are pure Te and Fe vibrations, whereas the mode is a mixture of the two. Using the experimental unit cell, the calculated frequency for the mode of 203 cm-1 is quite close to the measured value of cm-1, as are the values for the and modes Um et al. (2012).
The frequencies and atomic intensities for the low-temperature monoclinic phase have also been calculated using the relaxed (experimental) unit cell parameters (Table 3 in the Appendix), and the results listed in Table 1. As previously noted, the lower symmetry results in the splitting of the doubly-degenerate and modes. In the non-magnetic calculation (non-spin polarized), the calculated frequencies for the relaxed and experimental unit cells match quite well with their counterparts in the tetragonal phase, and the character of the modes does not change substantially. In the relaxed unit cell the splitting of the upper and lower modes is negligible ( cm-1); however in the experimental unit cell this splitting is much larger, cm-1. In both the experimental and relaxed geometries, the mode is predicted to split by cm-1. A simple empirical force-constant model vib reproduces the size of the splitting below and indicates that the two modes should have roughly the same strength. Using a splitting of cm-1, a new mode might be expected at cm-1; however, there does not appear to be any experimental evidence for a new mode below [Fig. 1(a) and Fig. S1(a) in the Supplementary Material].
The non-spin polarized calculation does not take into consideration the antiferromagnetic ground state of this material Bao et al. (2009). Accordingly, the spins on the two Fe sites have been placed in an antiferromagnetic configuration while the Te atoms remain non-magnetic; the frequencies and atomic characters are then calculated for a spin-polarized case using both the relaxed and experimentally-determined unit cell parameters, and the results listed in Table 1. The introduction of magnetic order has a significant effect on some modes changing both the frequency and the character of the vibration; however, we note that the , upper and modes experience only a small effect. The small predicted downward shift in the lower mode of cm-1 for the spin-polarized case is in good agreement with the experimentally-observed softening of this mode of between cm-1 in Fe1+δTe below .
III.2 FeTe0.55Se0.45
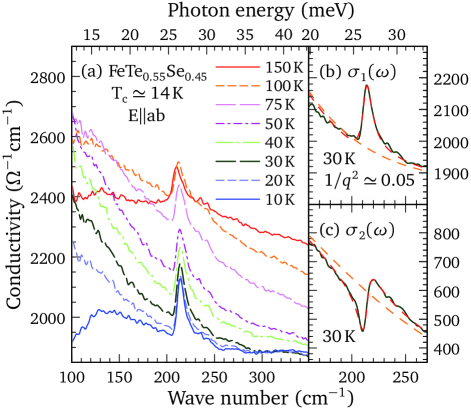
The real part of the optical conductivity of superconducting FeTe0.55Se0.45 in the region of the infrared-active phonon at cm-1 is shown in Fig. 4(a) Homes et al. (2015). The substitution of Se for Te in this material has the effect of shifting the frequency of the mode up about 10%. The temperature dependence of the mode has been fit to the complex conductivity using the asymmetric Fano line shape in Eq. (4) superimposed on a Drude-Lorentz background; as Figs. 4(b) and 4(c) illustrate, both the background and the line shape are reproduced quite well. In several cases, it appears as thought there is a weak sideband at cm-1; however, no new mode is predicted in this material, suggesting that such features are the result of an asymmetric line shape.
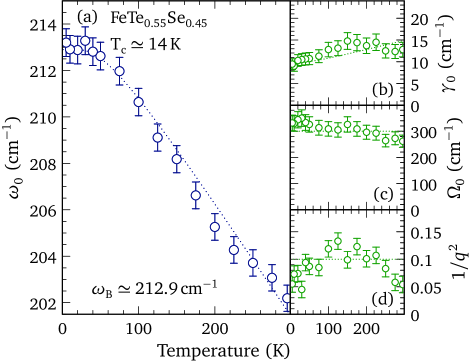
The temperature dependence of the frequency and line width of the mode, shown in Figs. 5(a) and 5(b), respectively, both agree quite well with the anharmonic decay model. The strength of the mode shown in Figs. 5(c) may be increasing somewhat with decreasing temperature, but within the accuracy of the fits it is also possible that it is temperature independent. The asymmetry parameter is small at room temperature, , but increases with temperature, reaching a maximum of at K before decreasing at low temperature, as shown in Fig. 5(d). This would tend to indicate that the spin- or electron-phonon coupling of the mode is becoming significant, and indeed it is considerably larger than what is observed in related iron-pnictide materials Xu et al. (2015). The decrease in at low temperature is correlated with the rapid decrease in the Hall coefficient below 100 K Tsukada et al. (2010), suggesting that the electron-phonon coupling is related to a specific carrier pocket in this material. While electron-phonon coupling is present in this material at low temperatures, it is thought that the electron-phonon coupling constant in this material is quite small () Luo et al. (2012). The low values for do not support the high ’s observed in iron-based superconductors, implying that these materials are not phonon-mediated superconductors Boeri et al. (2008). However, a detailed analysis of the five-orbital Hubbard-Holstein model for iron pnictides has demonstrated that a relatively small electron-phonon interaction arising from the Fe-ion oscillation can induce substantial -orbital fluctuations Kontani and Onari (2010); Saito et al. (2010), as well as the anion electronic polarization Ma et al. (2014). These orbital fluctuations give rise to a strong pairing interaction and mediate an superconducting state. In addition, a large Fe isotope effect has been reported in SmFeAsO1-xFex and Ba1-xKxFe2As2 Liu et al. , indicating that electron-phonon coupling likely plays some role in the pairing mechanism. Our experimental results in the Fe1+yTe1-xSex system, in combination with the above theoretical and experimental studies, suggests that electron-phonon coupling may be a necessary prerequisite for superconductivity in this class of materials.
IV Conclusions
The detailed temperature dependence of the infrared-active infrared-active mode has been fit in Fe1.03Te and Fe1.13Te using an asymmetric Fano line shape superimposed on a background of Drude free carriers and symmetric Lorentz oscillators. In both materials, above the frequency increases as the temperature is lowered; this behavior is described quite well by an anharmonic decay process. Below , there is an abrupt softening of this mode in both materials, below which it displays little temperature dependence. While frequency of the mode and the size of the shift below are predicted reasonably well from first-principles calculations (with some caveats), the predicted splitting of the infrared-active mode is not observed. In both materials, the phonon has a slightly asymmetric line shape above , suggesting that there is coupling of the phonons to either spin or charge; however, decreases and the profile becomes more symmetric below , suggesting this coupling is reduced. The mode in superconducting FeTe0.55Se0.45 has been fit in a similar fashion and displays an asymmetry at all temperatures, which is most pronounced between K. The temperature dependence of this mode is once again described quite well by an anharmonic decay process over the entire temperature range. The asymmetric nature of the mode is an indication of spin- or electron-phonon coupling to the electronic background, which may be a necessary prerequisite for superconductivity in the iron-based materials.
Acknowledgements.
We would like to acknowledge helpful discussions with T. Birol. We are indebted to S. V. Dordevic for referring us to a phenomenological Fano line shape, developed by A. Damascelli and A. Kuzmenko. This work is supported by the Office of Science, U.S. Department of Energy under Contract No. DE-SC0012704. J.S. and R.D.Z. are supported by the Center for Emergent Superconductivity, an Energy Frontier Research Center funded by the U.S. Department of Energy, Office of Science.*
Appendix A Lattice dynamics
A.1 (HT)
The total energy of FeTe was calculated with the generalized gradient approximation (GGA) using the full-potential linearized augmented plane-wave (FP-LAPW) method Singh (1994) with local-orbital extensions Singh (1991) in the WIEN2k implementation wie . An examination of different Monkhorst-Pack k-point meshes indicated that 175 points ( mesh) and was sufficient for good energy convergence. The geometry of the unit cell was refined through an iterative process whereby the volume was optimized with respect to the total energy while the ratio remained fixed. The atomic fractional coordinates were then relaxed with respect to the total force, typically resulting in residual forces of less than 1 mRy/a.u. This procedure was repeated until no further improvement was obtained. A comparison of the experimental and calculated (relaxed) unit cell parameters are shown in Table. 2. Note that while the unit cell parameters are nearly identical to the experimentally-determined values, the position of the Te atom has shifted somewhat.
| Experimenta | GGA | |
| (Å) | 3.8127 | 3.8126 |
|---|---|---|
| (Å) | 6.2450 | 6.2448 |
| Te() | 0.2813 | 0.2569 |
| Fe–Te (Å) | 2.5923 | 2.4915 |
The phonons have been determined using the direct method. To determine the phonons at the zone center, a supercell is sufficient. To obtain a complete set of Hellmann-Feynman forces, a total of 4 independent displacements are required; because there are always some residual forces at the atomic sites we have considered symmetric displacements, which doubles this number, resulting in a total of 8 atomic displacements. In this case, displacement amplitudes of 0.03 Å were used. The calculations have converged when the successive changes for the forces on each atom are less than 0.1 mRy/au. The residual forces are collected for each set of symmetric displacements and a list of the Hellmann-Feynman forces are generated. Using the program PHONON pho the cumulative force constants deconvoluted from the Hellmann-Feynman forces are introduced into the dynamical matrix, which is then diagonalized in order to obtain the phonon frequencies; the atomic intensities are further calculated to describe the character of the vibration. The results are shown in Table 1.
| Experimenta | GGA (NSP) | GGA (SP) | ||||
| (Å) | 3.8346 | 3.8391 | 3.8391 | |||
|---|---|---|---|---|---|---|
| (Å) | 3.7836 | 3.7897 | 3.7897 | |||
| (Å) | 6.2567 | 6.2649 | 6.2649 | |||
| (∘) | 89.21 | 89.24 | 89.24 | |||
| Fe() | 0.7612 | 0.0033 | 0.7501 | 0.0013 | 0.7507 | 0.0011 |
| Te() | 0.2586 | 0.2822 | 0.2448 | 0.2559 | 0.2454 | 0.2717 |
| Fe–Fe (Å) | 2.633/2.756 | 2.697/2.698 | 2.693/2.701 | |||
| Fe–Te (Å) | 2.582/2.603/2.604 | 2.487/2.495/2.496 | 2.552/2.559/2.562 | |||
A.2 (LT)
The procedure that was used to calculate the geometry of the room-temperature tetragonal phase has been repeated for the low-temperature monoclinic phase; the same point mesh and were used. The optimized unit cell parameters are compared with the experimental values and shown in Table 3. Once again, the calculated unit cell parameters are nearly identical to the experimental values; however the Fe and Te atoms have undergone small shifts resulting in a decrease of the Fe–Te bond lengths. Interestingly, the Fe–Fe bond modulation observed experimentally is not captured in the non-spin polarized GGA result in which the Fe–Fe bonds are almost identical. To calculate the zone-center phonons, a supercell is employed. In the monoclinic phase a total of 6 independent displacements are required; symmetric displacements double this number to 12. Displacement amplitudes of 0.03 Å were used.
Two different cases have been considered for this symmetry. In the first case the system is assumed to be non-magnetic and the spins on the Fe and Te sites are ignored and a non-spin polarized (NSP) calculation performed. The calculated phonon frequencies and atomic intensities which are listed in Table 1. In the second case the spins on the Fe sites are specified to be in an antiferromagnetic configuration and the Te atoms are assumed to be nonmagnetic and a spin-polarized calculation is performed. If the fractional coordinates are relaxed in this case, position of the Te atom is now closer to the experimental value, and a Fe–Fe bond modulation is now observed (Table 3). However, given that this structure appears to be intermediate between the non-spin polarized and the experimental unit cell parameters, we have not performed a phonon calculation. Using the previously established criteria for convergence, we find the magnetic moments are about /Fe for the (non-spin polarized) relaxed unit cell, which is very close to the expected value of /Fe observed in other work Gretarsson et al. (2011). When the experimental unit cell is used, the magnetic moments increase to /Fe; however, this results in a calculated frequency of less than zero for one of the modes, this unphysical value indicates that within the scope of this calculation the structure is unstable.
References
- Johnston (2010) David C. Johnston, “The puzzle of high temperature superconductivity in layered iron pnictides and chalcogenides,” Adv. Phys. 59, 803–1061 (2010).
- Xu et al. (2015) B. Xu, Y. M. Dai, B. Shen, H. Xiao, Z. R. Ye, A. Forget, D. Colson, D. L. Feng, H. H. Wen, C. C. Homes, X. G. Qiu, and R. P. S. M. Lobo, “Anomalous phonon redshift in K-doped BaFe2As2 iron pnictides,” Phys. Rev. B 91, 104510 (2015).
- Yin et al. (2011) Z. P. Yin, K. Haule, and G. Kotliar, “Kinetic frustration and the nature of the magnetic and paramagnetic states in iron pnictides and iron chalcogenides,” Nat. Mater. 10, 932–935 (2011).
- Bao et al. (2009) Wei Bao, Y. Qiu, Q. Huang, M. A. Green, P. Zajdel, M. R. Fitzsimmons, M. Zhernenkov, S. Chang, Minghu Fang, B. Qian, E. K. Vehstedt, Jinhu Yang, H. M. Pham, L. Spinu, and Z. Q. Mao, “Tunable (, )-Type Antiferromagnetic Order in -Fe(Te,Se) Superconductors,” Phys. Rev. Lett. 102, 247001 (2009).
- Han and Savrasov (2009) Myung Joon Han and Sergey Y. Savrasov, “Doping Driven (,0) Nesting and Magnetic Properties of Superconductors,” Phys. Rev. Lett. 103, 067001 (2009).
- Martinelli et al. (2010) A. Martinelli, A. Palenzona, M. Tropeano, C. Ferdeghini, M. Putti, M. R. Cimberle, T. D. Nguyen, M. Affronte, and C. Ritter, “From antiferromagnetism to superconductivity in : Neutron powder diffraction analysis,” Phys. Rev. B 81, 094115 (2010).
- Zaliznyak et al. (2011) Igor A. Zaliznyak, Zhijun Xu, John M. Tranquada, Genda Gu, Alexei M. Tsvelik, and Matthew B. Stone, “Unconventional Temperature Enhanced Magnetism in Fe1.1Te ,” Phys. Rev. Lett. 107, 216403 (2011).
- Zaliznyak et al. (2012) I. A. Zaliznyak, Z. J. Xu, J. S. Wen, J. M. Tranquada, G. D. Gu, V. Solovyov, V. N. Glazkov, A. I. Zheludev, V. O. Garlea, and M. B. Stone, “Continuous magnetic and structural phase transitions in Fe1+yTe,” Phys. Rev. B 85, 085105 (2012).
- Fobes et al. (2014) David Fobes, Igor A. Zaliznyak, Zhijun Xu, Ruidan Zhong, Genda Gu, John M. Tranquada, Leland Harriger, Deepak Singh, V. Ovidiu Garlea, Mark Lumsden, and Barry Winn, “Ferro-orbital ordering transition in iron telluride Fe1+yTe,” Phys. Rev. Lett. 112, 187202 (2014).
- Liu et al. (2011) X. Liu, C.-C. Lee, Z. J. Xu, J. S. Wen, G. Gu, W. Ku, J. M. Tranquada, and J. P. Hill, “X-ray diffuse scattering study of local distortions in Fe1-xTe induced by excess Fe,” Phys. Rev. B 83, 184523 (2011).
- Rodriguez et al. (2011) E. E. Rodriguez, C. Stock, P. Zajdel, K. L. Krycka, C. F. Majkrzak, P. Zavalij, and M. A. Green, “Magnetic-crystallographic phase diagram of the superconducting parent compound Fe1+xTe,” Phys. Rev. B 84, 064403 (2011).
- Li et al. (2009) Shiliang Li, Clarina de la Cruz, Q. Huang, Y. Chen, J. W. Lynn, Jiangping Hu, Yi-Lin Huang, Fong-Chi Hsu, Kuo-Wei Yeh, Maw-Kuen Wu, and Pengcheng Dai, “First-order magnetic and structural phase transitions in ,” Phys. Rev. B 79, 054503 (2009).
- Liu et al. (2010) T. J. Liu, J. Hu, B. Qian, D. Fobes, Z. Q. Mao, W. Bao, M. Reehuis, S. A. J. Kimber, K. Prokeš, S. Matas, D. N. Argyriou, A. Hiess, A. Rotaru, H. Pham, L. Spinu, Y. Qiu, V. Thampy, A. T. Savici, J. A. Rodriguez, and C. Broholm, “From magnetic order to superconductivity with magnetic resonance in Fe1.02Te1-xSex,” Nat. Mater. 9, 718–720 (2010).
- Fang et al. (2008) M. H. Fang, H. M. Pham, B. Qian, T. J. Liu, E. K. Vehstedt, Y. Liu, L. Spinu, and Z. Q. Mao, “Superconductivity close to magnetic instability in ,” Phys. Rev. B 78, 224503 (2008).
- Taen et al. (2009) T. Taen, Y. Tsuchiya, Y. Nakajima, and T. Tamegai, “Superconductivity at K in single-crystalline FeTe0.61Se0.39,” Phys. Rev. B 80, 092502 (2009).
- Sales et al. (2009) B. C. Sales, A. S. Sefat, M. A. McGuire, R. Y. Jin, D. Mandrus, and Y. Mozharivskyj, “Bulk superconductivity at 14 K in single crystals of Fe1+yTexSe1-x,” Phys. Rev. B 79, 094521 (2009).
- Chen et al. (2009) G. F. Chen, Z. G. Chen, J. Dong, W. Z. Hu, G. Li, X. D. Zhang, P. Zheng, J. L. Luo, and N. L. Wang, “Electronic properties of single-crystalline Fe1.05Te and Fe1.03Se0.30Te0.70,” Phys. Rev. B 79, 140509(R) (2009).
- Hancock et al. (2010) J. N. Hancock, S. I. Mirzaei, J. Gillett, S. E. Sebastian, J. Teyssier, R. Viennois, E. Giannini, and D. van der Marel, “Strong coupling to magnetic fluctuations in the charge dynamics of iron-based superconductors,” Phys. Rev. B 82, 014523 (2010).
- Dai et al. (2014) Y. M. Dai, A. Akrap, J. Schneeloch, R. D. Zhong, T. S. Liu, G. D. Gu, Q. Li, and C. C. Homes, “Spectral weight transfer in strongly correlated Fe1.03Te,” Phys. Rev. B 90, 121114 (2014).
- Homes et al. (2010) C. C. Homes, A. Akrap, J. S. Wen, Z. J. Xu, Z. W. Lin, Q. Li, and G. D. Gu, “Electronic correlations and unusual superconducting response in the optical properties of the iron chalcogenide FeTe0.55Se0.45,” Phys. Rev. B 81, 180508 (2010).
- Homes et al. (2015) C. C. Homes, Y. M. Dai, J. S. Wen, Z. J. Xu, and G. D. Gu, “FeTe0.55Se0.45: A multiband superconductor in the clean and dirty limit,” Phys. Rev. B 91, 144503 (2015).
- Pimenov et al. (2013) A. Pimenov, S. Engelbrecht, A. M. Shuvaev, B. B. Jin, P. H. Wu, B. Xu, L. X. Cao, and E. Schachinger, “Terahertz conductivity in FeSe0.5Te0.5 superconducting films,” New J. Phys. 15, 013032 (2013).
- Perucchi et al. (2014) A. Perucchi, B. Joseph, S. Caramazza, M. Autore, E. Bellingeri, S. Kawale, C. Ferdeghini, M. Putti, S. Lupi, and P. Dore, “Two-band conductivity of a FeSe0.5Te0.5 film by reflectance measurements in the terahertz and infrared range,” Supercond. Sci. Technol. 27, 125011 (2014).
- Xia et al. (2009) T.-L. Xia, D. Hou, S. C. Zhao, A. M. Zhang, G. F. Chen, J. L. Luo, N. L. Wang, J. H. Wei, Z.-Y. Lu, and Q. M. Zhang, “Raman phonons of and single crystals,” Phys. Rev. B 79, 140510(R) (2009).
- Okazaki et al. (2011) K. Okazaki, S. Sugai, S. Niitaka, and H. Takagi, “Phonon, two-magnon, and electronic Raman scattering of Fe1+yTe1-xSex,” Phys. Rev. B 83, 035103 (2011).
- Gnezdilov et al. (2011) V. Gnezdilov, Yu. Pashkevich, P. Lemmens, A. Gusev, K. Lamonova, T. Shevtsova, I. Vitebskiy, O. Afanasiev, S. Gnatchenko, V. Tsurkan, J. Deisenhofer, and A. Loidl, “Anomalous optical phonons in FeTe chalcogenides: Spin state, magnetic order, and lattice anharmonicity,” Phys. Rev. B 83, 245127 (2011).
- Um et al. (2012) Y. J. Um, A. Subedi, P. Toulemonde, A. Y. Ganin, L. Boeri, M. Rahlenbeck, Y. Liu, C. T. Lin, S. J. E. Carlsson, A. Sulpice, M. J. Rosseinsky, B. Keimer, and M. Le Tacon, “Anomalous dependence of -axis polarized Fe phonon mode with Fe and Se concentrations in Fe1+yTe1-xSex,” Phys. Rev. B 85, 064519 (2012).
- Popović et al. (2014) Z. V. Popović, N. Lazarević, S. Bogdanović, M. M. Radonjić, D. Tanasković, Rongwei Hu, Hechang Lei, and C. Petrovic, “Signatures of the spin-phonon coupling in alloys,” Solid State Commun. 193, 51–55 (2014).
- Homes et al. (1993) C. C. Homes, M. Reedyk, D. A. Cradles, and T. Timusk, “Technique for measuring the reflectance of irregular, submillimeter-sized samples,” Appl. Opt. 32, 2976–2983 (1993).
- Dressel and Grüner (2001) M. Dressel and G. Grüner, Electrodynamics of Solids (Cambridge University Press, Cambridge, 2001).
- Fano (1961) U. Fano, “Effects of configuration interaction on intensities and phase shifts,” Phys. Rev. 124, 1866–1878 (1961).
- Damascelli (1996) A. Damascelli, Optical Spectroscopy of Quantum Spin Systems, Ph.D. thesis, University of Groningen (1996), p. 21.
- (33) A. Kuzmenko, Software RefFIT, Manual p. 64 (2014).
- Subedi et al. (2008) Alaska Subedi, Lijun Zhang, D. J. Singh, and M. H. Du, “Density functional study of FeS, FeSe, and FeTe: Electronic structure, magnetism, phonons, and superconductivity,” Phys. Rev. B 78, 134514 (2008).
- Wu et al. (2010) D. Wu, N. Barišić, P. Kallina, A. Faridian, B. Gorshunov, N. Drichko, L. J. Li, X. Lin, G. H. Cao, Z. A. Xu, N. L. Wang, and M. Dressel, “Optical investigations of the normal and superconducting states reveal two electronic subsystems in iron pnictides,” Phys. Rev. B 81, 100512(R) (2010).
- Zhang et al. (2010) Y. Zhang, F. Chen, C. He, L. X. Yang, B. P. Xie, Y. L. Xie, X. H. Chen, Minghu Fang, M. Arita, K. Shimada, H. Namatame, M. Taniguchi, J. P. Hu, and D. L. Feng, “Strong correlations and spin-density-wave phase induced by a massive spectral weight redistribution in -Fe1.06Te ,” Phys. Rev. B 82, 165113 (2010).
- Lin et al. (2013) Ping-Hui Lin, Y. Texier, A. Taleb-Ibrahimi, P. Le Fèvre, F. Bertran, E. Giannini, M. Grioni, and V. Brouet, “Nature of the bad metallic behavior of Fe1.06Te inferred from its evolution in the magnetic state,” Phys. Rev. Lett. 111, 217002 (2013).
- Klemens (1966) P. G. Klemens, “Anharmonic decay of optical phonons,” Phys. Rev. 148, 845–848 (1966).
- Menéndez and Cardona (1984) José Menéndez and Manuel Cardona, “Temperature dependence of the first-order Raman scattering by phonons in Si, Ge, and : Anharmonic effects,” Phys. Rev. B 29, 2051–2059 (1984).
- Akrap et al. (2009) A. Akrap, J. J. Tu, L. J. Li, G. H. Cao, Z. A. Xu, and C. C. Homes, “Infrared phonon anomaly in ,” Phys. Rev. B 80, 180502 (2009).
- (41) E. Dowty, Software VIBRATZ (Shape Software, Kingsport, TN, 2001).
- Tsukada et al. (2010) I. Tsukada, M. Hanawa, Seiki Komiya, T. Akiike, R. Tanaka, Y. Imai, and A. Maeda, “Hall effect in superconducting thin films,” Phys. Rev. B 81, 054515 (2010).
- Luo et al. (2012) C. W. Luo, I. H. Wu, P. C. Cheng, J.-Y. Lin, K. H. Wu, T. M. Uen, J. Y. Juang, T. Kobayashi, Y. C. Wen, T. W Huang, K. W. Yeh, M. K. Wu, D. A. Chareev, O. S. Volkova, and A. N. Vasiliev, “Ultrafast dynamics and phonon softening in Fe1+ySe1-xTex single crystals,” New J. Phys. 14, 103053 (2012).
- Boeri et al. (2008) L. Boeri, O. V. Dolgov, and A. A. Golubov, “Is LaFeAsO1-xFx an Electron-Phonon Superconductor?” Phys. Rev. Lett. 101, 026403 (2008).
- Kontani and Onari (2010) Hiroshi Kontani and Seiichiro Onari, “Orbital-Fluctuation-Mediated Superconductivity in Iron Pnictides: Analysis of the Five-Orbital Hubbard-Holstein Model,” Phys. Rev. Lett. 104, 157001 (2010).
- Saito et al. (2010) Tetsuro Saito, Seiichiro Onari, and Hiroshi Kontani, “Orbital fluctuation theory in iron pnictides: Effects of As-Fe-As bond angle, isotope substitution, and -orbital pocket on superconductivity,” Phys. Rev. B 82, 144510 (2010).
- Ma et al. (2014) Chao Ma, Lijun Wu, Wei-Guo Yin, Huaixin Yang, Honglong Shi, Zhiwei Wang, Jianqi Li, C. C. Homes, and Yimei Zhu, “Strong Coupling of the Iron-Quadrupole and Anion-Dipole Polarizations in Ba(Fe1-xCox)2As2,” Phys. Rev. Lett. 112, 077001 (2014).
- (48) R. H. Liu, T. Wu, G. Wu, H. Chen, X. F. Wang, Y. L. Xie, J. J. Ying, Y. J. Yan, Q. J. Li, B. C. Shi, W. S. Chu, Z. Y. Wu, and X. H. Chen, “A large iron isotope effect in SmFeAsO1-xFx and Ba1-xKxFe2As2,” .
- Singh (1994) D. J. Singh, Planewaves, Pseudopotentials and the LAPW method (Kluwer Adademic, Boston, 1994).
- Singh (1991) David Singh, “Ground-state properties of lanthanum: Treatment of extended-core states,” Phys. Rev. B 43, 6388–6392 (1991).
- (51) P. Blaha, K. Schwarz, G. K. H. Madsen, D. Kvasnicka and J. Luitz, WIEN2k, An augmented plane wave plus local orbitals program for calculating crystal properties (Techn. Universität Wien, Austria, 2001).
- (52) K. Parlinksi, Software PHONON (2003).
- Gretarsson et al. (2011) H. Gretarsson, A. Lupascu, Jungho Kim, D. Casa, T. Gog, W. Wu, S. R. Julian, Z. J. Xu, J. S. Wen, G. D. Gu, R. H. Yuan, Z. G. Chen, N.-L. Wang, S. Khim, K. H. Kim, M. Ishikado, I. Jarrige, S. Shamoto, J.-H. Chu, I. R. Fisher, and Young-June Kim, “Revealing the dual nature of magnetism in iron pnictides and iron chalcogenides using x-ray emission spectroscopy,” Phys. Rev. B 84, 100509(R) (2011).
![[Uncaptioned image]](/html/1602.08077/assets/x6.png)