Controlled uniform coating from the interplay of Marangoni flows and surface-adsorbed macromolecules
Abstract
Surface coatings and patterning technologies are essential for various physicochemical applications. In this Letter, we describe key parameters to achieve uniform particle coatings from binary solutions: First, multiple sequential Marangoni flows, set by solute and surfactant simultaneously, prevent non-uniform particle distributions and continuously mix suspended materials during droplet evaporation. Second, we show the importance of particle-surface interactions that can be established by surface-adsorbed macromolecules. To achieve a uniform deposit in a binary mixture, a small concentration of surfactant and surface-adsorbed polymer (0.05 wt% each) is sufficient, which offers a new physicochemical avenue for control of coatings.
An evaporating liquid drop, either single or multi-component, containing solutes or particulates leaves a deposit whose form is determined by various parameters, for instance internal flow fields Deegan:1997fk ; Hu:2006gp ; ristenpart2007influence , liquid compositions Christy:2011jn ; Bennacer:2014fz ; Park:2006cp ; Still:2012bu ; sempels2013auto ; cazabat2010evaporation ; poulard2007control , and interactions between suspended particles and a solid substrate shmuylovich2002surface ; Deegan:2000tb ; yunker2011suppression ; askounis2014effect , which are crucial for coating processes. In particular, control of the deposit uniformity and thickness can be important in surface patterning kuang2014controllable ; han2012learning ; cai2008marangoni , ink-jet mishra2010high ; Park:2006cp ; Emma:2015 and 3D printing technologies kong20143d . These processes are complex because of physicochemical dynamics that arise from Marangoni effects Deegan:2000tb ; Hu:2006gp ; Christy:2011jn ; Bennacer:2014fz ; cazabat2010evaporation ; poulard2007control ; Still:2012bu ; sempels2013auto ; majumder2012overcoming ; sefiane2014patterns and particle deposition mechanisms Deegan:2000tb ; askounis2014effect ; shmuylovich2002surface ; boulogne2015homogeneous . In fact, although a binary mixture is used quite often to achieve uniform particle deposition from droplets smaller than 100 m mishra2010high ; Park:2006cp ; Emma:2015 , to our best knowledge such coatings have not been achieved for larger droplets. Furthermore, while the wetting and dewetting behaviors of binary mixture drops have been investigated Sefiane:2008ft ; sefiane2003experimental , the relation between the deposition pattern and the evaporatively driven flow field in a binary mixture droplet is incomplete (Table S1, Supporting Information (SI)) supportinginformation .
In this Letter, to achieve a uniform coating, we identify key characteristics of a multicomponent solution, which consists of a binary mixture, surface-active surfactant, and surface-adsorbed polymer. We were motivated to pursue the ideas here from examining a whisky droplet after drying on an ordinary glass where it creates a relatively uniform particle deposit (see Fig. 1), which is in contrast to the well-known ‘coffee-ring stain’ Deegan:1997fk . Based on our understanding of the drying and coating mechanisms of binary liquid droplets, whisky droplets, and more complex solution droplets, we design a model liquid that yields nearly uniform deposits by taking the approach that whisky is an ethanol-water mixture containing diverse dissolved molecules, which contribute to the complexity of the system, the flows, and the final particle deposits.
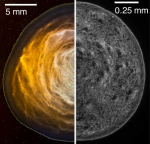
We begin with a few remarks about whisky, since it serves as a model complex mixture, where nearly uniform particle deposits are observed after drying. Whisky is an alcoholic liquid (ethanol:water, 35:65 % by weight) made by the hydrolytic breakdown of cereal starches into fermentable sugars and their subsequent fermentation and distillation Yoneya2005 ; see SI for a brief summary supportinginformation . During the manufacturing procedures, various chemicals are formed, e.g. cellulose, hemicellulose, lignin, and a number of highly extractable molecules, including lipids, acids, sugars, and tannins Lee2001 . However, their volume fractions are smaller than 1 % in total Yoneya2005 .
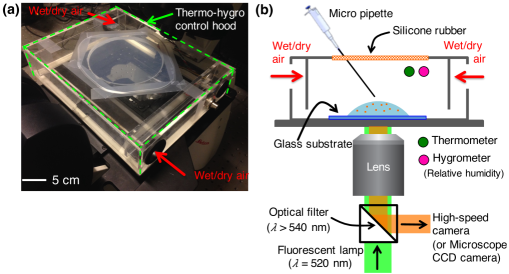
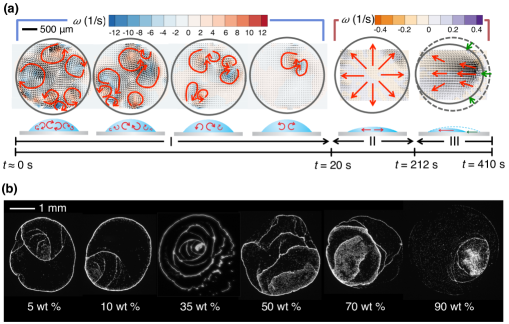
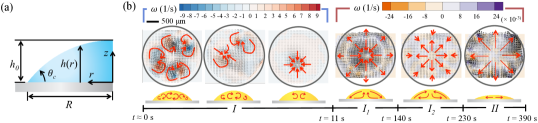
We investigated the flow field inside an evaporating whisky drop by using Particle Image Velocimetry (PIV) and recorded images of the final particle deposits (Movie 1 in supportinginformation ). To visualize the flow field inside droplets, we added 1 m diameter fluorescent particles (carboxylate-modified polystyrene, Invitrogen, USA) at a concentration of 8 10-4 vol%. A liquid volume 0.60 0.07 l was deposited on top of a solid substrate (VWR, USA) (see experimental details, Fig. S1 and Section S2, SI). During evaporation, the temperature and relative humidity were fixed, i.e. T = 299 K and RH = 50 %. The whisky drop (Glenlivet, UK) initially has radius = 1.3 mm, height = 0.46 mm, and apparent contact angle = 36∘ (see notations in Fig. 2(a)).
Initially (regime I), multiple vortices are observed as shown in Fig. 2(b), which is similar to the flow pattern of an ethanol-water (35:65 wt%) mixture (Fig. S2(a), SI). The complicated mixing flows are driven by solutal-Marangoni effects caused by a concentration variation because of the evaporation of ethanol Christy:2011jn ; Bennacer:2014fz . Due to this Marangoni flow, the particles are distributed everywhere. The typical flow speed is = (100 m/s) and the wall-normal vorticity is = = (1 s-1) for in-plane velocity .
After regime I, the flow is directed radially outward along the air-liquid interface and radially inward along the substrate (see the schematic side view of regime I1 of Fig. 2(b)). The flow speed is = (1 m/s) and the vorticity becomes weaker compared to regime I, e.g. = (10-3 s-1), as the size and strength of the vortex change. As the whisky drop evaporates further, we observed a reversed flow pattern showing an outward radial flow along the substrate and an inward radial flow along the air-liquid interface (regime I2 of Fig. 2(b)). Next, an outward capillary flow is observed as shown in regime II of Fig. 2(b) Deegan:1997fk . Thus, by this time we can assume that ethanol is almost completely evaporated. The distinct particle deposits after whisky completely dries appear linked to the flow fields identified as regimes I1 and I2, which are not observed in the ethanol-water (35:65 wt%) mixture droplet (Movie 2 in supportinginformation ). Therefore, an ethanol-water mixture can not produce a uniform deposit (Fig. S2(b), SI).
From the flow field differences between the whisky drop and the ethanol-water mixture drop, we suspect that some chemical compounds play a role in this flow field. To check we completely dried the whisky at room temperature (T = 298 K) and the dried solid residue of whisky was resolubilized in deionized water. Then, we investigated the flow field of this mixture droplet during evaporation. We observed that particles accumulated at the contact line were released from the contact line and moved along the liquid-air interface to the top center of the droplet due to a surfactant-driven Marangoni effect marin2015surfactant (Movie 3 in supportinginformation ). We measured the surface tension of this solution to be 60.5 mN/m, which is lower than distilled water’s surface tension 72.0 mN/m, and so we conclude that whisky contains molecules acting as surfactants. Natural phospholipids from various grains of whisky’s raw materials including barley, wheat, corn, and rye have been detected in whisky and, are the most likely source of these natural surfactants (Section S1, SI).
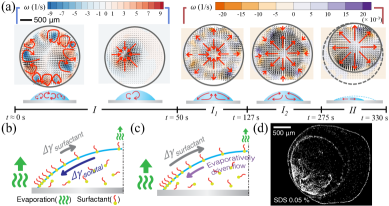
To check the effect of the surfactant, we prepared an ethanol-water (35:65 wt%) mixture containing 0.05 wt% sodium dodecyl sulfate (SDS, Sigma-Aldrich, USA), and we recorded the flow field and dried pattern. SDS is a common surfactant that has been used in previous studies of Marangoni flows Deegan:2000tb ; Still:2012bu ; marin2015surfactant . In our system, the initial surfactant concentration is lower than the critical micelle concentration suzuki1976studies . By adding surfactants, we mimicked the flow pattern of a drying whisky drop (Fig. 2(b) and 3(a)): two different circulating flows are observed after the initial multiple vortical flows. As the droplet evaporates, the ethanol concentration near the contact line is lower than that of the drop center due to the non-uniform evaporative flux along the droplet height Bennacer:2014fz , so the solutal Marangoni stress occurs along the droplet interface (Fig. 3(b)). Simultaneously, as the surface-active molecules, which in this case are a dissolved surfactant, accumulate at the contact line Still:2012bu and the ethanol concentration decreases in time, the surfactant-driven Marangoni stress becomes dominant (Fig. 3(c)). This flow transition indicates that initially a solutal Marangoni effect is dominant compared to a surfactant-driven Marangoni effect. From this and based on the literature Bennacer:2014fz ; cazabat2010evaporation ; marin2015surfactant , in this problem we can establish the hierarchy of Marangoni effects, i.e. 1) solutal, 2) surfactant, and 3) the thermal Marangoni effect. As a consequence of this competition between solutal- and surfactant-driven Marangoni stresses, we observe the sequence of opposite signed circulatory flows. The critical temporal evolution of the circulation transition can be investigated further by studying the droplet shape or the concentration of solute and surfactant. At longer times, if the surfactant is saturated everywhere, a typical outward radial capillary flow is observed (regime II, Fig. 2(b) and 3(a)).
The critical condition to induce the Marangoni flow caused by a surfactant and/or solute is considered next. The ethanol-water droplet with SDS is thin because 1 where 100 m and 1 mm for late times (e.g. after regime I). The typical flow speed 1 m/s (from PIV results), so that the Reynolds number 10-4, where density 103 kg/m3 and viscosity 1 mPas. Furthermore, the surface tension force is dominant compared to both the viscous and gravity forces, as the capillary number 10-7 and the Bond number 10-1, where = 9.8 m/s2 is gravity and 72 mN/m is the surface tension of water. Therefore, by using the lubrication approximation, in cylindrical () coordinates the Navier-Stokes equations can be simplified and the surface velocity at the liquid-air interface , nearly, a spherical cap, can be expressed as (see details in Section S4, SI)
| (1) |
Here, the capillary pressure = - where () is the perturbation to the liquid-air interface caused by the internal flow. Then, the interfacial velocity driven by the capillary pressure gradient scales as and the interfacial velocity driven by Marangoni effects is expected to have a magnitude of where the sign of determines the flow direction. If both velocities have the same order of magnitude,
| (2) |
then, for large interface deformation , we obtain the upper bound for of about 1 mN/m. This value is consistent with previous studies on the interface deformation of an evaporating droplet by Marangoni effects kajiya2009controlling ; poulard2007control . On the other hand, experimental observations indicate 1 N/m, for an evaporating water drop with SDS, which maintains a nearly spherical cap shape marin2015surfactant . From Eq. (S4), we estimate 0.1 m, which is negligible compared to the droplet size.
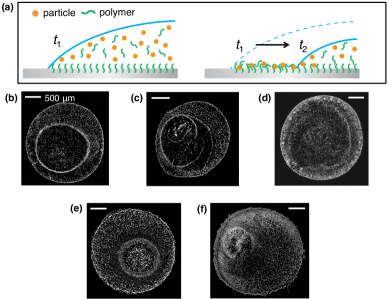
Although we mimicked the flow pattern of the drying of a whisky drop by adding SDS to a binary mixture, the particles are not uniformly distributed on the substrate, as shown in Fig. 3(d). We observed that in the model liquid drop when the contact line recedes, the contact line transports particles towards the center of the drop (Movie 4 in supportinginformation ) Deegan:2000tb ; berteloot2008evaporation . However, for a whisky drop, although the contact line recedes, the particles remain nearly uniformly distributed on a substrate (Movie 1 in supportinginformation ).
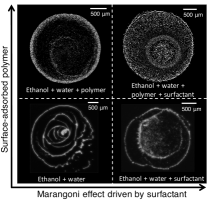
The chemical composition of whisky has been extensively investigated. According to the literature (see Section S1, SI), whisky contains natural polymers (e.g. lignin and polysaccharides). We hypothesize that some macromolecules, originally present in whisky, adsorb on a substrate and may play a role in adhesion and retention of the particles on the substrate. To test this idea, we added polymer, polyethylene oxide (PEO) (0.05 wt%), to the ethanol-water mixture with surfactant (0.05 wt%). At this polymer concentration, the polymer does not influence the flow field until regime I2. When the contact line recedes (regime II), the added polymer contributes to capture the particles on the surface but without polymers the receding contact line transports particles (see Movies 4 and 5 in supportinginformation ).
It is known that PEO can adsorb onto silica braithwaite1997effect ; trens1993conformation ; de1987polymers creating a “pseudo-brush” structure on the glass surface. The spatial density of adsorbed polymer is about 1 mg/m2 cabane1997shear , such that the quantity of adsorbed polymer is extremely small compared to the suspended polymer. As evaporation proceeds, the polymer concentration in the droplet increases. The polymer adheres on the silica substrate, which is not transported by the receding contact line. As a result, the particles are captured by a dense polymer structure and then remain adhered on the substrate. This adherence mechanism can be reproduced with different molecular weights (2 104 – 4 106 Da, PEO) and other polymers, e.g. hydroxyethycellulose, polyvinyl alcohol, and polyvinylpyrrolidone (Fig. S3, SI).
Also, we tested the effect of polymer without surfactant and a primary ring pattern is observed along the contact line (see Fig. 4), which is the signature of the coffee ring effect. As a result, the surfactant is crucial to prevent particle accumulation along the contact line.
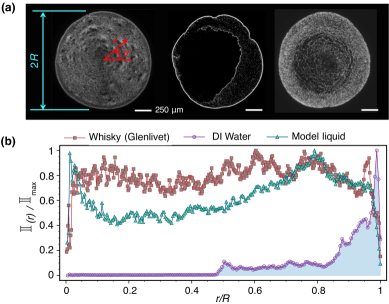
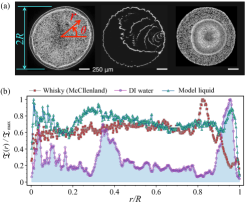
In Fig. 5(a), we compare the final deposition pattern of whisky, water, and the model liquid (respectively, from left to right), which are deposited on top of a cover glass. We then measure the average particle number density as a function of radial location (Fig. 5(b)), which exhibits significant correspondence in coating uniformity between whisky and the model liquid. As shown in Fig. 5, the proposed model liquid can produce a nearly uniform deposit. Here, we should note that different types of polymer can create different patterns (Fig. S3(b-f), SI). Presumably, the surface adsorbed macromolecules in whisky are not identical with the polymers that we used in this study. We also obtained a nearly uniform particle deposition pattern with another glass substrate, which has a lower contact angle with water (Fig. S4, SI).
In this Letter, we have shown that a combination of a binary mixture, surfactant, and surface-adsorbed polymer influences the final deposition pattern so that more uniform deposits occur. Based on understanding of the drying and coating mechanisms, we demonstrate that continuous mixing by distinct Marangoni flows and strong interaction between particles and a substrate are important to obtain a uniform deposit. Although the complex chemistry of whisky is not fully understood, we believe that these observations inspired by whisky drying are useful and applicable to coating processes more generally and the proposed method offers a new physicochemical avenue for control of coatings. To accomplish more controlled coatings, a future study can be devoted to analyze the interplay between the flow characteristics and the microstructure of a final deposit with respect to the spatial Deegan:1997fk and temporal marin2011order variations.
H.K. and H.A.S. acknowledge the DOE for support via grant no. DE-SC0008598. F.B. acknowledges that the research leading to these results received funding from the People Programme (Marie Curie Actions) of the European Union’s Seventh Framework Programme (FP7/2007-2013) under REA grant agreement 623541. We thank A. Perazzo, C. Poulard, E. Rio, H. Gelderblom, J. Nunes, and Y.L. Kong for helpful discussions.
References
- (1) R. D. Deegan, O. Bakajin, T. F. Dupont, G. Huber, and S. R. Nagel, Nature 389, 827 (1997).
- (2) H. Hu and R. G. Larson, J. Phys. Chem. B 110, 7090 (2006).
- (3) W. D. Ristenpart, P. G. Kim, C. Domingues, J. Wan, and H. A. Stone, Phys. Rev. Lett. 99, 234502 (2007).
- (4) J. Park and J. Moon, Langmuir 22, 3506 (2006).
- (5) J. R. E. Christy, Y. Hamamoto, and K. Sefiane, Phys. Rev. Lett. 106, 205701 (2011).
- (6) R. Bennacer and K. Sefiane, J. Fluid Mech. 749, 649 (2014).
- (7) A. M. Cazabat and G. Guéna, Soft Matter 6, 2591 (2010).
- (8) T. Still, P. J. Yunker, and A. G. Yodh, Langmuir 28, 4984 (2012).
- (9) W. Sempels, R. De Dier, H. Mizuno, J. Hofkens, and J. Vermant, Nat. Comm. 4, 1757 (2013).
- (10) C. Poulard and P. Damman, Europhys. Lett. 80, 64001 (2007).
- (11) L. Shmuylovich, A. Q. Shen, and H. A. Stone, Langmuir 18, 3441 (2002).
- (12) R. D. Deegan, Phys. Rev. E 61, 475 (2000).
- (13) P. J. Yunker, T. Still, M. A. Lohr, and A. G. Yodh, Nature 476, 308 (2011).
- (14) A. Askounis, K. Sefiane, V. Koutsos, and M. E. R. Shanahan, Colloid. Surface. A 441, 855 (2014).
- (15) M. Kuang, L. Wang, and Y. Song, Adv. Mater. 26, 6950 (2014).
- (16) W. Han and Z. Lin, Angew. Chem. Int. Ed. 51, 1534 (2012).
- (17) Y. Cai and B. Z. Newby, J. Am. Chem. Soc. 130, 6076 (2008).
- (18) S. Mishra, K. L. Barton, A. G. Alleyne, P. M. Ferreira, and J. A. Rogers, J. Micromech. Microeng. 20, 095026 (2010).
- (19) E. L. Talbot, H. N. Yow, L. Yang, A. Berson, S. R. Biggs, and C. D. Bain, ACS Appl. Mater. Interfaces 7, 3782 (2015).
- (20) Y. L. Kong, I. Tamargo, H. Kim, T.-W. Koh, B. N. Johnson, M. K. Gupta, H.-A. Chin, D. A. Steingart, B. P. Rand, and M. C. McAlpine, Nano Lett. 14, 7017 (2014).
- (21) M. Majumder, C. S. Rendall, J. A. Eukel, J. Y. L. Wang, N. Behabtu, C. L. Pint, T.-Y. Liu, A. W. Orbaek, F. Mirri, J. Nam, A. R. Barron, R. H. Hauge, H. K. Schmidt, and M. Pasquali, J. Phys. Chem. B 116, 6536 (2012).
- (22) K. Sefiane, Adv. Colloid Interface Sci. 206, 372 (2014).
- (23) F. Boulogne, F. Ingremeau, J. Dervaux, L. Limat, and H. A. Stone, Europhys. Lett. 112, 48004 (2015)
- (24) K. Sefiane, S. David, and M. E. R. Shanahan, J. Phys. Chem. B 112, 11317 (2008).
- (25) K. Sefiane, L. Tadrist, and M. Douglas, Int. J. Heat. Mass Tran. 46, 4527 (2003).
- (26) See Supplemental Materials at [URL has to be updated by PRL] for further details on whisky manufacturing procedures, experiments, and data processing, which includes Refs. Hui2012 ; Aylott1994 ; Duncan1966 ; Kahn1968 ; Williams1972 ; Salo1972 ; Clyne1993 ; Piggot1993 ; Conner1992 ; Conner1999 ; SIthielicke2010pivlab ; SIadrian2011particle ; SIrotenberg1983determination . The Supplementary Material includes also details on the analytic model and movies.
- (27) Y. H. Hui and E. Ö. Evranuz, Handbook of Plant-based Fermented Food and Beverage Technology, CRC Press (2012).
- (28) R. I. Aylott, A. H. Clyne, A. P. Fox, and D. A. Walker, Analyst 119, 1741 (1994).
- (29) R. E. B. Duncan and J. M. Philp, J. Sci. Food Agr. 17, 208 (1966).
- (30) J. H. Kahn, E. G. Laroe, H. A. Conner, J. Food Sci. 33, 395 (1968).
- (31) A. A. Williams and O. G. Tucknott, J. Sci. Food Agr. 23, 1 (1972).
- (32) P. Salo, L. Nykanen, and H. Suomalainen, J. Food Sci. 37, 394 (1972).
- (33) J. Clyne, J. M. Conner, A. Paterson, and J. R. Piggott, Int. J. Food Sci. Tech. 28, 69 (1993).
- (34) J. R. Piggot, J. M. Conner, A. Paterson, and J. Clyne, Int. J. Food Sci. Tech. 28, 303 (1993).
- (35) J. M. Conner, A. Paterson, and J. R. Piggott, J. Sci. Food Agr. 60, 349 (1992).
- (36) J. M. Conner, A. Paterson, and J. R. Piggott, J. Sci. Food Agr. 79, 1015 (1999).
- (37) W. Thielicke and E. J. Stamhuis, Published under the BSD license, programmed with Matlab 7 (2010).
- (38) R. J. Adrian and J. Westerweel, Particle Image Velocimetry, Cambridge University Press (2011).
- (39) Y. Rotenberg, L. Boruvka, and A. W. Neumann, J. Colloid Interf. Sci. 93, 169 (1983).
- (40) T. Yoneya, Handbook of Food Science, Technology, and Engineering, CRC Press, (2005).
- (41) K.-Y. M. Lee, A. Paterson, J. R. Piggott, and G. D. Richardson, J. I. Brewing 107, 287 (2001).
- (42) A. Marin, R. Liepelt, M. Rossi, and C. Kaehler, Soft Matter 12, 1593 (2016).
- (43) H. Suzuki, Bulletin of the Chemical Society of Japan 49, 1470 (1976).
- (44) T. Kajiya, W. Kobayashi, T. Okuzono, and M. Doi, J. Phys. Chem. B 47, 15460 (2009).
- (45) G. Berteloot, C.-T. Pham, A. Daerr, F. Lequeux, and L. Limat, Europhys. Lett. 83, 14003 (2008).
- (46) P. G. De Gennes, Adv. Colloid Interface Sci. 27, 189 (1987).
- (47) G. J. C. Braithwaite and P. F. Luckham, J. Chem. Soc. Faraday T. 93, 1409 (1997).
- (48) P. Trens and R. Denoyel, Langmuir 9, 519 (1993).
- (49) B. Cabane, K. Wong, P. Lindner, and F. Lafuma, J. Rheol. 41, 531 (1997).
- (50) Á. G. Marín, H. Gelderblom, D. Lohse, J. H. Snoeijer, Phys. Rev. Lett. 107, 085502 (2011).
Supporting Information
S1. Whisky manufacturing procedures
The raw cereals (e.g. barley, wheat, corn, or rye) are first broken down into sugars through enzymatic action in a process known as mashing. This process also draws nitrogen-rich amino acids into solution, which will eventually provide food for yeast growth. The result of the mashing (called ‘wort’) is inoculated with yeast to begin the fermentation process, which, over the course of a 2–3 days, produces a variety of important flavor molecules, including organic acids, higher alcohols, esters, ketones, and aldehydes, all of which are sufficiently volatile to be preserved throughout the final distillation Hui2012 .
The resulting ‘wash’ from fermentation is then distilled (in batches for malt whiskies or continuously for grain whiskies). The heat of distillation drives reactions which produce another family of flavor molecules, in addition to those generated during fermentation, and which are all collectively known as congeners. Unlike highly purified vodka, these congeners are retained in the final whisky product and are known for producing a distinctive flavor profile unique to each whisky recipe Aylott1994 and measurable using gas chromatography Duncan1966 ; Kahn1968 ; Williams1972 ; Salo1972 .
Fresh from distillation, the whisky is practically colorless with very harsh flavors, and thus the final step in whisky production, which distinguishes it from other distilled liquor, is maturation of the whisky in wooden casks. American or European white oak barrels are first charred (at 473 K) in order to produce a chemically active surface Clyne1993 and then filled with diluted distillate. The oak is made up of cellulose, hemicellulose, lignin, and a number of highly extractable molecules, including lipids, acids, sugars, and tannins Lee2001 . During the aging process, the distillate undergoes internal reactions with oxygen, which can permeate through the casks, as well as reactions with the surrounding wood, and finally the distillate extracts molecules from the wood itself Piggot1993 .
The extracted molecules provide some of the amber color associated with whisky (although most is likely due to artificial addition of caramel Yoneya2005 ) and have a significant effect on the final flavor and aroma. Lignin-related compounds are the most significant extract from the wood casks Conner1992 and serve to displace other volatile components from the air-whisky interface upon consumption, thereby drastically altering the so-called ‘headspace’ of odor directly above the whisky glass. Other wood extracts can also significantly affect this flavor release Conner1999 . Many of these wood extracts, like lipids, fatty acids, lactones, and phenols, can also affect the clarity of the whisky.
S2. Experimental details
For flow visualization, we performed Particle Image Velocimetry (PIV). We added 1 m carboxylate-modified polystyrene fluorescent particles into the working fluid. The Rhodamine-B fluorescent particles were illuminated with a green light source ( = 520 nm). The fluorescent signals from the particles ( 540 nm) were captured by either a high-speed CMOS camera (Phantom v7.3, USA) having a pixel resolution of 800 600 and a 8-bit dynamic range at a frame rate of 100 fps or a CCD camera built in a Leica microscope (Leica DFC 300 FX, Wetzlar, Germany) having a resolution of 1392 1040 pixels and a 12-bit dynamic range at a frame rate of 5 fps.
| References | Flow field | Deposition | Binary liquid | Surfactant |
|---|---|---|---|---|
| measurement | pattern | mixture | ||
|
Deegan et al. (1997) Deegan:1997fk-SI ,
Shmuylovich et al. (2002) shmuylovich2002surface-SI |
||||
| Deegan (2000) Deegan:2000tb-SI | ||||
|
Christy et al. (2011) Christy:2011jn-SI ,
Bennacer and Sefiane (2014) Bennacer:2014fz-SI |
||||
| Park and Moon (2006) Park:2006cp-SI | ||||
| Majumder et al. (2012) majumder2012overcoming-SI | ||||
| Askounis et al. (2014) askounis2014effect-SI | ||||
| Still et al. (2012) Still:2012bu-SI | ||||
| Sempels et al. (2013) sempels2013auto-SI | ||||
| Marin et al. (2016) marin2015surfactant | ||||
| Current work |
The flow field near the substrate was measured using PIV. We obtained in-plane velocity vectors, and the wall-normal vorticity was calculated based on the velocity vector field. The velocity vector calculation was performed using an open-source software, PIVlab, which is a time-resolved digital particle image velocimetry tool for Matlab SIthielicke2010pivlab . For the high-speed measurements, the velocity was obtained by performing iterative 2D cross-correlations of the particle distribution with multiple interrogation windows of 64 64 pixels with 50% overlap for the coarse grid and 32 32 pixels with 50% overlap for the refined grid system. Also, for recording with the microscope CCD camera, iterative 2D cross-correlations were performed with multiple interrogation window sizes. The first interrogation window used was 128 128 pixels with 50% overlap and then the next interrogation window used was 64 64 pixels with 50% overlap. The random error of the PIV measurements is about 0.02 pixel units for given interrogation domains. This error is consistent with typical measurement uncertainty SIadrian2011particle .
During the experiments, to control the temperature and relative humidity, we designed thermo-hygro-control hood. The evaporating droplet was kept in the control hood. The relative humidity is controlled by a humidity controller (ETS Microcontroller Model-5100, Glenside, PA, USA). During the experiment, the temperature is set at T = 299.0 0.6 K and the relative humidity is set at 50 2 %.
For the substrate preparation, cover (VWR, USA) and slide (Thermo Scientific, USA) glasses were cleaned in an acetone solution in an ultrasonic bath for 5 min, rinsed with deionized water (Millipore MilliQ, USA) and dried using nitrogen gas. The substrate was kept in an oven for 30 min at 333 K. Apparent contact angles with deionized water on top of the cover and slide glasses were 52∘ and 41∘, respectively.
For the side view measurements, a Nikon D5100 camera with Af-s Nikkor 70-200 mm f/4G lens was installed to observe the side view of an evaporating droplet. We recorded the side view of a drop deposited on a cover glass. The initial apparent contact angles of the ethanol-water mixture (35% : 65% by weight, respectively) was about and the whisky drop (Glenlivet 12 years old, UK) has = . The contact angle was determined from a fit to the liquid interface data within a distance of 50 m from the corner tip of the droplet.
S3. Measurement of physical properties
The physical property measurements were performed at T = 298 K. (1) Surface tension measurements were performed by means of a pendant droplet method. To calculate the surface tension, we used an in-house Matlab code that is based on the algorithm of Rotenberg et al. (1983) SIrotenberg1983determination . We validated the code by comparing with experimental results with a conventional Goniometer (Theta Lite, Biolin Scientific). (2) The viscosity of all liquids was measured with a Rheometer (Anton-Paar MCR 301, USA) with a sandblasted cylinder system (CC27 geometry). (3) The weight was measured by a Mettler Toledo XS105 scale.
We purchased several whisky products from a local liquor store, e.g. Glenlivet 12 and 15 years old (UK), Macallan (UK), McClelland(UK), and Glenffidich (UK). In this paper, we present the results of Glenlivet 12 years old and McClelland. The other products have similar results. The McClelland’s single malt scotch whisky has = 0.961 g/cm3, = 2.24 mPas, and = 30.7 mN/m and Glenlivet 12 years old has = 0.960 g/cm3, = 2.25 mPas, and = 38.6 mN/m. Ethanol (200 proof, anhydrous, 99.5%, Sigma-Aldrich, USA) was mixed with deionized water. The ethanol-water (35:65 wt%) mixture has = 0.929 g/cm3, = 2.24 mPas, and = 31.5 mN/m. The sodium dodecyl sulfate (SDS) (0.05 wt%) added mixture as = 0.929 g/cm3, = 2.24 mPas, and = 31.2 mN/m. The final model liquid consists of the binary mixture of ethanol and water, SDS (0.05 wt%), and polyethylene oxide (PEO) (0.05 wt%) ( = 0.929 g/cm3, = 2.23 mPas, and = 31.2 mN/m). The SDS (Sigma-Aldrich, USA) was tested and added into the final mixture with a concentration (0.05 – 0.3 wt%). Furthermore, we used different polymers, e.g. PEOs (6 105 and 4 106 Da), polyvinyl alcohol (3.1 104 – 5 104 Da), and polyethylene glycol (2 104 and 105) from Sigma-Aldrich in USA, and polyvinylpyrrolidone (2 104 Da) from Calbiochem in USA.
| SDS concentration | Surface tension | ||
|---|---|---|---|
| (wt%) | (mN/m) | ||
| 0.05 | 31.2 | ||
| 0.1 | 31.1 | ||
| 0.15 | 31.0 | ||
| 0.3 | 30.8 |
S4. Estimation of Marangoni effect
We consider an evaporating droplet with radius and height . The liquid-air interface is described by the function of , which is a nearly spherical cap. Assuming the lubrication approximation , the Navier-Stokes equations reduces in cylindrical coordinates to
| (S1) |
where is the pressure, the dynamic viscosity, and the radial velocity. By integrating (S1) according to , we can obtain the velocity profile as
| (S2) |
where there is a Marangoni shear stress boundary condition at = (, ) and a no slip boundary condition of the liquid-solid interface. Here, the pressure where is the perturbation to the liquid-air interface caused by the internal flow. Based on this, we could obtain the velocity at the liquid-air interface , such as
| (S3) |
Then, the interfacial velocity driven by the capillary pressure gradient can be estimated as magnitude and the interfacial velocity driven by Marangoni effects is expected to have magnitude where the sign of determines the flow direction. If both velocities have the same order of magnitude,
| (S4) |
S5. Image analysis and post processing
All the image analyses and post processing were done with Matlab 2014a. For the image processing, we removed the out-of-focus blurred particle images by using a high-pass filter and subtracting background noise, and then a 3 3 Gaussian smoothing was applied to reduce noise of the particle images. For the post processing, we calculated a vorticity field based on the velocity measurement results where = u and . Therefore, the wall-normal vorticity is = - for the in-plane velocity .
For the final deposition pattern of the particles, the deposit profile was averaged along the angular direction, i.e. = and was a local intensity. The intensity profile was normalized with the maximum of . The radial distribution was normalized with the drop radius , which is the smallest radius enclosing the deposit area.
References
- (1) Y. H. Hui and E. Ö. Evranuz, Handbook of Plant-based Fermented Food and Beverage Technology, CRC Press (2012).
- (2) R. I. Aylott, A. H. Clyne, A. P. Fox, and D. A. Walker, Analyst 119, 1741 (1994).
- (3) R. E. B. Duncan and J. M. Philp, J. Sci. Food Agr. 17, 208 (1966).
- (4) J. H. Kahn, E. G. Laroe, H. A. Conner, J. Food Sci. 33, 395 (1968).
- (5) A. A. Williams and O. G. Tucknott, J. Sci. Food Agr. 23, 1 (1972).
- (6) P. Salo, L. Nykanen, and H. Suomalainen, J. Food Sci. 37, 394 (1972).
- (7) J. Clyne, J. M. Conner, A. Paterson, and J. R. Piggott, Int. J. Food Sci. Tech. 28, 69 (1993).
- (8) K.-Y. M. Lee, A. Paterson, J. R. Piggott, and G. D. Richardson, J. I. Brewing 107(5), 287 (2001).
- (9) J. R. Piggot, J. M. Conner, A. Paterson, and J. Clyne, Int. J. Food Sci. Tech. 28, 303 (1993).
- (10) T. Yoneya, Handbook of Food Science, Technology, and Engineering, CRC Press (2005).
- (11) J. M. Conner, A. Paterson, and J. R. Piggott, J. Sci. Food Agr. 60, 349 (1992).
- (12) J. M. Conner, A. Paterson, and J. R. Piggott, J. Sci. Food Agr. 79, 1015 (1999).
- (13) W. Thielicke and E. J. Stamhuis, Published under the BSD license, programmed with Matlab 7 (2010).
- (14) R. J. Adrian and J. Westerweel, Particle Image Velocimetry, Cambridge University Press (2011).
- (15) Y. Rotenberg, L. Boruvka, and A. W. Neumann, J. Colloid Interf. Sci. 93, 169 (1983).
- (16) R. D. Deegan, O. Bakajin, T. F. Dupont, G. Huber, and S. R. Nagel, Nature 389, 827 (1997).
- (17) L. Shmuylovich, A. Q. Shen, and H. A. Stone, Langmuir 18, 3441 (2002).
- (18) R. D. Deegan, Phys. Rev. E 61, 475 (2000).
- (19) J. R. E. Christy, Y. Hamamoto, and K. Sefiane, Phys. Rev. Lett. 106, 205701 (2011).
- (20) R. Bennacer and K. Sefiane, J. Fluid Mech. 749, 649 (2014).
- (21) J. Park and J. Moon, Langmuir 22, 3506 (2006).
- (22) M. Majumder, C. S. Rendall, J. A. Eukel, J. Y. L. Wang, N. Behabtu, C. L. Pint, T.-Y. Liu, A. W. Orbaek, F. Mirri, J. Nam, A. R. Barron, R. H. Hauge, H. K. Schmidt, and M. Pasquali, J. Phys. Chem. B 116, 6536 (2012).
- (23) A. Askounis, K. Sefiane, V. Koutsos, and M. E. R. Shanahan, Colloid. Surface. A 441, 855 (2014).
- (24) T. Still, P. J. Yunker, and A. G. Yodh, Langmuir 28, 4984 (2012).
- (25) W. Sempels, R. De Dier, H. Mizuno, J. Hofkens, and J. Vermant, Nat. Comm. 4, 1757 (2013).
- (26) A. Marin, R. Liepelt, M. Rossi, and C. Kaehler, Soft Matter 12 1593 (2016).