X-ray Observations of Bow Shocks around Runaway O Stars.
The
case of Oph and BD43∘3654.
Abstract
Non-thermal radiation has been predicted within bow shocks around runaway stars by recent theoretical works. We present X-ray observations towards the runaway stars Oph (Chandra and Suzaku) and BD+43∘3654 (XMM-Newton) to search for the presence of non-thermal X-ray emission. We found no evidence of non-thermal emission spatially coincident with the bow shocks, nonetheless, diffuse emission is detected in the vicinity of Oph. After a careful analysis of its spectral characteristics we conclude that this emission has a thermal nature with a plasma temperature of K. The cometary shape of this emission seems to be in line with recent predictions of radiation-hydrodynamic models of runaway stars. The case of BD+43∘3654 is puzzling as non-thermal emission has been reported in a previous work for this source.
Subject headings:
stars: individual: Oph — stars: individual: BD43∘3654 — stars: winds, outflows1. Introduction
Runaway stars are thought to be ejected from their formation nursery with high velocities ( km s-1; Gies & Bolton, 1986; Tetzlaff et al., 2011). The origin of these high velocities is still a matter of debate. Some possibilities include the effects of close interactions between binary systems in a cluster (e.g., Hoogerwerf et al., 2000), strong gravitational interactions between single and binary systems (e.g., Fujii & Portegies Zwart, 2011), or kicks arising from a supernova explosion of a binary companion (e.g., Blaauw, 1961).
Runaway massive () stars moving supersonically through the interstellar medium (ISM) produce large-scale bow shocks. The gas and dust compressed in bow shocks is heated and ionized by the intense stellar radiation making these large scale ISM structures observable in infrared (IR) and in optical (e.g. H) emission (e.g., van Buren & McCray, 1988). Indeed, many stellar bow shocks have been detected in optical and IR wavelengths (e.g., van Buren et al., 1995; Kaper et al., 1997; Noriega-Crespo et al., 1997; Kobulnicky et al., 2010; Peri et al., 2012). Nevertheless, there are certain physical conditions for which a stellar bow shock may not form. For example, if the star is moving with sub-sonic velocities in a too tenuous, hot ambient medium or if it has a weak wind or a high space velocity (e.g., Comeron & Kaper, 1998; Huthoff & Kaper, 2002).
Bow shocks around massive stars are also detected at radio wavelengths. Benaglia et al. (2010) reported, for the first time, radio emission from the bow shock around a massive runaway star (BD+43∘3654). Their Very Large Array (VLA) observations provided a stark evidence that non-thermal radio emission is spatially coincident with the bow shock observed in infrared emission. Benaglia et al. (2010) argued that this non-thermal emission should arise from the cooling of energetic electrons by syncrotron emission. The electrons that produce this non-thermal radio emission could upscatter photons from the stellar and dust photon fields via the inverse Compton process, leading to high-energy emission. In particular, inverse Compton scattering into the X-ray band requires very low-energy electrons with Lorentz factors of the order of 100.
Since this discovery, a number of theoretical works have been presented to address the production of non-thermal emission at the position of the bow shock around runaway stars (see del Valle et al., 2015, and references therein). del Valle & Romero (2012) presented analytical calculations with applications to the closest runaway massive O-type star, Oph, and concluded that non-thermal X-ray and -ray emission from its bow shock should be detectable. This work was farther extended in del Valle & Romero (2014) where the model spectral energy distribution over the broad range of energy was presented.
The predictions of del Valle & Romero’s model were observationally tested by Schulz et al. (2014). Using the analysis of data accumulated during 57 months by the Fermi -ray Space Telescope, the first systematic search of -ray emission from 27 bow shocks around runaway stars was performed. No positive detections were obtained. It was demonstrated that for the case of Oph the upper limit on its -ray emission is 5 times below that predicted by del Valle & Romero (2012). At the X-ray wavelengths, Terada et al. (2012) presented Suzaku observations of BD43∘3654 and did not detect non-thermal X-ray emission associated to its bow shock. Only one marginal detection of non-thermal X-ray emission from a bow shock around a runaway star has been reported to date. This detection was claimed by López-Santiago et al. (2012) for AE Aurigae (HIP 24575) using XMM-Newton observations. Unfortunately, the data did not allow to discriminate between non-thermal and thermal emission.
Besides non-thermal radiation, X-rays from bow shocks originating in thermal plasma can be expected. A number of numerical simulations have shown that the stellar wind-ISM interaction resulting from (slow and fast) moving stars produce instabilities that mix material between the adiabatically shocked wind and the photoionized gas at the wake of the bow shock (e.g., Brighenti & D’Ercole, 1995a, b; Arthur & Hoare, 2006; Mackey et al., 2015; Meyer et al., 2015); this creates a mixing region capable of producing plasma temperatures of K. In particular, Mackey et al. (2015) presented radiation-hydrodynamic simulations on the formation of bow shocks around massive O-type stars and showed that these instabilities are capable of produce diffuse X-ray emission at the wake111Note, however, that the simulations presented by Mackey et al. (2015) are tailoled to runaway stars with velocities =4–16 km s-1..
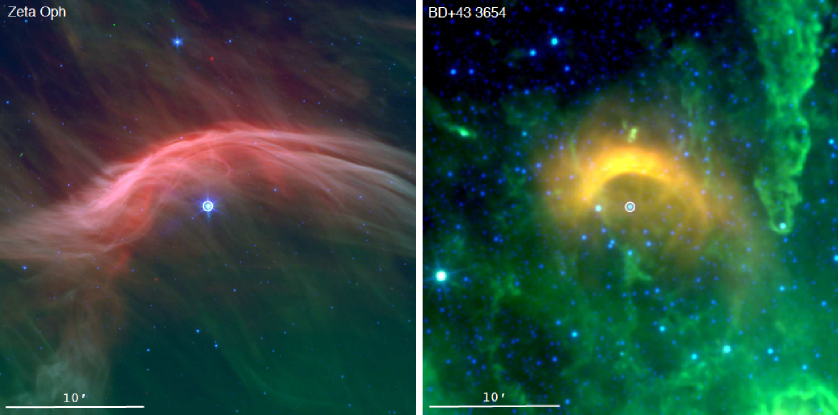
In this paper we present Chandra, Suzaku and XMM-Newton observations towards the runaway O stars Oph and BD+43∘3654 to explore the existence of extended X-ray emission associated to their bow shocks and its nature. Both of these runaway stars display extended bow shocks seen in mid-infrared images (see Figure 1) and they are relatively close and suffer only modest extinction, allowing to probe soft X-ray emission. This makes them the best candidates to test the predictions from theory.
The wind parameters of Oph (O9.2IV) were derived by Marcolino et al. (2009) from modeling its optical and UV spectra: yr-1 and terminal wind velocity km s-1, while from the analysis of its bow shock Gvaramadze et al. (2012) find an order of magnitude higher mass-loss rate yr-1. This discrepancy could be explained if the bulk of Oph wind is in a hot phase (Huenemoerder et al., 2012). In this case, the wind kinetic power is erg s-1.
From the analysis of the IR image of the bow shock around BD+43∘3654 (O4If), Kobulnicky et al. (2010) found a very large mass-loss rate for this star yr-1. However they pointed out that this value is uncertain because of poorly known ISM density around this object. The mass-loss rate of an O-type star with the same spectral type, Pup (O4If(n)) is yr-1 and wind velocity km s-1 (Oskinova et al., 2007; Šurlan et al., 2013). Adopting these parameters, results in a wind power of erg s-1.
The structure of the paper is as follows. In Section 2 we describe the X-ray observations. Section 3 gives a description of the results and spectral analysis. We discuss our findings and present our conclusions in Sections 4 and 5, respectively.
2. Observations
2.1. Oph
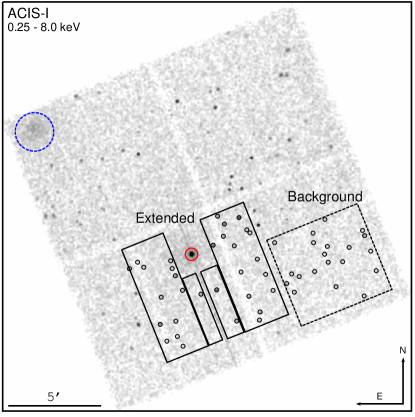
The Chandra observations of Oph were performed on 2013 July 3 (Observation ID: 14540; PI: L.M. Oskinova) using the Advanced CCD Imaging Spectrometer (ACIS-I) for a total exposure time of 72.1 ks. The Chandra Interactive Analysis of Observations (CIAO) software package version 4.6 (Fruscione et al., 2006) was used to analyze the data using CALB version 4.6.3. The resulting exposure time after excising dead time periods is 71.8 ks. Figure 2-left panel presents the field of view (FoV) of the ACIS-I observations in the 0.25–8.0 keV energy range. Several point-like sources can be identified as well as a diffuse source towards the northeast of the FoV of the ACIS-I detectors with its maximum located at (R.A.,Dec.)=(16h 37m 44.2s,10∘ 27 17.1). This source is spatially coincident with 1AXG J1637401027 as reported in the ASCA Medium Sensitivity Survey by Ueda et al. (2001) within the error reported by those authors.
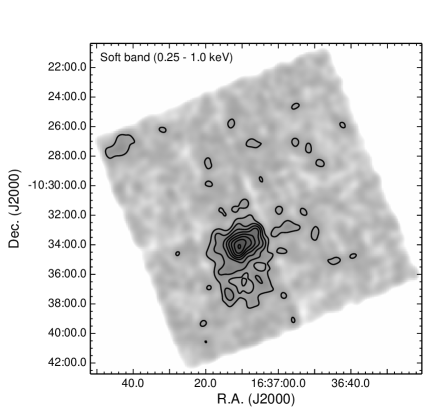
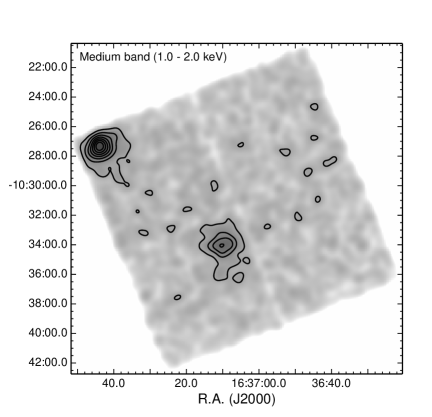
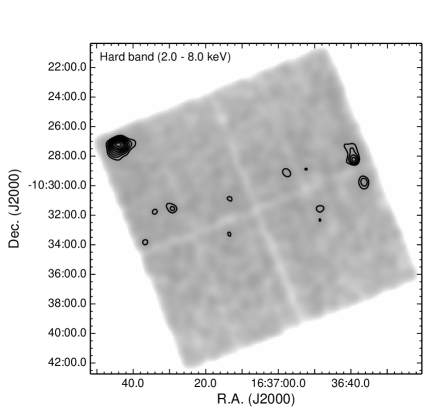
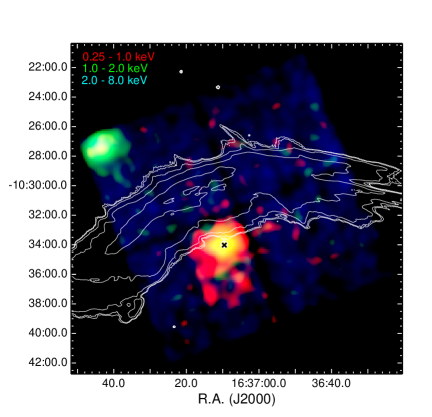
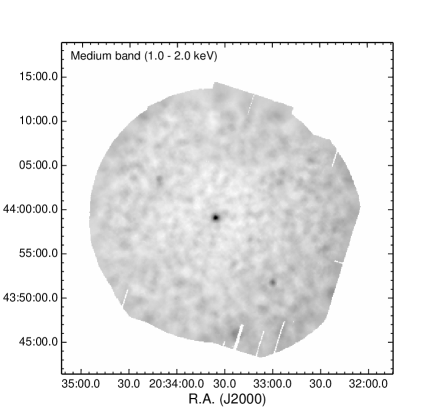
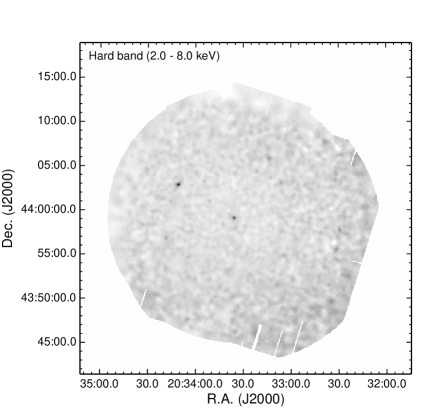
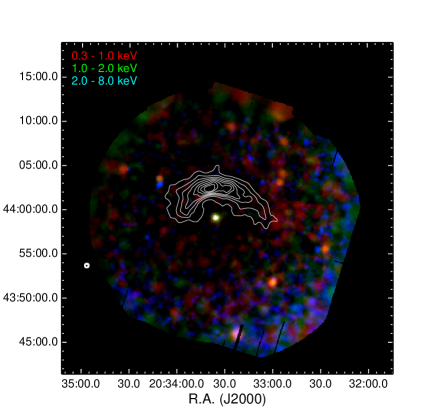
Exposure-corrected, background-subtracted images of the soft (0.25–1.0 keV), medium (1.0–2.0 keV), and hard (2.0–8.0 keV) X-ray images are presented in Figure 3. Point-like sources have been removed and the gaps have been filled with the CIAO task dmfilth. The final images were smoothed with the CIAO task aconvolve, with a Gaussian kernel of 4 in the brightest regions. A composite color picture of the three images is presented in Fig. 3-bottom right panel. White contours show the distribution of the MIPS 24 m emission around Oph.
We also used Suzaku observations of Oph to complement our study. These observations were performed on 2008 March 15 (Observation ID: 402038010; PI: W.L. Waldron) using the X-ray Imaging Spectrometers XIS 0, XIS 1, and XIS 3. The net exposure times for each camera are 95.7 ks. Due to their lower angular resultion, no spatial distribution of the X-ray-emitting gas can be performed from these cameras. We only used the Suzaku observations to performed the spectral study of Oph (see Section 3.1). To illustrate this, we show in the Appendix A the smoothed exposure-corrected image of the Suzaku XIS 1.
2.2. BD+43∘3654
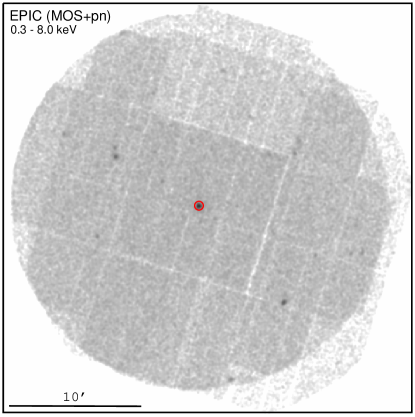
The XMM-Newton observations towards BD+43∘3654 were performed in 2010 May 8 (Observation ID: 0653690101; PI: V. Zabalza). The EPIC cameras were operated in the full-frame mode with the thin optical filter for a total exposure time of 38.5, 45.7, 45.7 ks for the EPIC-pn, MOS1, and MOS2 cameras, respectively. The observations were processed using the XMM-Newton Science Analysis Software (SAS version 13.5.0) with the associated calibration files (CCF) available on 2014 October 28. Figure 2-right panel shows the FoV of the EPIC observations in the 0.3–8.0 keV energy range. Unfortunately, the observations were severely affected by high-background levels and the final net exposure times are 7.0, 23.5, and 26.6 ks for the EPIC-pn, MOS1, and MOS2 cameras, respectively. We want to note that Terada et al. (2012) have used these XMM-Newton observations to search for point-like sources in the FoV of their Suzaku observations of BD+43∘3654, however, they did not performed further analysis of the XMM-Newton data.
Exposure-corrected, background-subtracted images at different bands (namely soft 0.3–1.0 keV, medium 1.0–2.0 keV, and hard 2.0–8.0 keV bands) were generated using the ESAS-XMM tasks. The final images have been adaptively smoothed using the ESAS-XMM task adapt requesting 50 counts for the three bands (see Figure 4). A composite color picture of the three images is presented in Fig. 4-bottom right panel. White contours show the distribution of the WISE 22 m emission around BD+43∘3654.
3. Results
As expected, both central stars are detected in X-rays. Figures 3 and 4 show the spatial distribution of the X-ray emission around our targets. As can be seen in Fig. 3 Chandra images show that diffuse X-ray emission is present close to Oph spatially coinciding with the likely location of the bow shock wake. On the other hand, we find no extended X-ray emission associated with the bow-shock apex.
Figure 4 corroborates the findings presented by Terada et al. (2012), who did not find any hint of diffuse X-ray emission associated with the bow shock around BD43∘3654 in their Suzaku observations.
3.1. X-rays from Oph
We carefully examined the Chandra images of Oph for the different energies and in full band to search for traces of diffuse emission associated with the bow shock. However, no such emission was detected. Hence, if any X-ray emission directly associated to the bow shock should exist, it shall be below the background level (see Section 4).
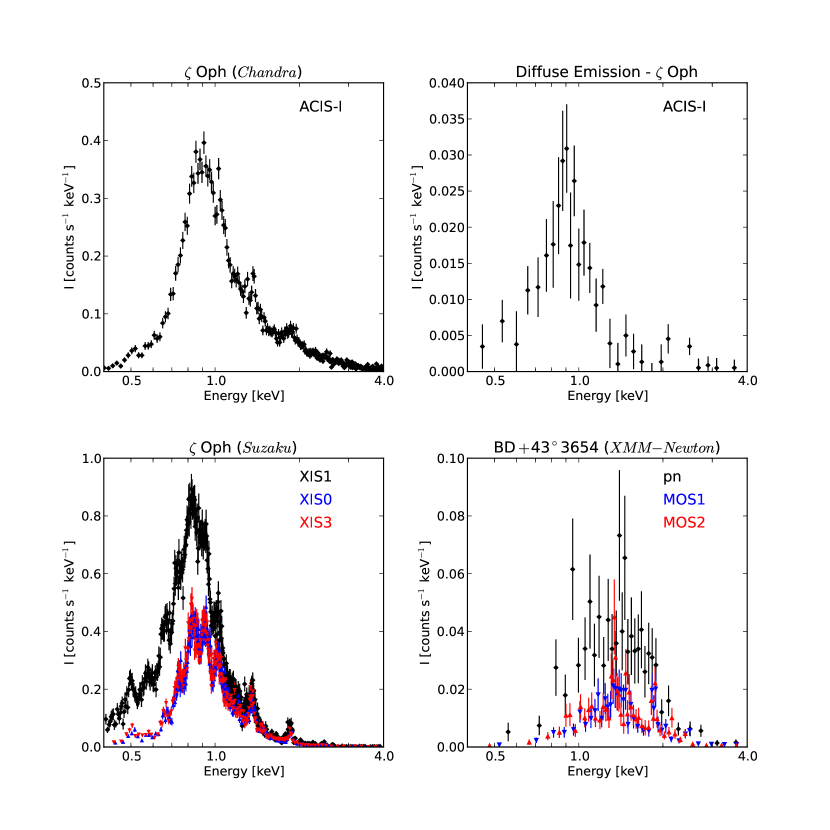
In order to study the physical properties of the X-ray emission from Oph and the apparent extended emission around it, we have extracted two spectra from the Chandra ACIS-I observations. A circular aperture with radius of 20 has been used to extract a spectrum from Oph, while the corresponding spectrum from the diffuse emission has been extracted from the polygonal apertures shown in Fig. 2-left panel. The background region for both spectra has been selected from a region with no diffuse X-ray emission. The spectra of Oph and its diffuse X-ray emission are presented in the top panels of Figure 5.
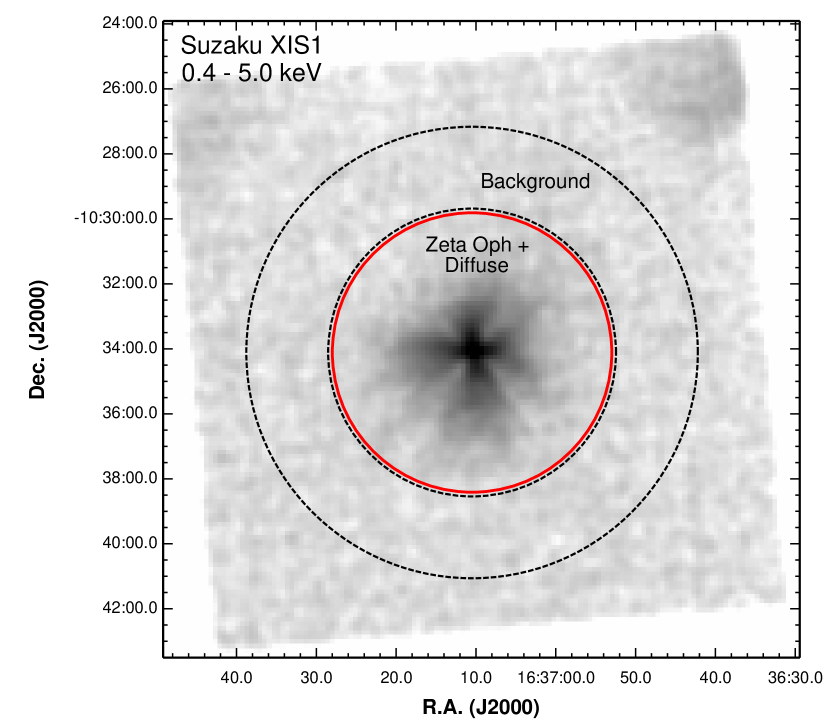
During the analysis of the Chandra data, we realized that the spectrum from Oph suffered from the effect of pile-up. Because of this, we decided to analyze the archived Suzaku data of this source. We have extracted the XIS 0, XIS 1, and XIS 3 spectra from a circular apertures with radii of 43 centered at the position of Oph, and the background region has been extracted from an annular region (see Appendix A for details). The Suzaku XIS0, XIS1, and XIS3 spectra are shown in Figure 5 - bottom left panel.
As expected, the Chandra and Suzaku spectra of Oph (Fig. 5 - left panels) present very similar features: a broad main feature centered at 0.9 keV, with two secondary peaks around 1.4 and 1.8 keV, and a rapid decay at energies greater than 3.0 keV. The spectrum of the apparently extended X-ray emission in vicinity of Oph was extracted from the polygonal regions defined in Fig. 2-left panel excising point-like sources present in these regions. The spectrum of extended emission is very similar to the spectrum of the central star (Fig. 5, top right panel), with maximum of spectral energy distribution at about 0.9 keV and no significant count rate below 0.4 keV.
To study physical properties of X-rays from Oph and the associated extended X-ray emission, we have performed spectral analysis using XSPEC (v.12.8.2 Arnaud, 1996). The fits were performed taking into account a Tuebingen-Boulder interstellar medium absorption model as incorporated in XSPEC (Wilms et al., 2000). The abundances for the star and that of the diffuse emission were assumed to be the same. We assumed the C, N, and O abundances as those reported by Villamariz & Herrero (2005). The interstellar column density was fixed according to known reddening of Oph at cm-2 (e.g. Liszt et al., 2009).
We started our modeling of Oph using a simple model and then increased its complexity. We have fit a i) single apec plasma temperature, ii) a two-temperature apec plasma model, iii) a power law model, iv) a one-temperature apec plasma model plus a power law component, and iv) a two-power law model. None of these combinations could fit the observed spectrum and resulted in fits with reduced bigger than 5, unless we include the effects of pile-up. Apparently the broad prominent spectral feature seen at around 1.8 keV is just a pile-up effect leading to the doubling of energies of photons at the maximum of spectral energy distribution around 0.9 keV. This is likely the reason that the 1.8 keV feature in the Suzaku spectra seems narrower, that is, is not affected by pile-up.
The best-fit model, taking into account the pile-up, resulted in a =1.98 and accounts for the contribution of a thermal component (an apec plasma model) and a power law model (see Table 1). The plasma temperature is =0.80 keV and the power law index of =3.05. Surprisingly, models including one plasma temperature () or two-plasma temperature components () did not resulted in a good fit (5), thus, we do not listed it in Table 1.
The absorbed and unabsorbed fluxes in the 0.4–4.0 keV energy range are =2.1010-12 erg cm-2 s-1 and =2.5010-12 erg cm-2 s-1, respectively. The total X-ray luminosity at a distance of 222 pc (see Megier et al., 2009) is =1.51031 erg s-1.
Assuming that the extended X-ray emission is a combination of the spillover created by the pile-up and the diffuse X-ray emission we have used the best-fit model parameters of Oph as components, plus another component. We note that we used the same ratio of the normalization parameters from the central star (=0.93). We found that the best-fit model was achieved accounting for a two temperatures components () and a fixed power law as obtained from Oph model (; see Table 1). The plasma temperature of the diffuse X-ray emission was found to be =0.20 keV (106 K). The absorbed and unabsorbed fluxes of this component resulted to be =8.410-14 erg cm-2 s-1 and =1.3010-13 erg cm-2 s-1. Its corresponding luminosity at a distance of 222 pc is =7.601029 erg s-1.
Finally, in order to assess the validity of the Chandra ACIS-I spectral fits, we have also modeled the X-ray emission as detected by Suzaku (Fig. 5 - bottom left panel). These observations do not have the resolution to spatially separate the X-ray emission from Oph and that of the extended emission. Thus, the Suzaku XIS0, XIS1, and XIS3 spectra include both the contribution of the central star and the putative diffuse emission.
First, we have modelled the X-ray emission as detected by the back-illuminated CCD XIS 1. The best fit model resulted in two components of keV (106 K) and keV (see Table 1). We then performed a joint fit to the three XIS cameras (XIS 0XIS 1XIS 3) and the best-fit model resulted in similar parameters (see Table 1). Thus, the Suzaku observations also point out at the existence of thermal plasma at 106 K gas whilst the second component, with plasma temperature of keV, corresponds to Oph.
3.2. X-rays from BD43∘3654
We do not detect any hint of diffuse X-ray emission associated to BD43∘3654 (see Figs. 2 and 4). Not at the position of the bow shock as in the case of the non-thermal radio emission (e.g., Benaglia et al., 2010) nor at the position of the wake as in the case of Oph.
In a similar way as in the previous section, we extracted pn, MOS1, and MOS2 spectra from a circular region with radius of 20 for the case of BD43∘3654. The background has been extracted from a region with no contribution of point sources towards the south. The resultant background-subtracted EPIC (pn, MOS1, and MOS2) spectra are shown in Fig. 5-bottom right panel. The EPIC-pn spectrum exhibit a broad feature around 1.0-2.0 keV, but the MOS spectra present clearer emission features at 1.4 keV and 1.8 keV. No significant emission is detected below 0.4 keV and above 4.0 keV.
In order to produce the best-fit model of the X-ray emission from BD43∘3654, we have fitted the three EPIC spectra (pn, MOS1, and MOS2) simultaneously. We have used a one-temperature apec optically thin plasma model with solar abundances. We let the column density () to be a free parameter in the fit as it unknown. The best-fit model resulted in an absorbing column density and plasma temperature of cm-2 and keV with a . Note that Terada et al. (2012) found very similar values from their analysis of Suzaku observations. More sophisticated models, e.g., a two-temperature plasma emission model or a power law contribution, did not improved the spectral fits, on the contrary, they resulted in models with .
The absorbed flux in the 0.4–4.0 keV energy range is =1.2010-13 erg cm-2 s-1 that corresponds to an intrinsic flux of =3.1510-12 erg cm-2 s-1. The X-ray luminosity at a distance of 1.4 kpc (see Comerón & Pasquali, 2007, and references therein) is =7.41032 erg s-1.
4. Discussion
So far, high-energy non-thermal emission is eluding detection in bow shocks around massive runaway O-type stars (e.g. Terada et al., 2012; Schulz et al., 2014, and this work). We would have expected that, if present, non-thermal X-ray emission should be spatially coincident with the bow shock detected in mid-IR wavelengths, but this is not the case for the two objects studied in the present paper. In particular, the lack of non-thermal diffuse X-ray emission from BD43∘3654 is puzzling as VLA observations assured the nature and presence of non-thermal particles. Although one might argue that the current XMM-Newton observations are not sensitive enough, Terada et al. (2012) did not find neither any signature of extended emission with their Suzaku observations as mentioned previously.
In order to set an upper limit to the non-thermal X-ray emission we have extracted the background-subtracted spectra of the two observations from regions spatially coincident of that of the bow shock, that is, where the non-thermal emission is expected. The corresponding background count rate in the 0.4–4.0 keV energy range for Oph and BD43∘3654 are 1.110-3 ACIS-I counts s-1 and 3.710-3 EPIC-pn counts s-1, respectively. Using the Chandra PIMMS tool222http://cxc.harvard.edu/toolkit/pimms.jsp we can estimate upper limits to the fluxes and luminosities. If we assume that the background emission can be modelled by a power law spectrum with , the estimated upper limits to the absorbed (unabsorbed) fluxes for Oph and BD43∘3654 are 9.5 (10.6) erg cm-2 s-1 and 1.5 (3.6) erg cm-2 s-1, whilst their corresponding normalization parameters are 2.410-6 cm-5 and 8.210-6 cm-5, respectively. The estimated upper limit to the X-ray luminosity in the 0.4–4.0 keV energy range is 6.21028 erg s-1 and 8.41030 erg s-1 for Oph and BD43∘3654, respectively. Note that Terada et al. (2012) estimated an upper X-ray luminosity of 1032 erg s-1 for the 0.5–10 keV energy range for their Suzaku observations of BD43∘3654 for a photon index =1.1. If non-thermal X-ray emission is produced, as suggested by analytical predictions (e.g., del Valle & Romero, 2012), its intensity should be below the background detection levels of the current X-ray satellites.
Extreme care should be taken when considering the Chandra observations of Oph, as they have been affected by pile-up. It must be noted that due to this effect, the final best-fit model of Oph (power law) is not to be taken as definite physical parameters of the star (specifically the power law component). This model should only be taken as the statistically best-fit model within the instrumental limitations. Anyhow, it helped us to restrict the physical origin of the extended emission, a thermal nature, in addition with the analysis of the Suzaku data.
The soft plasma temperature of this extended X-ray emission ( K) implies the existence of a mixing region between the adiabatically-shocked wind region (=107-108 K) and the ionized outer material (104 K), similar to that found in classic wind-blown bubbles (e.g., H ii regions, planetary nebulae, Wolf-Rayet nebulae, and superbubbles; Chu et al., 2001; Güdel et al., 2008; Jaskot et al., 2011; Toalá et al., 2015). Simulations presented by Mackey et al. (2015) suggest that, in the case of runaway stars, the most important mixing region is placed at the wake of the bow shock, which would produce a cometary-like distribution of X-ray-emitting gas. If this is the case for Oph, it would be the first wind-blown bubble around a single O-type star with diffuse X-ray emission.
We have also examined the archived Chandra HETG observations of Oph (Obs. ID:3857 and 2571) and found no evidence of this extended X-ray emission in the zero order images.
Finally, it is interesting to discuss the absence of thermal X-ray emission at the wake of BD43∘3654. Even though this star has a greater mechanical wind luminosity than Oph and can easily carve an adiabatically-shocked hot bubble due to its high stellar wind velocity ( 2250 km s-1; see Section 1), it does not exhibit diffuse X-ray emission. This might be due to the fact that the wake region in BD43∘3654 seems to be more contaminated by ISM material in the line of sight than Oph (as illustrated in Fig. 1). Moreover, this region is detected at the edge of the EPIC cameras which have a reduce sensitiviy as compared to the central regions.
5. Conclusions
We have presented Chandra, Suzaku, and XMM-Newton observations of the runaway O-type stars Oph and BD43∘3654 to investigate the presence of diffuse non-thermal X-ray emission associated to their bow shocks. We found no evidence of such X-ray emission associated to the bow shocks. Nevertheless, we have estimated upper limits for the non-thermal X-ray luminosity in the 0.4–4.0 keV energy range of 6.21028 erg s-1 and 8.41030 erg s-1 for Oph and BD43∘3654, respectively.
Although our Chandra observations of Oph suffered from pile-up, we are able to detect diffuse thermal emission with plasma temperature of K. The distribution and location of this diffuse X-ray emission in the wake of the bow shock provides observational support to the predictions of radiation-hydrodynamic results by Mackey et al. (2015). This makes Oph the first wind-blown bubble around a single O-type star that exhibits diffuse X-ray emission.
Future deep XMM-Newton observations of the present sources could help improve our findings and put new observational constrains to the current growing body of theoretical models.
Acknowledgments
We would like to thank the anonymous referee for helpful comments that helped improve our paper. JAT and MAG are supported by the Spanish MICINN (Ministerio de Ciencia e Innnovación) grant AYA 2014-57280-P. JAT and LMO acknowledge support from the ISM-SPP DFG Priority Program 1573. RI expresses appreciation for support that was provided by the National Aeronautics and Space Administration through Chandra Award Number G03-14008X, issued by the Chandra X-ray Observatory Center, which is operated by the Smithsonian Astrophysical Observatory for and on behalf of the National Aeronautics Space Administration under contract NAS8-03060.
Appendix A Suzaku observations
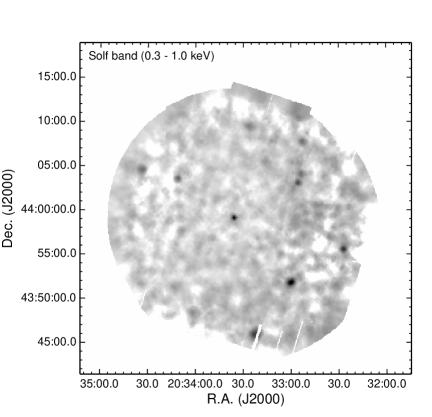
Figure A1 presents an image of the Suzaku XIS1 event file. The extraction region corresponds to a circular aperture of 43 in radius centered at the position of Oph. The background was extracted from an annular region with inner and outer radii of 443 and 7, respectively.
References
- Arnaud (1996) Arnaud, K. A. 1996, Astronomical Data Analysis Software and Systems V, 101, 17
- Arthur & Hoare (2006) Arthur, S. J., & Hoare, M. G. 2006, ApJS, 165, 283
- Benaglia et al. (2010) Benaglia, P., Romero, G. E., Martí, J., Peri, C. S., & Araudo, A. T. 2010, A&A, 517, LL10
- Blaauw (1961) Blaauw, A. 1961, Bull. Astron. Inst. Neth., 15, 265
- Brighenti & D’Ercole (1995a) Brighenti, F., & D’Ercole, A. 1995a, MNRAS, 273, 443
- Brighenti & D’Ercole (1995b) Brighenti, F., & D’Ercole, A. 1995b, MNRAS, 277, 53
- Chu et al. (2001) Chu, Y.-H., Guerrero, M. A., Gruendl, R. A., Williams, R. M., & Kaler, J. B. 2001, ApJ, 553, L69
- Comerón & Pasquali (2007) Comerón, F., & Pasquali, A. 2007, A&A, 467, L23
- Comeron & Kaper (1998) Comeron, F., & Kaper, L. 1998, A&A, 338, 273
- del Valle & Romero (2012) del Valle, M. V., & Romero, G. E. 2012, A&A, 543, AA56
- del Valle & Romero (2014) del Valle, M. V., & Romero, G. E. 2014, A&A, 563, AA96
- del Valle et al. (2015) del Valle, M. V., Romero, G. E., & Santos-Lima, R. 2015, MNRAS, 448, 207
- Drury (1983) Drury, L. O. 1983, Reports on Progress in Physics, 46, 973
- Fruscione et al. (2006) Fruscione, A., McDowell, J. C., Allen, G. E., et al. 2006, Proc. SPIE, 6270
- Fujii & Portegies Zwart (2011) Fujii, M. S., & Portegies Zwart, S. 2011, Science, 334, 1380
- Gies & Bolton (1986) Gies, D. R., & Bolton, C. T. 1986, ApJS, 61, 419
- Güdel et al. (2008) Güdel, M., Briggs, K. R., Montmerle, T., et al. 2008, Science, 319, 309
- Gvaramadze et al. (2012) Gvaramadze, V. V., Langer, N., & Mackey, J. 2012, MNRAS, 427, L50
- Hoogerwerf et al. (2000) Hoogerwerf, R., de Bruijne, J. H. J., & de Zeeuw, P. T. 2000, ApJL, 544, L133
- Huenemoerder et al. (2012) Huenemoerder, D. P., Oskinova, L. M., Ignace, R., et al. 2012, ApJ, 756, L34
- Huthoff & Kaper (2002) Huthoff, F., & Kaper, L. 2002, A&A, 383, 999
- Jaskot et al. (2011) Jaskot, A. E., Strickland, D. K., Oey, M. S., Chu, Y.-H., & García-Segura, G. 2011, ApJ, 729, 28
- Kaper et al. (1997) Kaper, L., van Loon, J. T., Augusteijn, T., et al. 1997, ApJ, 475, L37
- Kobulnicky et al. (2010) Kobulnicky, H. A., Gilbert, I. J., & Kiminki, D. C. 2010, ApJ, 710, 549
- Liszt et al. (2009) Liszt, H. S., Pety, J., & Tachihara, K. 2009, A&A, 499, 503
- López-Santiago et al. (2012) López-Santiago, J., Miceli, M., del Valle, M. V., et al. 2012, ApJL, 757, L6
- Mackey et al. (2015) Mackey, J., Gvaramadze, V. V., Mohamed, S., & Langer, N. 2015, A&A, 573, A10
- Marcolino et al. (2009) Marcolino, W. L. F., Bouret, J.-C., Martins, F., et al. 2009, A&A, 498, 837
- Megier et al. (2009) Megier, A., Strobel, A., Galazutdinov, G. A., & Krełowski, J. 2009, A&A, 507, 833
- Meyer et al. (2015) Meyer, D. M.-A., Langer, N., Mackey, J., Velázquez, P. F., & Gusdorf, A. 2015, MNRAS, 450, 3080
- Noriega-Crespo et al. (1997) Noriega-Crespo, A., van Buren, D., & Dgani, R. 1997, AJ, 113, 780
- Oskinova et al. (2007) Oskinova, L. M., Hamann, W.-R., & Feldmeier, A. 2007, A&A, 476, 1331
- Peri et al. (2012) Peri, C. S., Benaglia, P., Brookes, D. P., Stevens, I. R., & Isequilla, N. L. 2012, A&A, 538, AA108
- Schulz et al. (2014) Schulz, A., Ackermann, M., Buehler, R., Mayer, M., & Klepser, S. 2014, A&A, 565, A95
- Šurlan et al. (2013) Šurlan, B., Hamann, W.-R., Aret, A., et al. 2013, A&A, 559, A130
- Terada et al. (2012) Terada, Y., Tashiro, M. S., Bamba, A., et al. 2012, PASJ, 64, 138
- Tetzlaff et al. (2011) Tetzlaff, N., Neuhäuser, R., & Hohle, M. M. 2011, MNRAS, 410, 190
- Toalá et al. (2015) Toalá, J. A., Guerrero, M. A., Chu, Y.-H., & Gruendl, R. A. 2015, MNRAS, 446, 1083
- Ueda et al. (2001) Ueda, Y., Ishisaki, Y., Takahashi, T., Makishima, K., & Ohashi, T. 2001, ApJS, 133, 1
- van Buren & McCray (1988) van Buren, D., & McCray, R. 1988, ApJL, 329, L93
- van Buren et al. (1995) van Buren, D., Noriega-Crespo, A., & Dgani, R. 1995, AJ, 110, 2914
- Villamariz & Herrero (2005) Villamariz, M. R., & Herrero, A. 2005, A&A, 442, 263
- Wilms et al. (2000) Wilms, J., Allen, A., & McCray, R. 2000, ApJ, 542, 914
| Oph† | /DoF | |||||
|---|---|---|---|---|---|---|
| Power Law | 1.98=236.23/119 | |||||
| =0.80 keV | ||||||
| 5.210-4 cm-5 | =5.610-4 cm-5 | |||||
| Diffuse Emission | ||||||
| around Oph | ||||||
| Power Law | 1.24=38.52/31 | |||||
| =0.75 keV | (fixed) | |||||
| 3.410-5 cm-5 | cm-5 | |||||
| Power Law | 1.05=30.58/29 | |||||
| =0.85 keV | (fixed) | =0.20 keV | ||||
| 2.010-5 cm-5 | cm-5 | cm-5 | ||||
| Oph | ||||||
| Diffuse Emission | ||||||
| XIS1 | ||||||
| Power Law | 1.91=2975/1556 | |||||
| =0.65 keV | ||||||
| 9.510-4 cm-5 | =4.510-4 cm-5 | |||||
| XIS1 | ||||||
| 1.52=2371.61/1556 | ||||||
| =0.75 keV | keV | |||||
| 9.310-4 cm-5 | =2.110-3 cm-5 | |||||
| XIS0+XIS1+XIS3 | ||||||
| 1.50=5658.75/3769 | ||||||
| keV | =0.20 keV | |||||
| =9.410-4 cm-5 | 2.110-3 cm-5 | |||||
| XIS0+XIS1+XIS3 | ||||||
| Power Law | 1.89=741.5/394 | |||||
| keV | =0.24 keV | |||||
| =7.210-4 cm-5 | cm-5 | 1.410-3 cm-5 |
-
†Model performed accounting for the pile-up effect.