Chain Reconnections observed in Sympathetic Eruptions
Abstract
The nature of various plausible causal links between sympathetic events is still a controversial issue. In this work, we present multi–wavelength observations of sympathetic eruptions, associated flares and coronal mass ejections (CMEs) occurring on 2013 November 17 in two close–by active regions. Two filaments i.e., F1 and F2 are observed in between the active regions. Successive magnetic reconnections, caused by different reasons (flux cancellation, shear and expansion) have been identified during the whole event. The first reconnection occurred during the first eruption via flux cancellation between the sheared arcades overlying filament F2, creating a flux rope and leading to the first double ribbon solar flare. During this phase we observed the eruption of overlaying arcades and coronal loops, which leads to the first CME. The second reconnection is believed to occur between the expanding flux rope of F2 and the overlying arcades of the filament F1. We suggest that this reconnection destabilized the equilibrium of filament F1, which further facilitated its eruption. The third stage of reconnection occurred in the wake of the erupting filament F1 between the legs of overlying arcades. This may create a flux rope and the second double ribbon flare and a second CME. The fourth reconnection was between the expanding arcades of the erupting filament F1 and the nearby ambient field, which produced the bi-directional plasma flows towards both upward and downward. Observations and a nonlinear force-free field extrapolation confirm the possibility of reconnection and the causal link between the magnetic systems.
1 Introduction
Solar filaments or prominences are characterized as cooler and denser plasma structures suspended in the hotter and more–tenuous corona. Filaments and prominences are considered as the same physical object but observed in the solar disk and off the solar limb, respectively. They always lie above the polarity inversion lines (PILs) at different locations on the Sun, for example, in the active regions, at the boundary of the active regions, or in the quiet regions, which are called respectively as active region filaments, intermediate filaments, and quiescent filaments (Labrosse et al., 2010; Mackay et al., 2010, and references cited therein).
Upward magnetic pressure, downward magnetic tension, gravity and the gas pressure gradient forces keep filaments in the equilibrium state in the chromosphere and in the corona (Forbes, 2000; Schmieder et al., 2013, and references cited therein). The filaments could undergo different kinds of eruptions such as full, partial, failed or asymmetric eruptions when the equilibrium breaks (Gilbert et al., 2007; Guo et al., 2010a; Zhang et al., 2015). In a full eruption, the filament material and the associated magnetic field structure escape from the Sun and produce a coronal mass ejection (CME; Gilbert et al., 2000; Schmieder et al., 2015). In a failed eruption, neither the filament material nor the associate magnetic field structure erupts (Török & Kliem, 2005; Liu, 2008; Liu et al., 2009; Guo et al., 2010a; Joshi et al., 2013a, 2014; Jiang et al., 2014; Joshi et al., 2014). Various factors have been identified for the failed filament eruption such as a slow decrease of the overlying magnetic field (e.g., Török & Kliem, 2005), a stronger overlying magnetic field (e.g., Liu, 2008) or an asymmetric background magnetic field (e.g., Liu et al., 2009). More recently, Sun et al. (2015) and Chen et al. (2015) studied several confined flares and eruptions from AR 12192 during 2014 October 18 to 29 and found that the strong confinement of the overlying field may be the cause. In partial eruptions, some parts of the filament magnetic structure erupt while the other parts do not erupt, depending on the location of magnetic reconnection over or inside the filament (Gilbert et al., 2000; Gibson & Fan, 2006; Tripathi et al., 2009). Asymmetric filament eruptions are the eruptions when one leg of the filament erupts while the other one remains anchored on the Sun (Liu et al., 2009; Joshi et al., 2013a).
Various factors have been observed to be responsible for the eruptions such as filament footpoint rotation (e.g., Török et al., 2013), flux emergence near the filament system (e.g., Chen & Shibata, 2000), large decrease of the photospheric magnetic field strength (e.g., Schmieder et al., 2008) or transfer of flux from one system to another one (e.g., Liu et al., 2012). Based on some observations and simulations, a number of theoretical models have been developed for the solar eruptions, such as the tether–cutting (Moore et al., 2001), flux cancellation (van Ballegooijen & Martens, 1989; Martens & Zwaan, 2001), magnetic breakout (Antiochos et al., 1999) and flux emergence models (Chen & Shibata, 2000). Ideal magnetohydrodynamic (MHD) instabilities has also been suggested as the cause for solar eruptions, i.e., kink and torus instabilities (e.g., Török & Kliem, 2005; Liu, 2008).
Successive solar eruptions and flares occurring within a short time with a physical link, either in one complex or in different active regions, are known as “sympathetic events” (Wang et al., 2001; Moon et al., 2002; Wang et al., 2007; Jiang et al., 2011). Sympathetic eruptions have been observed and studied in the past years (Zhukov & Veselovsky, 2007; Jiang et al., 2009; Liu et al., 2009; Jiang et al., 2011; Schrijver & Title, 2011; Yang et al., 2012; Shen et al., 2012). Wang et al. (2001) studied two sympathetic M–class solar flares and associated CMEs that occurred on 2000 February 17 from two different active regions. Liu et al. (2009) reported successive solar flares and associated two fast CMEs on 2005 September 13 from NOAA AR 10808 and discussed the causal relationship between these eruptions. Schrijver & Title (2011) identified a series of flares and eruptions during 2010 August 1–2 and found that all these events are connected with a set of separatrices, separators, and quasi-separatrix layers. Jiang et al. (2011) presented observations of three successive filament eruptions from different locations on 2003 November 19 and interpreted these sympathetic eruptions from coronal dimming investigations. Yang et al. (2012) presented detailed observations of two filament eruptions on 2005 August 5 in a bipolar helmet streamer type configuration and interpreted these eruptions as sympathetic. Shen et al. (2012) reported two sympathetic solar eruptions in a quadrupolar magnetic configuration occurred on 2011 May 12. In all these observational studies, they found some physical links between the two sympathetic events. Apart from observational works, there are a few simulations that have been performed to understand the sympathetic eruptions more clearly (e.g., Török et al., 2011; Lynch & Edmondson, 2013). Török et al. (2011) simulated the sympathetic filament eruptions that occurred on 2010 August 1. Lynch & Edmondson (2013) presented a 2.5D MHD simulation of sympathetic magnetic breakout CMEs in a coronal pseudo–streamer type magnetic configuration. Among the various proposed interpretations and theories, some involve the removal of high–altitude coronal arcades through ideal or resistive processes (Jiang et al., 2009; Schrijver & Title, 2011; Török et al., 2011; Yang et al., 2012; Shen et al., 2012), while others involve sequential reconnections between adjacent flux systems (Liu et al., 2009; Chandra et al., 2011; Liu & Ofman, 2014; Dalmasse et al., 2015).
Sympathetic eruptions and flares have been observed but the actual magnetic link and the physical mechanisms of these events are not fully clear. In this work, we present multiwavelength observations and interpretations of two successive eruptions from two different active regions that occurred on 2013 November 17. We discuss the multi-stages of the reconnections that occurred during these eruptions. We focus on the following main questions, (1) what are the reasons behind these sympathetic events? (2) how the reconnection occur between the arcades and/or the flux rope? (3) what are the role of these interactions/reconnections? We organize our paper as follows: Section 2 deals with the description of the observational data set used in the present paper. Magnetic structure and morphological evolution of the sympathetic eruptions, flares and associated CMEs are presented in Section 3, where the nonlinear force-free field (NLFFF) extrapolation and the associated results are discussed in Section 3.8. The main results and their discussions are presented in the last section (Section 4).
2 Observational Data Set
We use the Global Oscillation Network Group (GONG) H observations for the current study and collect data from the GONG archive (i.e., http://halpha.nso.edu/archive.html). It provides images at 6563 Å wavelength with a spatial resolution of and a cadence of around 1 minute (Harvey et al., 2011). The H observations are used to study the filament eruption dynamics. For the multiwavelength analysis, we have also used the data observed by the Atmospheric Imaging Assembly (AIA; Lemen et al., 2012), which provides full disk images in two Ultraviolet (UV), one white-light and seven Extreme Ultraviolet (EUV) wavelengths. AIA provides EUV images with a minimum cadence of 12 s and a pixel size of . Magnetic field data are observed by the Helioseismic and Magnetic Imager (HMI; Schou et al., 2012). HMI images have a spatial resolution of with a minimum cadence of 45 s for the line-of-sight magnetic field and a minimum cadence of 720 s for the vector magnetic field. AIA and HMI are two of the instruments on board the Solar Dynamics Observatory (SDO).
To study the kinematics of the eruptions in the limb view, we use the Sun Earth Connection Coronal and Heliospheric Investigation/Extreme Ultraviolet Imager (SECCHI/EUVI) data. It is an instrument on board the Solar Terrestrial Relation Observatory (STEREO; Wuelser et al., 2004; Howard et al., 2008a). It observes the Sun in four wavelengths, i.e., 304, 195, 284 and 171 Å. STEREO-A/EUVI images have a spatial resolution of . X-ray data have been taken from the Reuven Ramaty High–Energy Solar Spectroscopic Imager (RHESSI; Lin et al., 2002) and the images have been reconstructed using the clean algorithm with an integration time of around 60 s. To study the CMEs associated with the eruptions, we have used the chronograph data observed by STEREO-A/COR1 (Howard et al., 2008b) and the Large Angle and Spectrometric Coronagraph (LASCO; Brueckner et al., 1995) on board the Solar and Heliospheric Observatory (SOHO).
3 Multiwavelength Observations of the Sympathetic Events
3.1 Morphology and Magnetic Properties of the Filaments
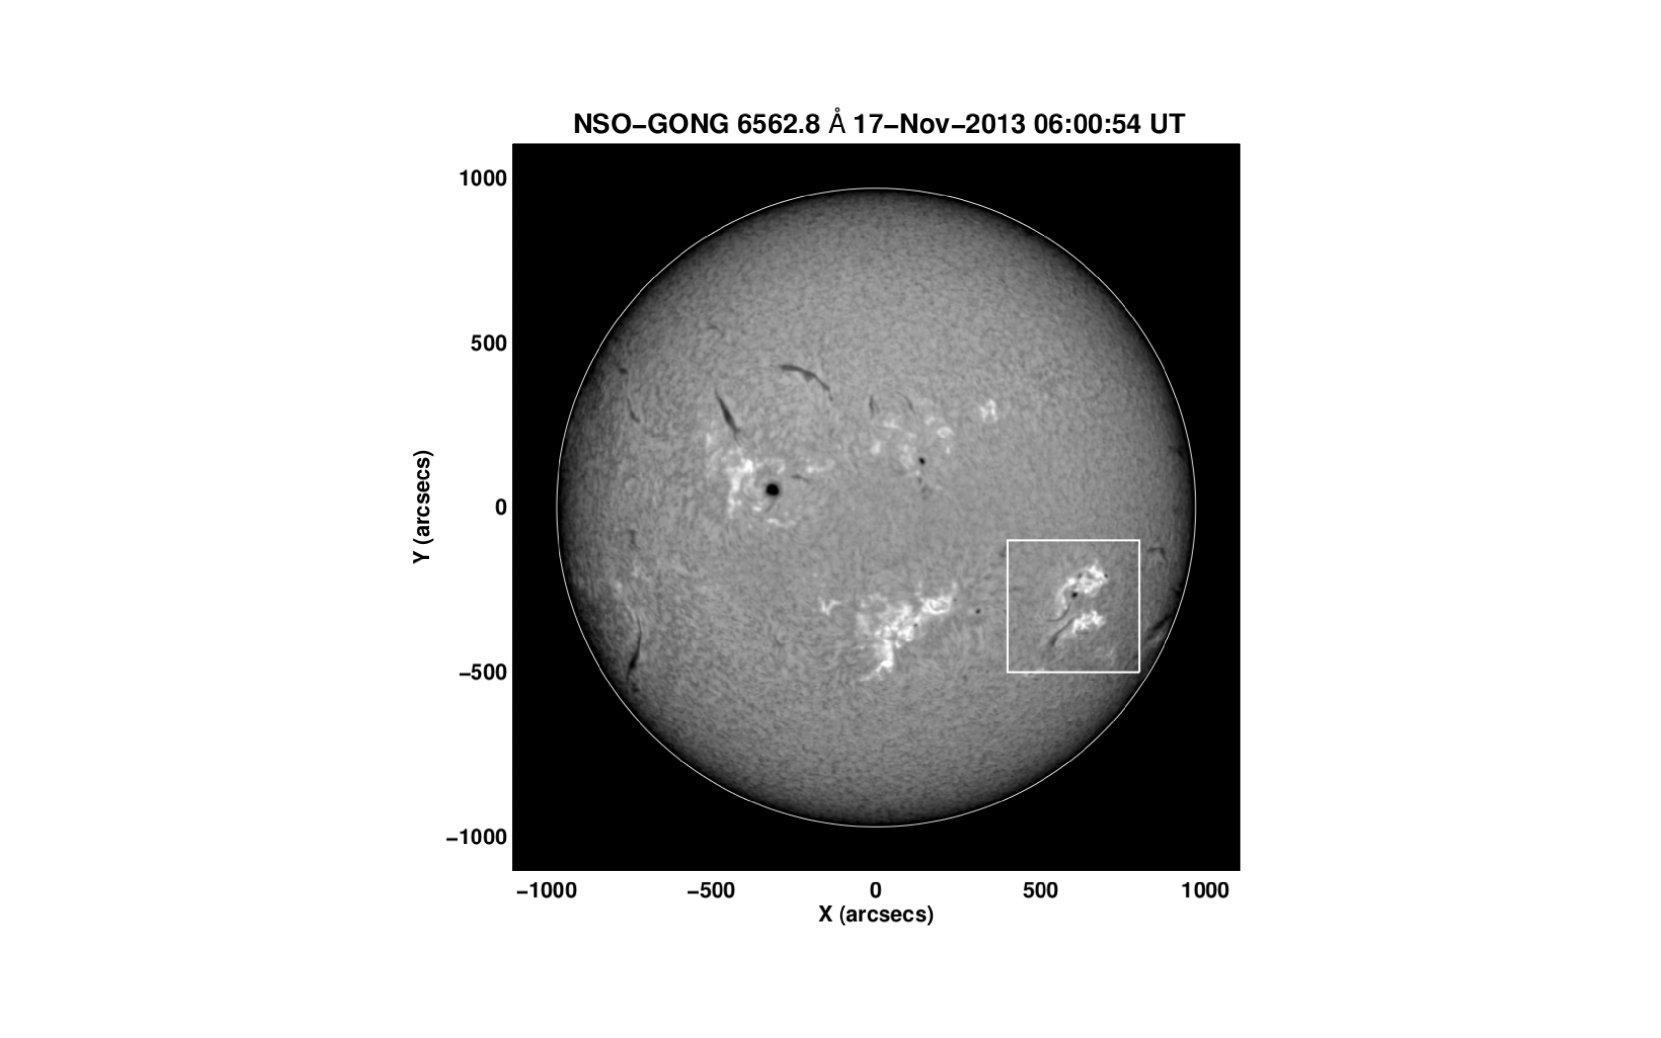
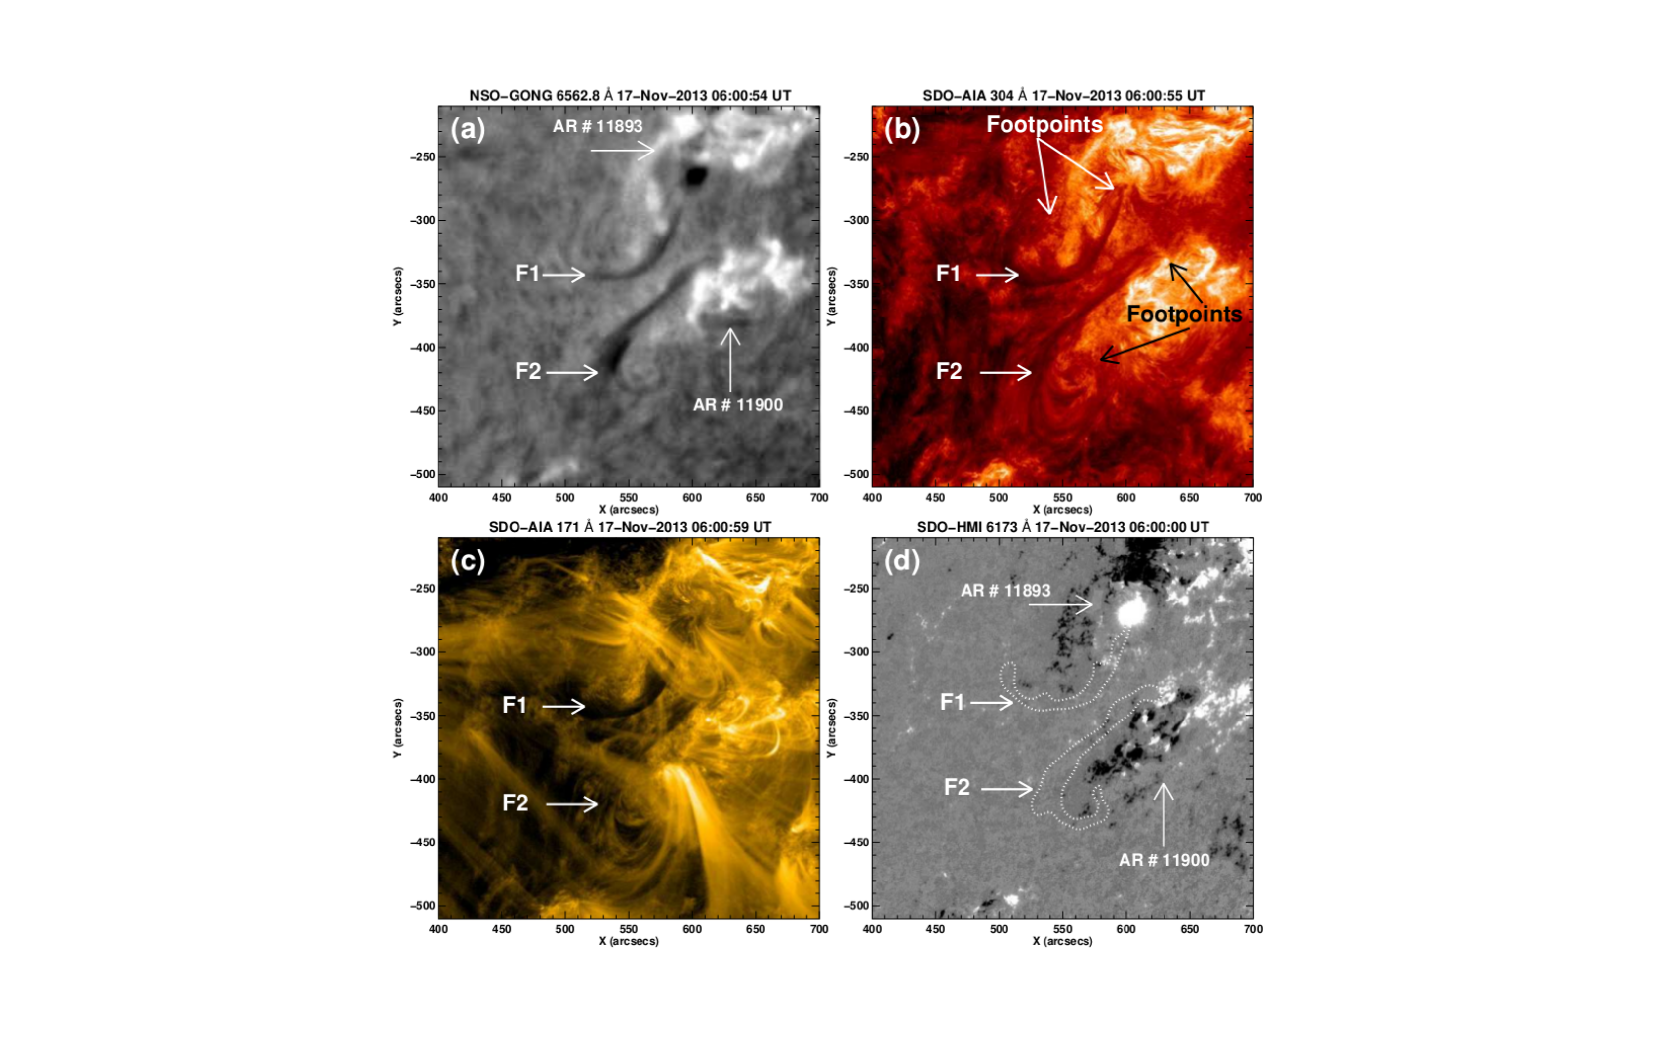
Two nearby filaments were observed on 2013 November 17 in the southwest part of the Sun (Figure 1). The general structure of the filaments can be seen in Figure 2. It displays GONG H, SDO/AIA 304 and 171 Å zoomed images of the filaments at 06:00 UT (Figures 2(a), 2(b) and 2(c) respectively). The northward and the adjacent southward filaments are represented by “F1” and “F2” respectively. They are at the border of two different active regions, i.e., NOAA 11893 and 11900 respectively. GONG H image shows the location of the core dark filament material (Figure 2(a)), while the extended filament channels can be seen in SDO/AIA EUV images (Figures 2(b) and 2(c)). It can be seen that the dark filament material observed in H lies in the middle of the extended filament channels. The filament channel could be the projection of the flux rope or cavity or it could be due to a different behavior of the transition region below the flux rope (Aulanier & Schmieder, 2002; Filippov et al., 2015). Different extrapolations of magnetic field lines in filament environment suggest that H material of filaments is supported in the magnetic dips of a flux rope or sheared magnetic arcade (Aulanier et al., 1998; van Ballegooijen, 2004; Guo et al., 2010b). The flux rope is overlaid by arcades in the corona and is anchored in the photosphere by barbs or footpoints created by parasitic polarities close to the PIL. The whole magnetic structure is called filament system.
The anchoring of the filament footpoints can be identified by comparing the H and SDO/AIA EUV observations with an SDO/HMI magnetogram. The approximate locations of the footpoints are pointed out in Figure 2(b) in which they are clearly visible. We have tracked the contours of the approximate core filament region visible in H of both filaments and over–plotted in the SDO/HMI magnetogram (Figure 2(d)). The magnetogram represents the line–of–sight component of the Sun’s magnetic field. We have identified the footpoints of the two filaments. It is clear that the northern and southern foot points of both filaments are anchored in the positive and negative polarity regions in their respective active regions. The northern footpoints of both filaments lie near the center of the active regions, while the southern footpoints are anchored at the boundary of the respective active regions. It is also important to note that the filaments are situated along the periphery of the active regions in the disk projection. The magnetic field between the two filaments is mostly consisting of positive polarity, while the other sides are mostly negative polarity.
The two filaments are located in the southern hemisphere, but they have different chirality. Filament F2 is dextral, or, equivalently the magnetic helicity is negative, because of the following reasons. First, the filament forms an inverse J shape as shown in Figure 2. Secondly, according to the definition in Martin (1998a, b), if one stands at the positive polarity, the axial magnetic field points to the right. Also, the filament barb is right bearing, although it does not have a one to one correlation with the filament chirality (Guo et al., 2010b). On the other hand, filament F1 is sinistral with a similar analysis as for filament F2. Therefore, the chirality of the two filaments is opposite. And the chirality of filament F2 is opposite to the dominant helicity sign of active regions in the southern hemisphere, which should be sinistral or positive in the term of magnetic helicity (c.f., Martin, 1998a, b; Pevtsov et al., 2003; López Ariste et al., 2006).
3.2 Magnetic Field Changes in the Two Active Regions
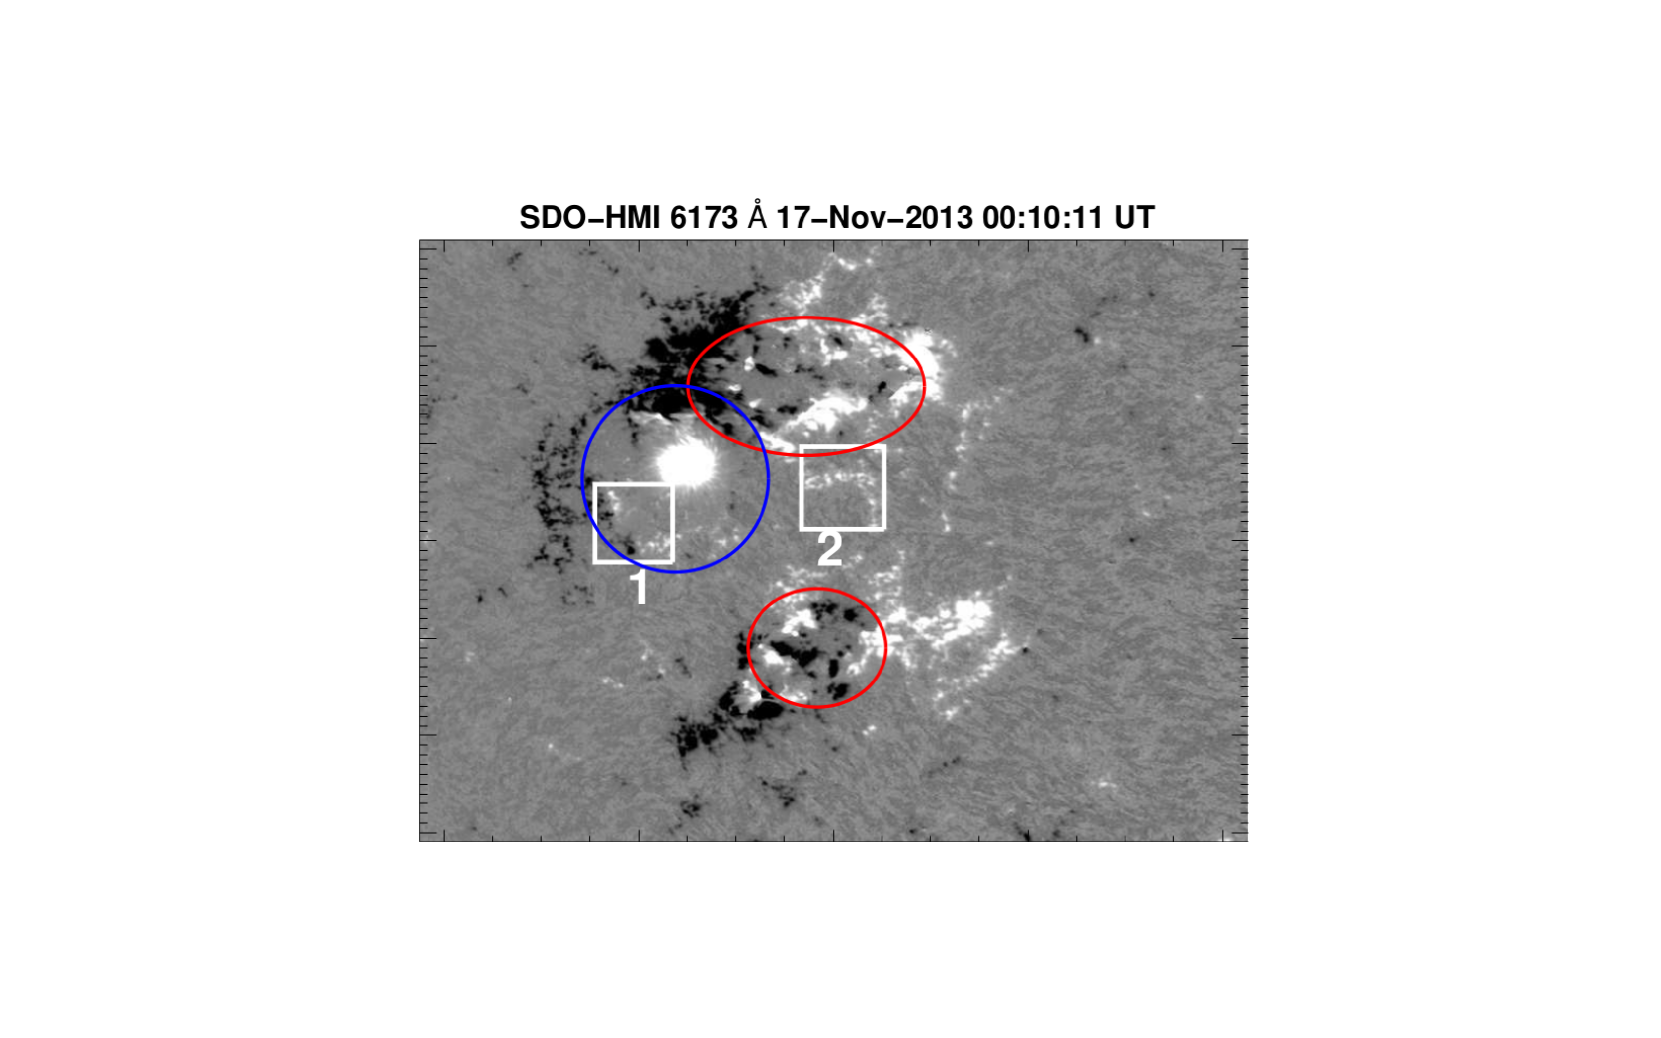
Figure 3 shows the radial component of the magnetic field at 00:10:11 UT on 2013 November 17. The magnetic field image has been corrected for the 180 degree ambiguity and the projection effect (Hoeksema et al., 2014). We observe several magnetic field changes in both active regions before the start of the first eruption. All these changes can be seen very well in the SDO/HMI radial component movie (movie attached with Figure 3). Both active regions show several tiny flux emerging regions. These regions are shown by the northern and southern red ovals. These emerging regions show divergence motions as they expand. In the northern active region, the expansion towards the southwest disturbs the remnant network polarities such as the positive polarity in box 2. We will see the importance of this polarity because magnetic field lines of both filament systems F1 and F2 are anchored in this polarity (see Section 3.8). Moreover, in the northern active region, the following spot is in a decaying phase. It is surrounded by moving magnetic features, which form a moat region around it. This moat region is shown by a blue circle in Figure 3. It is observed that many small bi–poles are canceling at the border of the moat region. One of the strong flux cancellation region is observed in box 1. This cancellation may trigger one reconnection (the third one probably).
3.3 First Eruption and Associated Flare: First Stage Reconnection
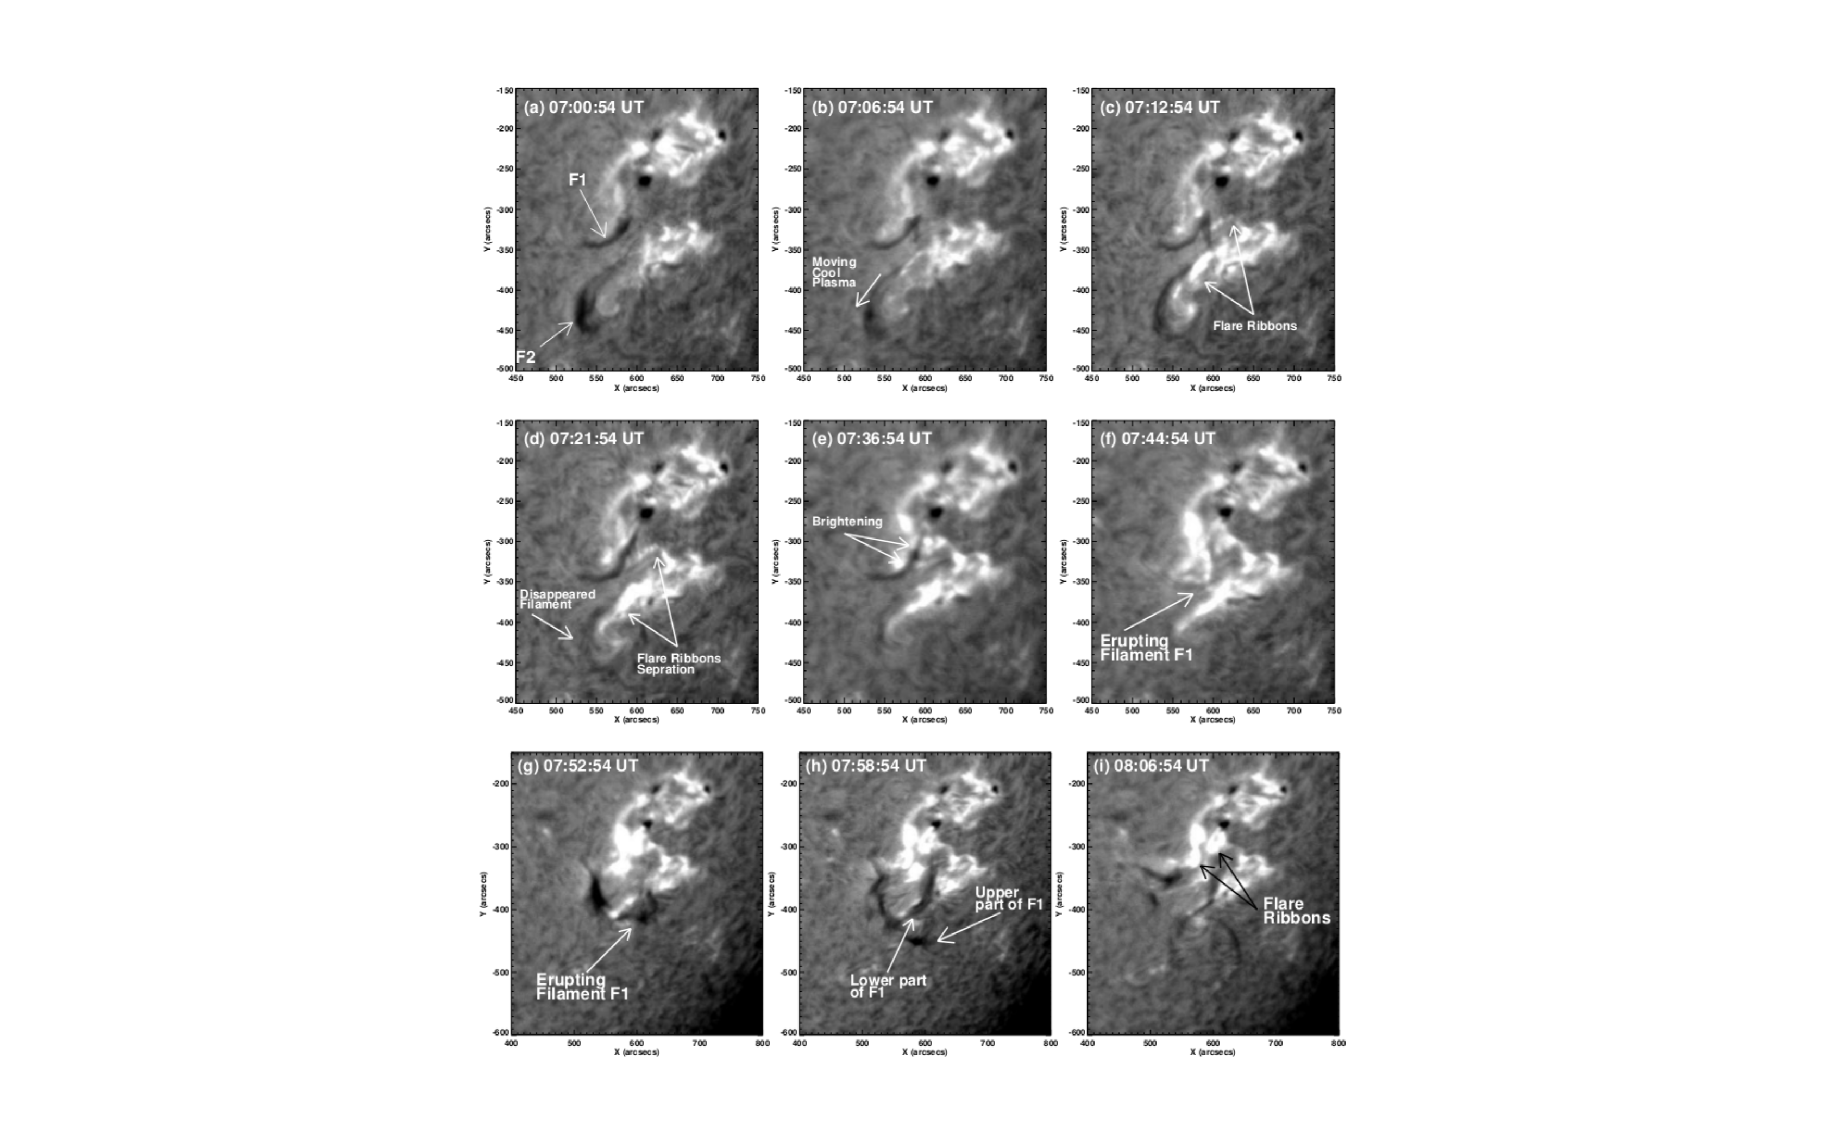
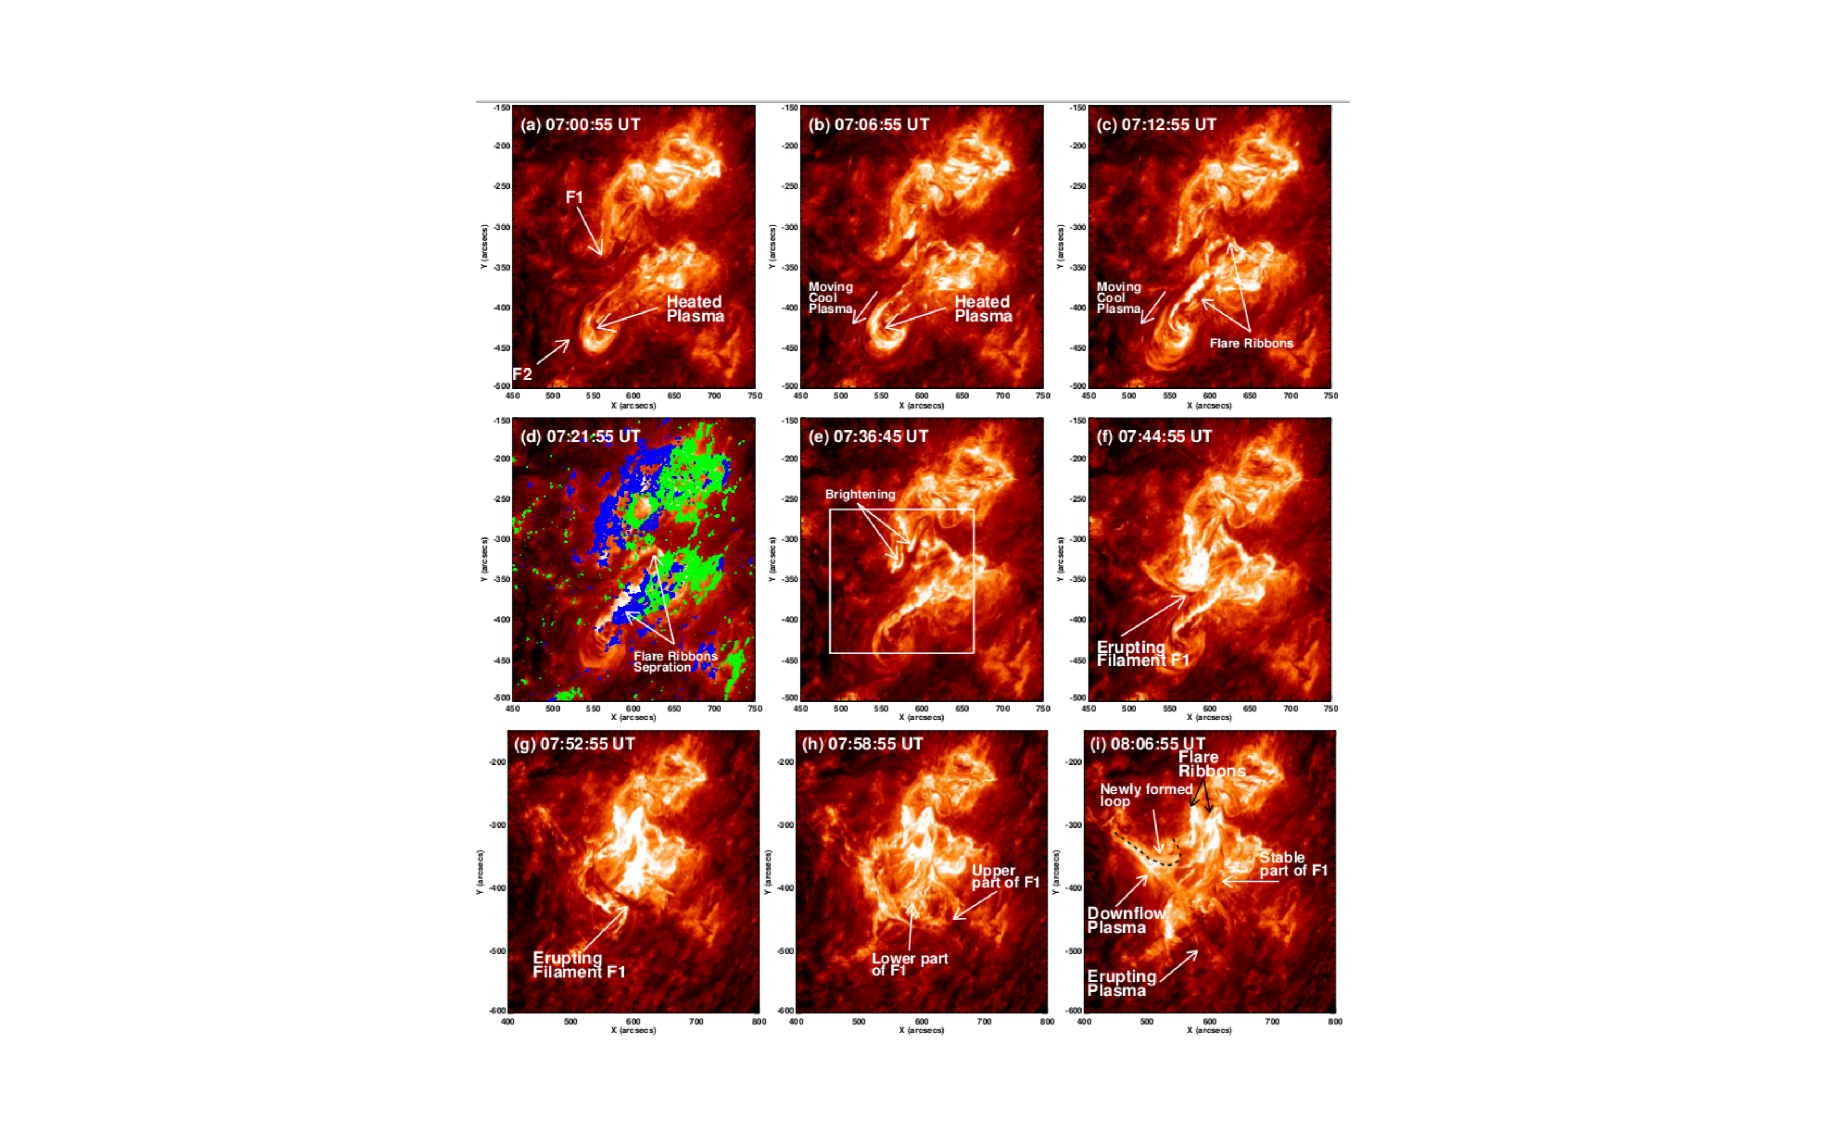
The first eruption stage was associated with the activation of filament F2 and the partial eruption of the overlying arcade. Figures 4 and 5 represent the sequence of selected H and SDO/AIA 304 Å images showing the overall chromospheric dynamics of the eruptions. Both the filaments were located near to each other and are represented by the letters “F1” and “F2” (Figures 4(a) and 5(a)). The southward confined motion of the cool plasma of filament F2 started at 06:45 UT toward its southern footpoint along the filament spine. The heating of the cool plasma (i.e., filament activation) started at 07:00 UT. The EUV brightness of the filament can be interpreted as the signature of heating (Figures 5(a) and (b)). The confined southward movement of the cool and hot plasma continued until 07:15 UT (Figures 4(a)–(c), 5(a)–(c)). The partial disappearance of filament F2 during this confined motion has been observed in H images (H animation and Figure 4(d)). This may also be due to the heating of the cool material of filament F2. The filament activation and heating are believed due to the reconnection underneath filament F2 between the legs of the overlying sheared arcades.
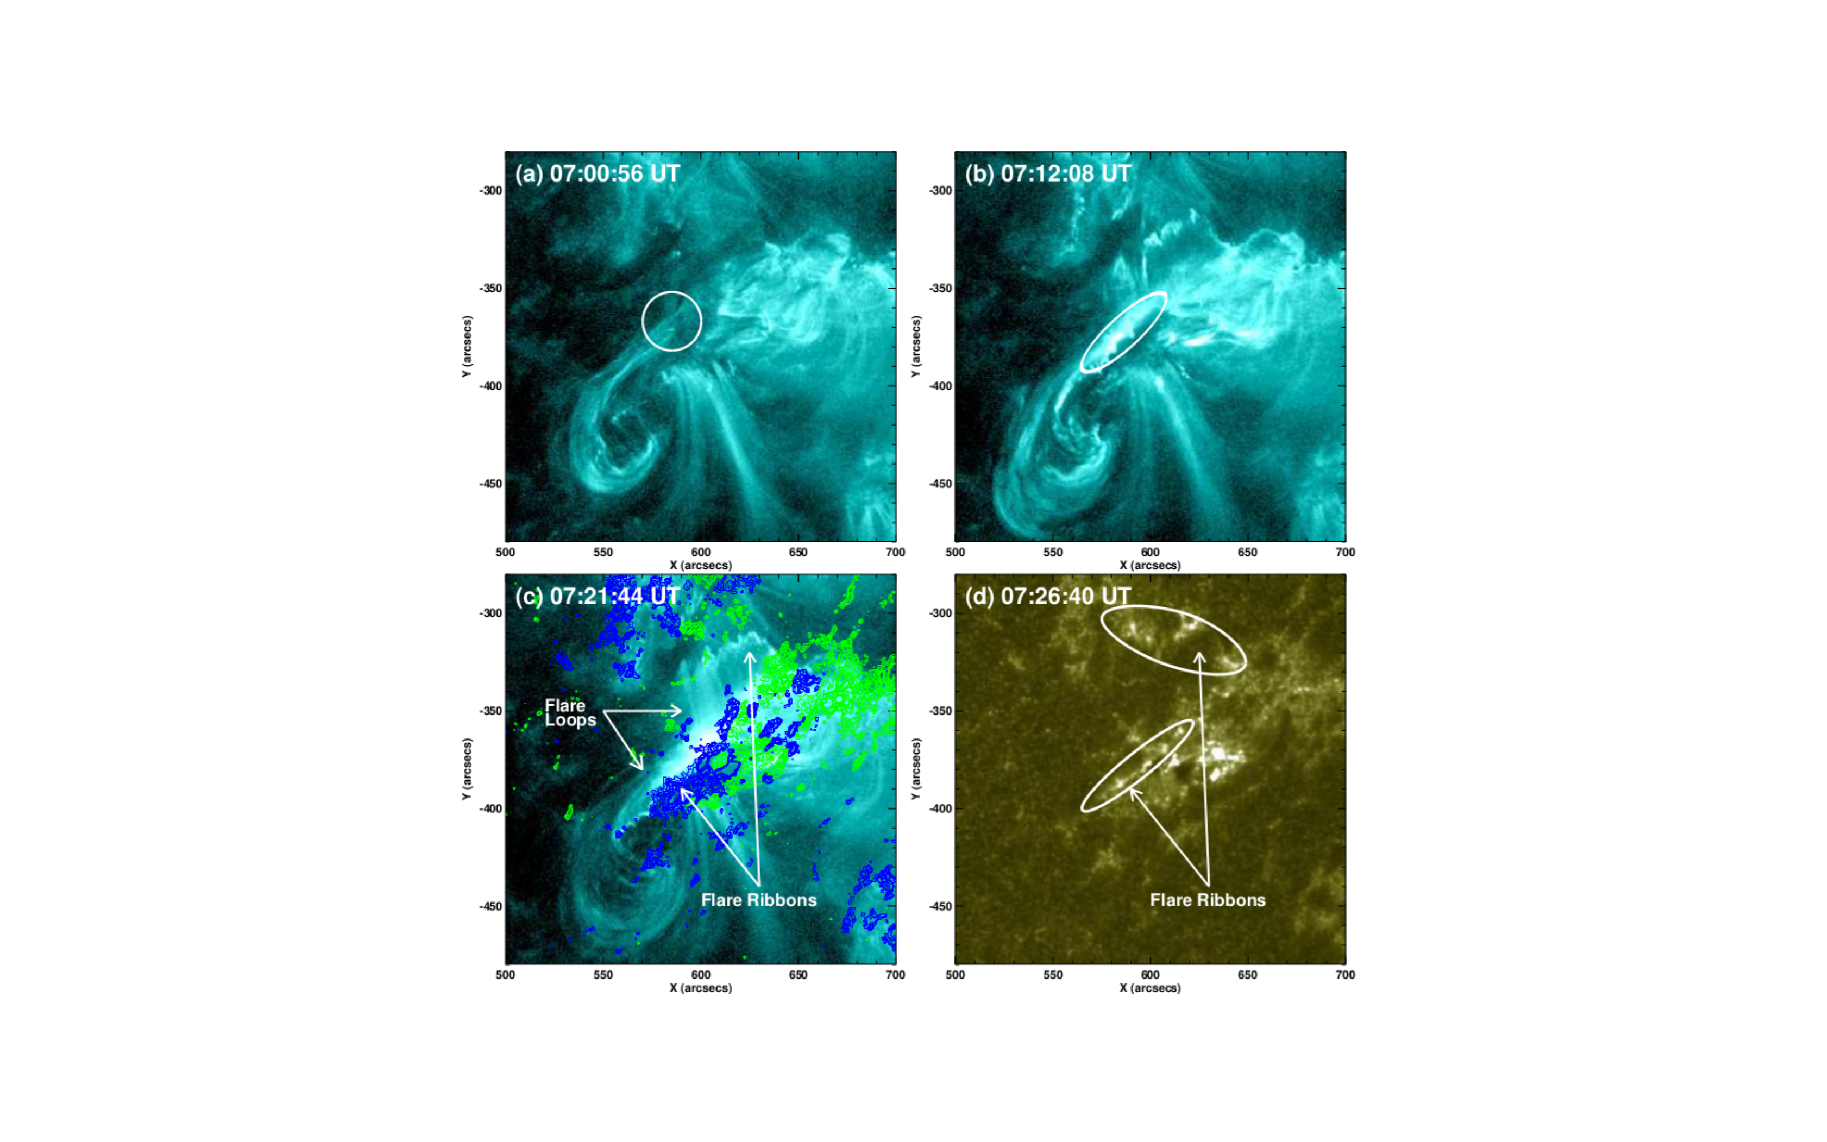
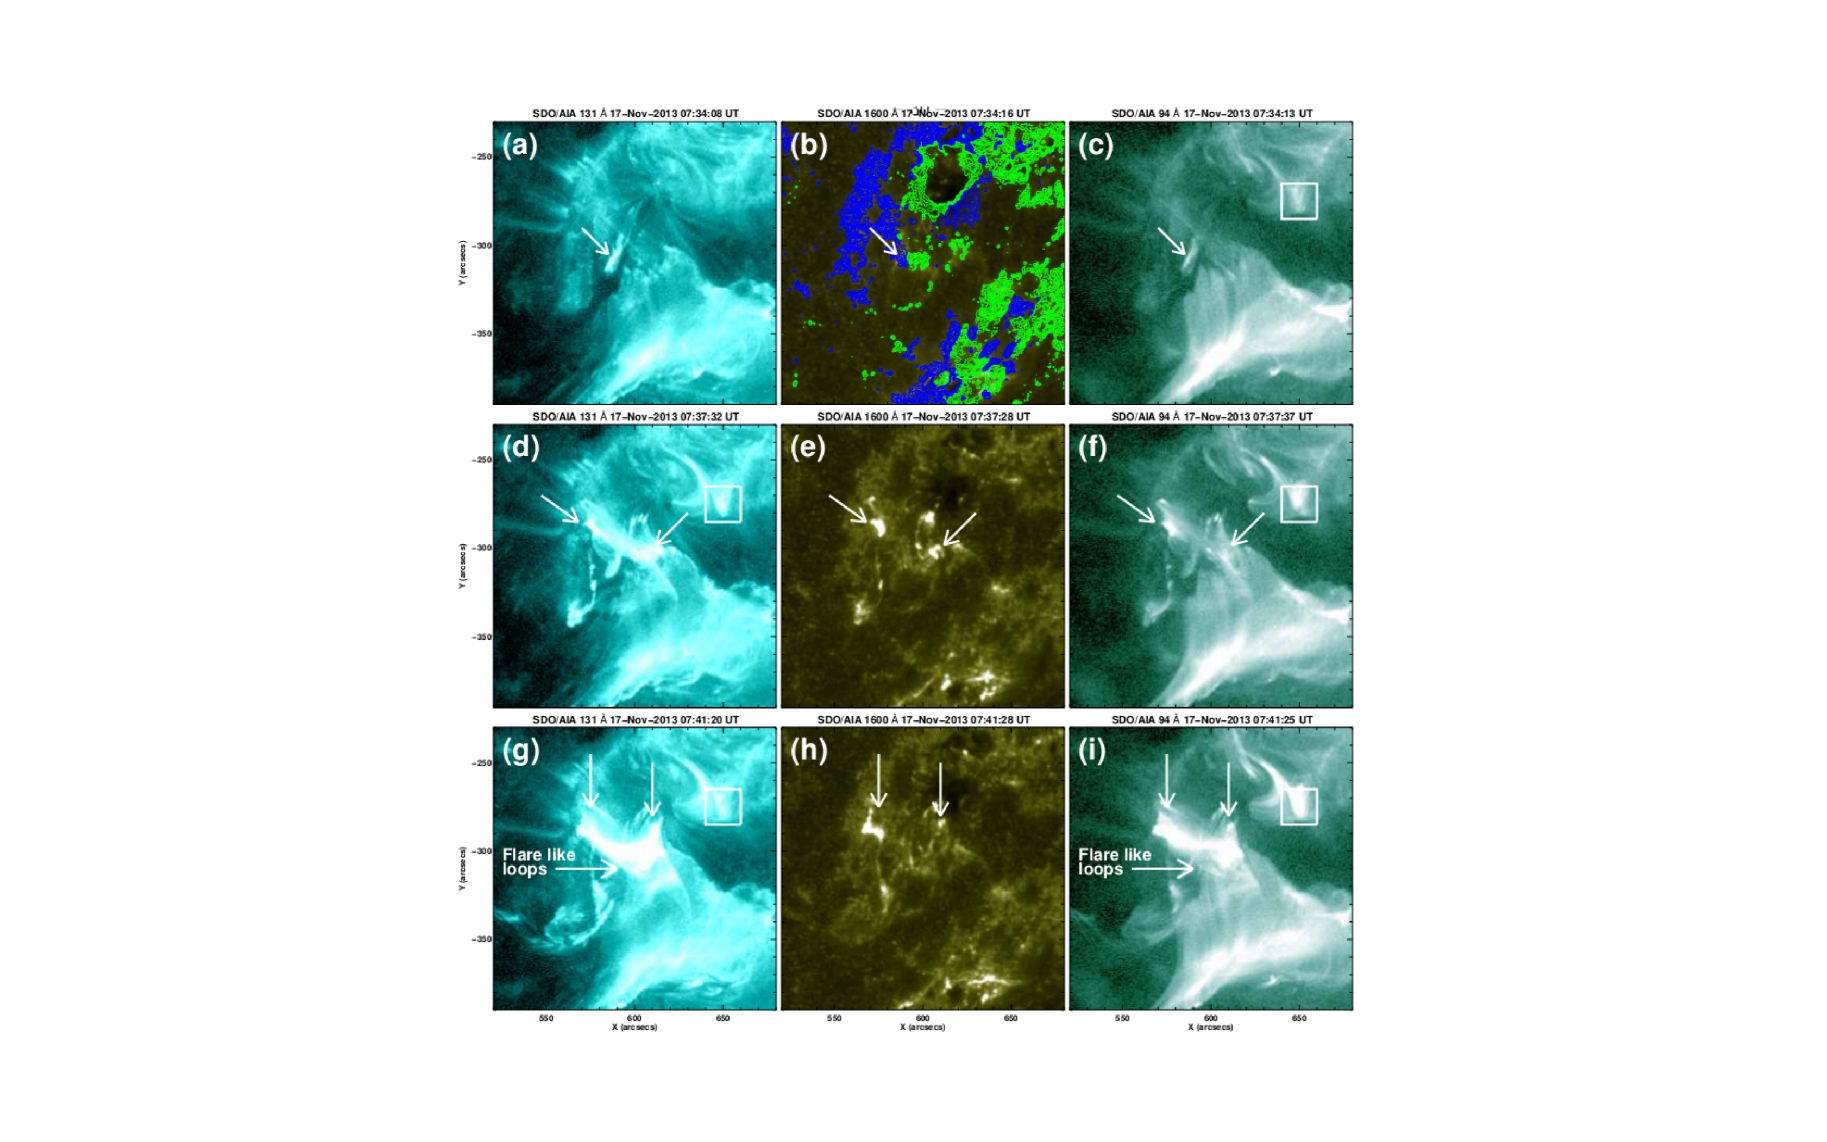
The reconnection dynamics can be clearly seen in SDO/AIA 131 Å image sequence (Figures 6(a)–(c)). The SDO/AIA 131 Å channel provides information about the flaring reconnection region in the Sun. Activated filament F2 was visible at 07:00 UT (Figure 6(a)). The approximate locations where the magnetic reconnection is supposed to occur between the legs of sheared arcades are represented by the white circle and oval in Figures 6(a) and 6(b) respectively. The reconnection continued and the formation of the flare loops has been observed at around 07:21 UT (Figure 6(c)). These hot flare loops show continuous expanding motion with the eruption (animation associated with Figure 6). After comparing the cooler and hotter AIA channels, we observed that these flare brightenings and loops only appeared in the hotter AIA channels i.e., 131 and 94 Å. The formation of the flare ribbons on both sides of the reconnection region is clearly observed in H, SDO/AIA 304 and 1600 Å images (Figures 4(c)–(d), 5(c)–(d) and 6(d) respectively). These ribbons also show apparent separation motion away from each other (see H, SDO/AIA 304 and 1600 Å animations associated with Figures 4, 5 and 6, respectively). The northern ribbon moves toward north, while the southward ribbon moves toward the southwest. The flare loops connecting the flare ribbons can be evidenced by comparing SDO/AIA 131 and 1600 Å images (Figures 6(c) and 6(d) respectively). The extension of the northern and southern ribbons of the first flare have a J shape and can be considered as the hooks of the flux rope containing the filament F2. The ribbons shown by the white ovals in Figure 6(d) are the spreading footpoints of the growing flare loops.
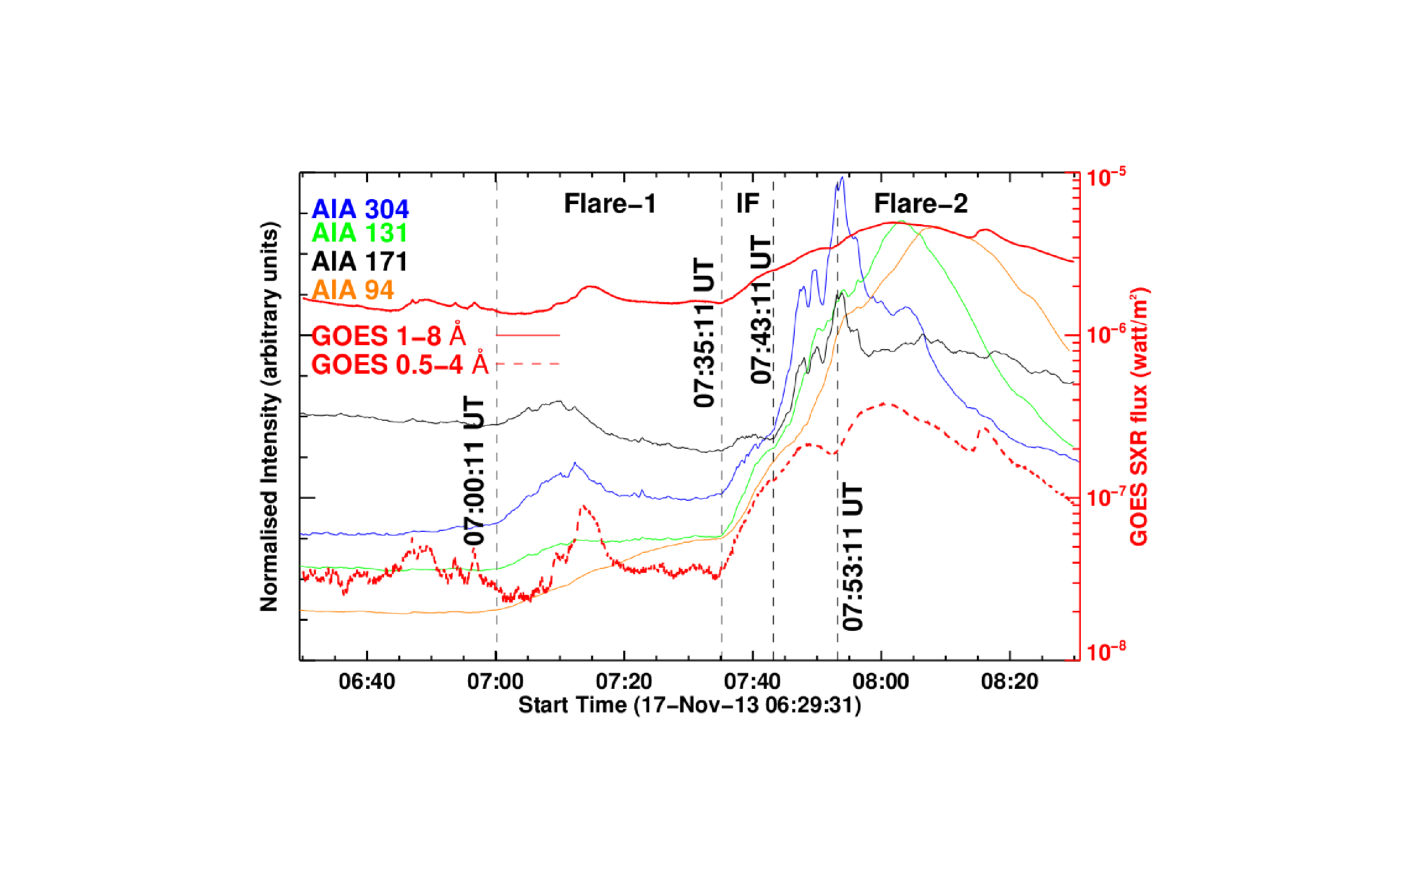
In order to understand the temporal evolution of the EUV brightening during the flare events, we have estimated the EUV intensity profiles for the flaring region during 06:00 UT to 08:30 UT. These temporal profiles of SDO/AIA 304, 131, 171 and 94 Å wavelength channels are represented in Figure 7. For the comparison we have overplotted GOES X-ray profiles in 1–8 Å and 0.5–4 Å. Each profiles are normalized by different values for the better comparison of flare evolution. The region used for the estimation of these profiles are shown in Figure 5(e) with a white box. The first flare phase can be considered from 07:00 UT to 07:35 UT. A gradual rise started at around 07:00 UT in all the EUV intensity profiles. The SDO/AIA 304 and 171 Å profiles show a continues increase up to around 07:10–07:12 UT. These profiles show a gradual decrease up to 07:35 UT. SDO/AIA 131 Å profile shows an initial gradual increase up to around 07:10 UT and then remain almost constant up to 07:35 UT. On the other hand, the 94 Å profile shows a consistent gradual increase with very slow rate up to 07:35 UT. A peak has also been observed in GOES profiles, which appear to be consistent with the SDO/AIA 304 and 171 Å profiles. The full disk observations at the same time reveal that this peak in the GOES X-ray came both from the flare in this study as well as from another flaring activity occurred in another active region 11897.
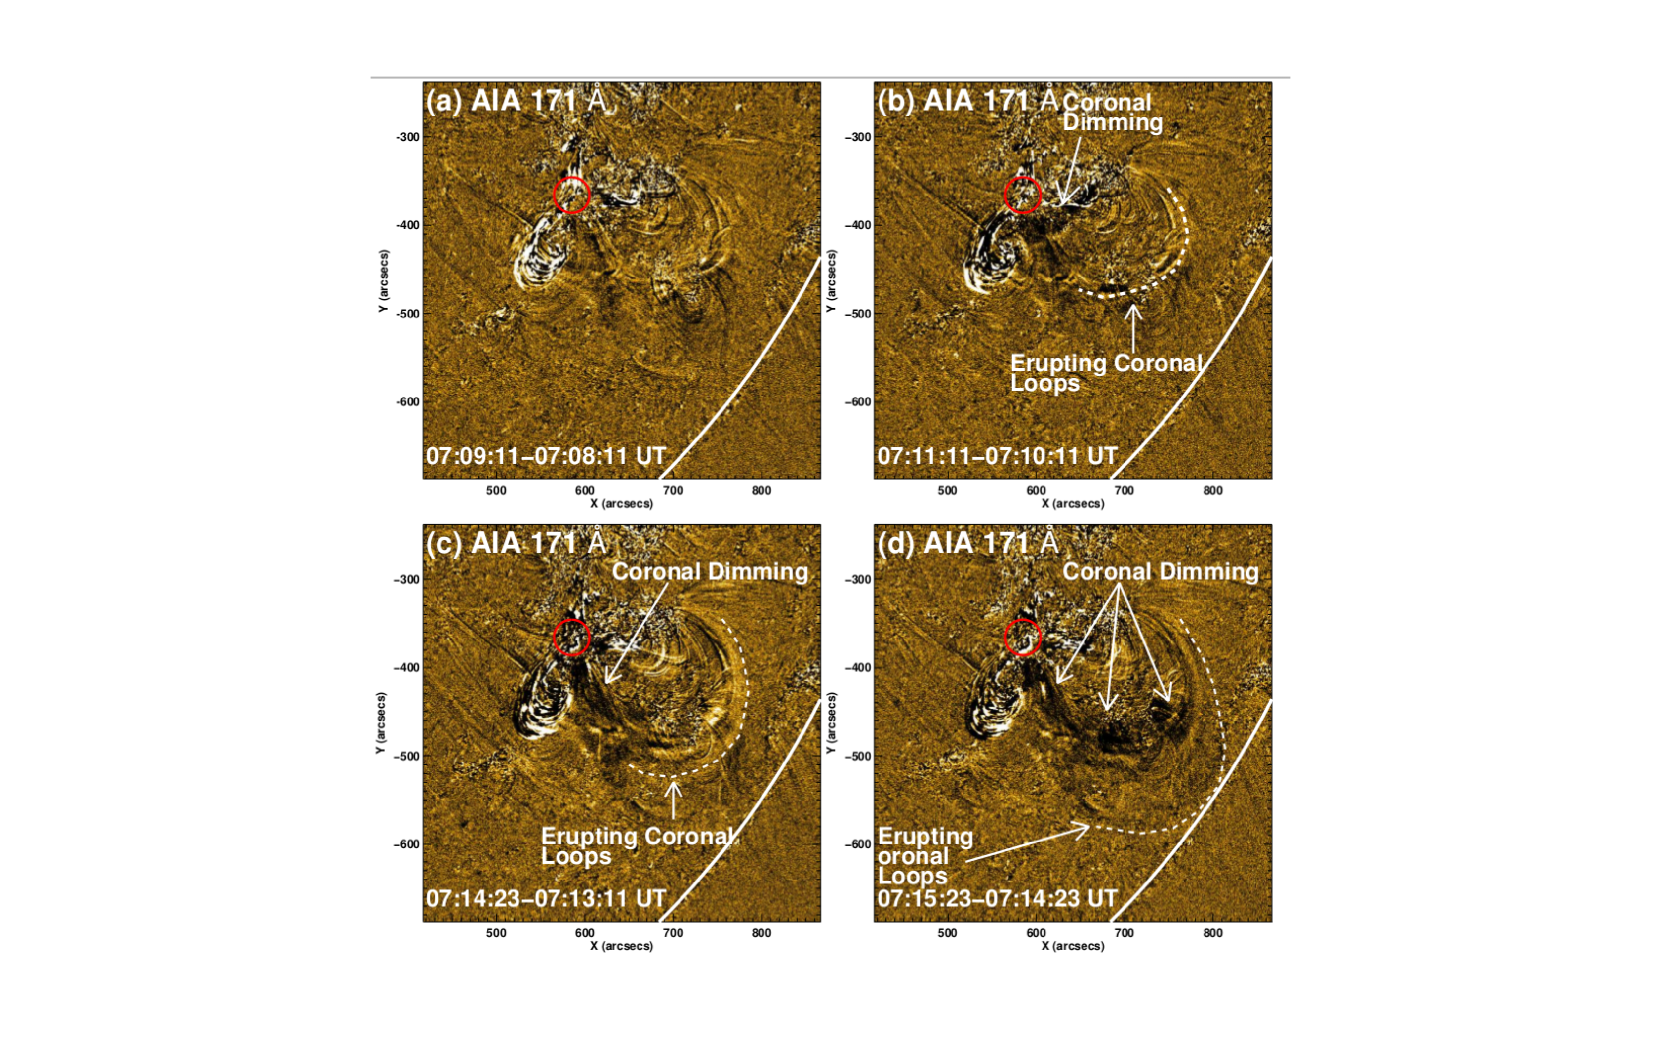
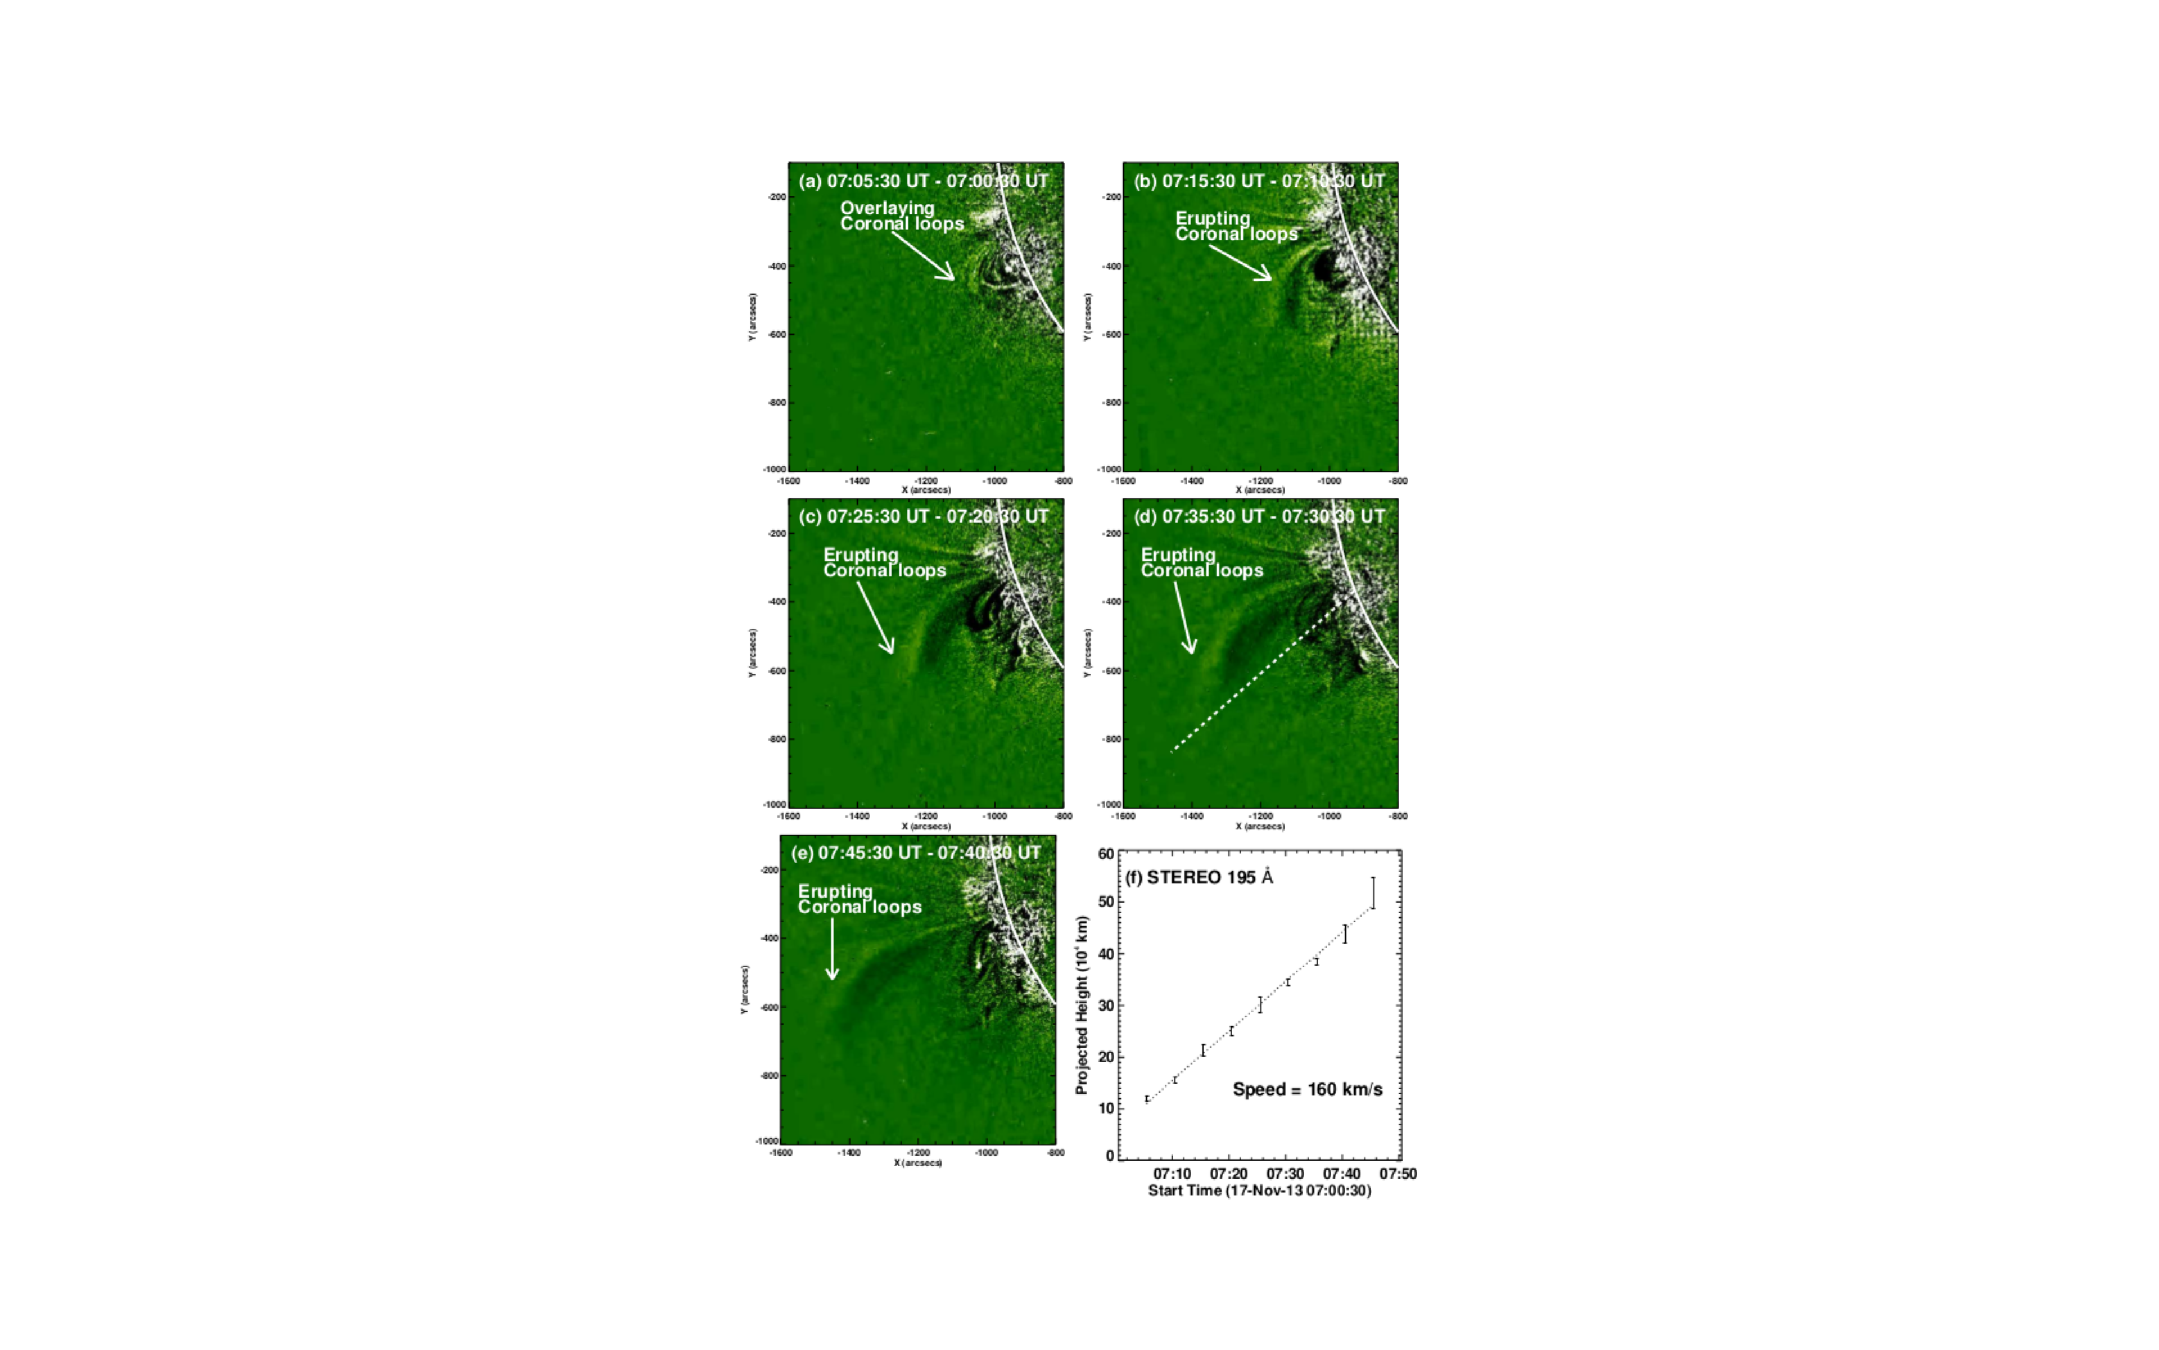
We do not see the eruption of the filament material during this phase in SDO/AIA 304 Å and NSO/GONG H observations. However, some evidence of the eruption from F2 and coronal loops can be found from SDO/AIA 171 Å and STEREO-A/EUVI 195 Å images (Figures 8 and 9). Figure 8 shows the SDO/AIA 171 Å difference images, showing the eruption of filament F2 overlying loops between 07:09 UT and 07:15 UT in the disk view (see animation attached with Figure 12). Erupting leading edge of the visible coronal loops is represented by dashed white curved lines. From the SDO/AIA 171 Å disk observations, we also observe coronal dimming signatures just above filament F2 at 07:11 UT (Figure 8(b)) as well as under the erupting loops at 07:14 UT (Figure 8(c)) and 07:15 UT (Figure 8(d)). The observed coronal dimmings show the observational evidence of eruptions from these regions. The locations of flare reconnection are also shown by the red circles in each panels. On the other hand, Figures 9(a)–(e) show the STEREO-A/EUVI 195 Å limb observations of the expansion and eruption of overlying coronal loops between 07:05:30 UT and 07:45:30 UT. The overlying loops are clearly visible in the limb view at 07:05:30 UT (Figure 9(a)). The expansion and eruption of filament F2 overlying loops started at 07:05:30 UT and continued until 07:45:30 UT (animation associated with Figure 9). The approximate leading edge of the erupting overlying loops is shown by the white arrow in each panel. The eruption of overlying coronal loops are very clear from the STEREO-A/EUVI 195 Å movie. Figure 9(f) shows the height–time profile of the erupting coronal loops using STEREO-A/EUVI 195 Å images. A rough trajectory along which the height–time measurements are performed is shown in Figure 9(d) with dashed white line. The error bars are the standard deviations estimated using three repeated measurements of the same point. The speed is estimated by the linear fit to these height-time data points. The estimated speed is around 160 . We suggest that after the reconnection between the legs of the sheared arcades, some of the overlying arcades erupted. These arcade eruption results the expansion and eruption of the overlying coronal loops.
3.4 Interaction between the Magnetic Field of the Two Filaments: Second Stage Reconnection
Simultaneously with the first eruption, the ribbon separation of the first flare continued up to 07:32 UT, which has been discussed in detail in Section 3.3. Looking at the 304, 94 and 131 movies, we can see the expansion of the northern ribbon of first flare, footprint of the hook of the F2 flux rope end. According to the motion and expansion of the hook of the F2 flux rope, it seems that the first reconnection is continuous even after the first flare and sucks the field lines between the two flux ropes, forcing some field lines to change of connectivity and reconnect far away. During the second stage interaction we observed several brightenings. At 07:32 UT, we observe the start of a first brightening under the filament F1 in H and AIA EUV channels (Figures 4(e), 5(e), 10(a) and (c)). This brightening corresponds to the slight bump in AIA 304, 131 and 171 Å as well as the GOES X-ray profiles during the intermediate time between the two flares (Figure 7). This phase is represented by “IF” in Figure 7. This compact brightening is located at the region where the positive and negative polarities lie near to each other (i.e., corresponds to the box 1 in Figure 3). It looks like the flux rope containing F1 is heated below and above F1, probably by a second reconnection. At 07:36 we see a second brightening in the south of the first one with a J shape in 304, 131 and 94 Å channels (Figures 4(e), 5(e), 10(d) and (f)). This could correspond to the flux rope hook of F1 and the elongated brightening could be considered as heated plasma along the flux rope. Thereafter the flux rope containing F1 is destabilized and heated.
During the same time we note a brightening in the box (Figure 10(c)) corresponding to the anchorage of the arcades overlying F1 and F2. The timing of the two brightenings suggest some heating all along the flux rope until its end in the place of the box. We also see some new brightenings above F1 like loops in 131 Å at 07:37 and 07:41 UT (Figure 10(d), (f), (g) and (i)). During the same time, the F1 flux rope (J ribbon) is heated in 304 Å and starts to inflate from 07:41 UT. All these observational evidences suggest the second reconnection.
3.5 Eruption of Filament F1 and Associated Flare: Third Stage Reconnection
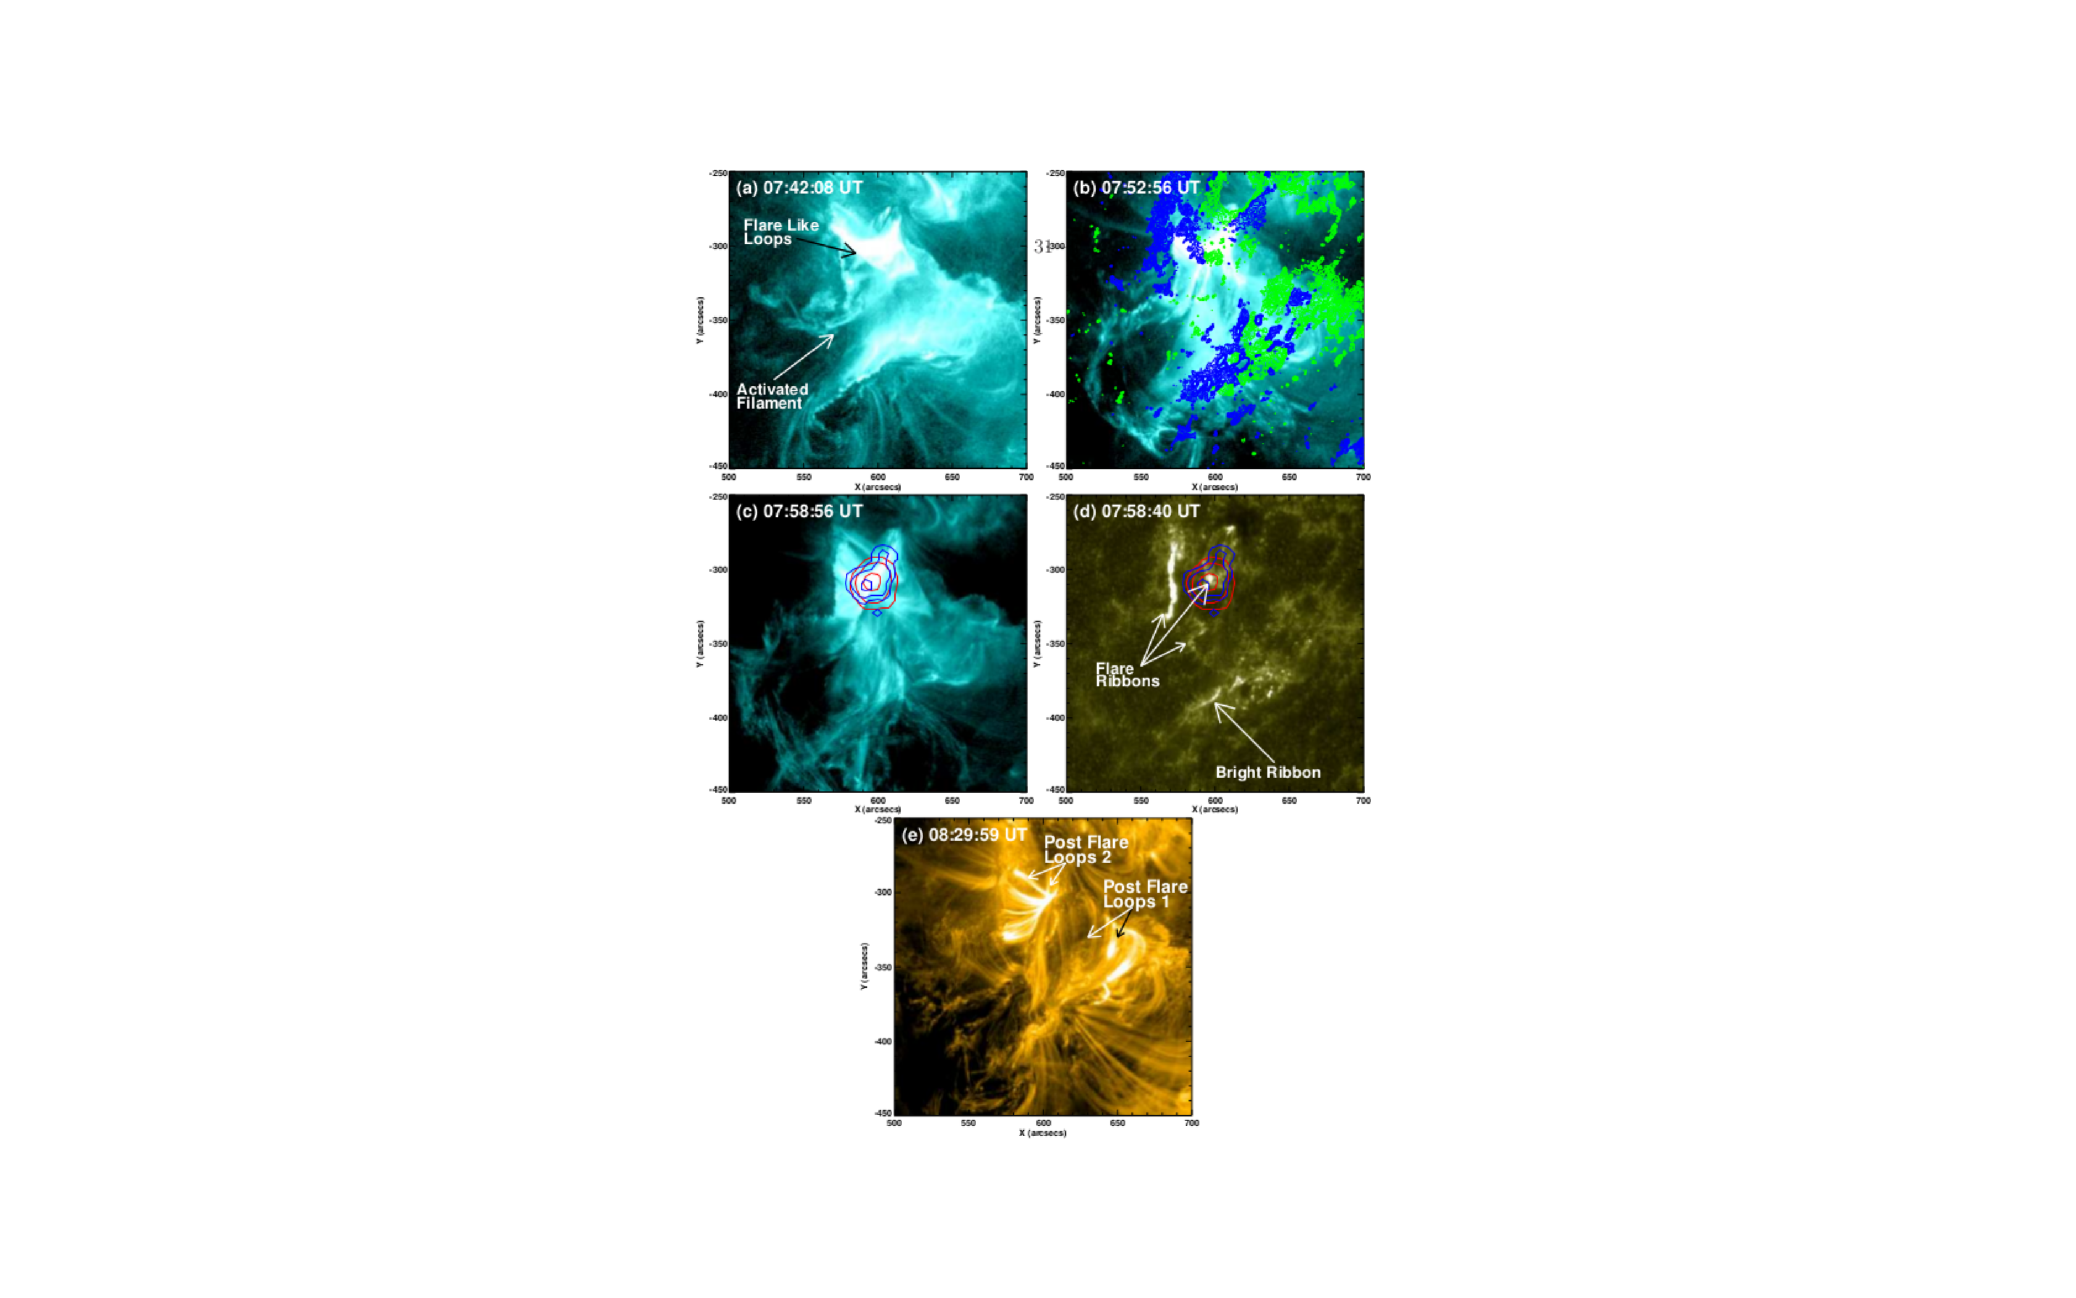
The activation of the northern filament F1 started at around 07:39 UT, a few minutes after the underneath heating. Thereafter, filament F1 started to rise between 07:42–07:43 UT (Figure 11(a)). The eruption of filament F1 was associated with a small C4.9 class solar flare. The low lying reconnection between the legs of the overlying arcade field lines in the wake of filament F1 eruption may trigger this flare. This is the third stage of the magnetic reconnection. Thereafter, the filament F1 continued to erupt in the same direction as that of the first eruption (Figures 4(f)–(g), 5(f)–(g) and 11(b)). We find the RHESSI X-ray sources of 6–12 (red) and 12–25 (blue) keV over the flare brightening region at around 07:58 UT (Figure 11(c)), which signifies the existence of the magnetic reconnection.
A careful inspection of the EUV intensity and GOES X-ray profiles show that the third stage of the enhancement started at around 07:43 UT in all the EUV channels (Figure 7). The GOES X-ray flux enhancement also shows the third stage of the enhancement (red curves in Figure 7). SDO/AIA 304 and 171 Å profiles show early peaks at around 07:54 UT, while the SDO/AIA 94 and 131 Å and GOES X-ray profiles show the peaks of the flare between 08:00 UT and 08:05 UT. This third enhancement in the EUV profiles is due to the reconnection in the wake of the erupting filament F1 between the surrounding arcades. Moreover, the intensity profiles of SDO/AIA 94 and 131 Å and GOES X–ray channels also show another enhancement started at around 07:53:11 UT before reaching the peak. This provides evidence for another small reconnection stage during its eruption phase. NOAA record shows that the flare started at 07:37 UT, peaked at 08:01 UT and ended at 08:24 UT.
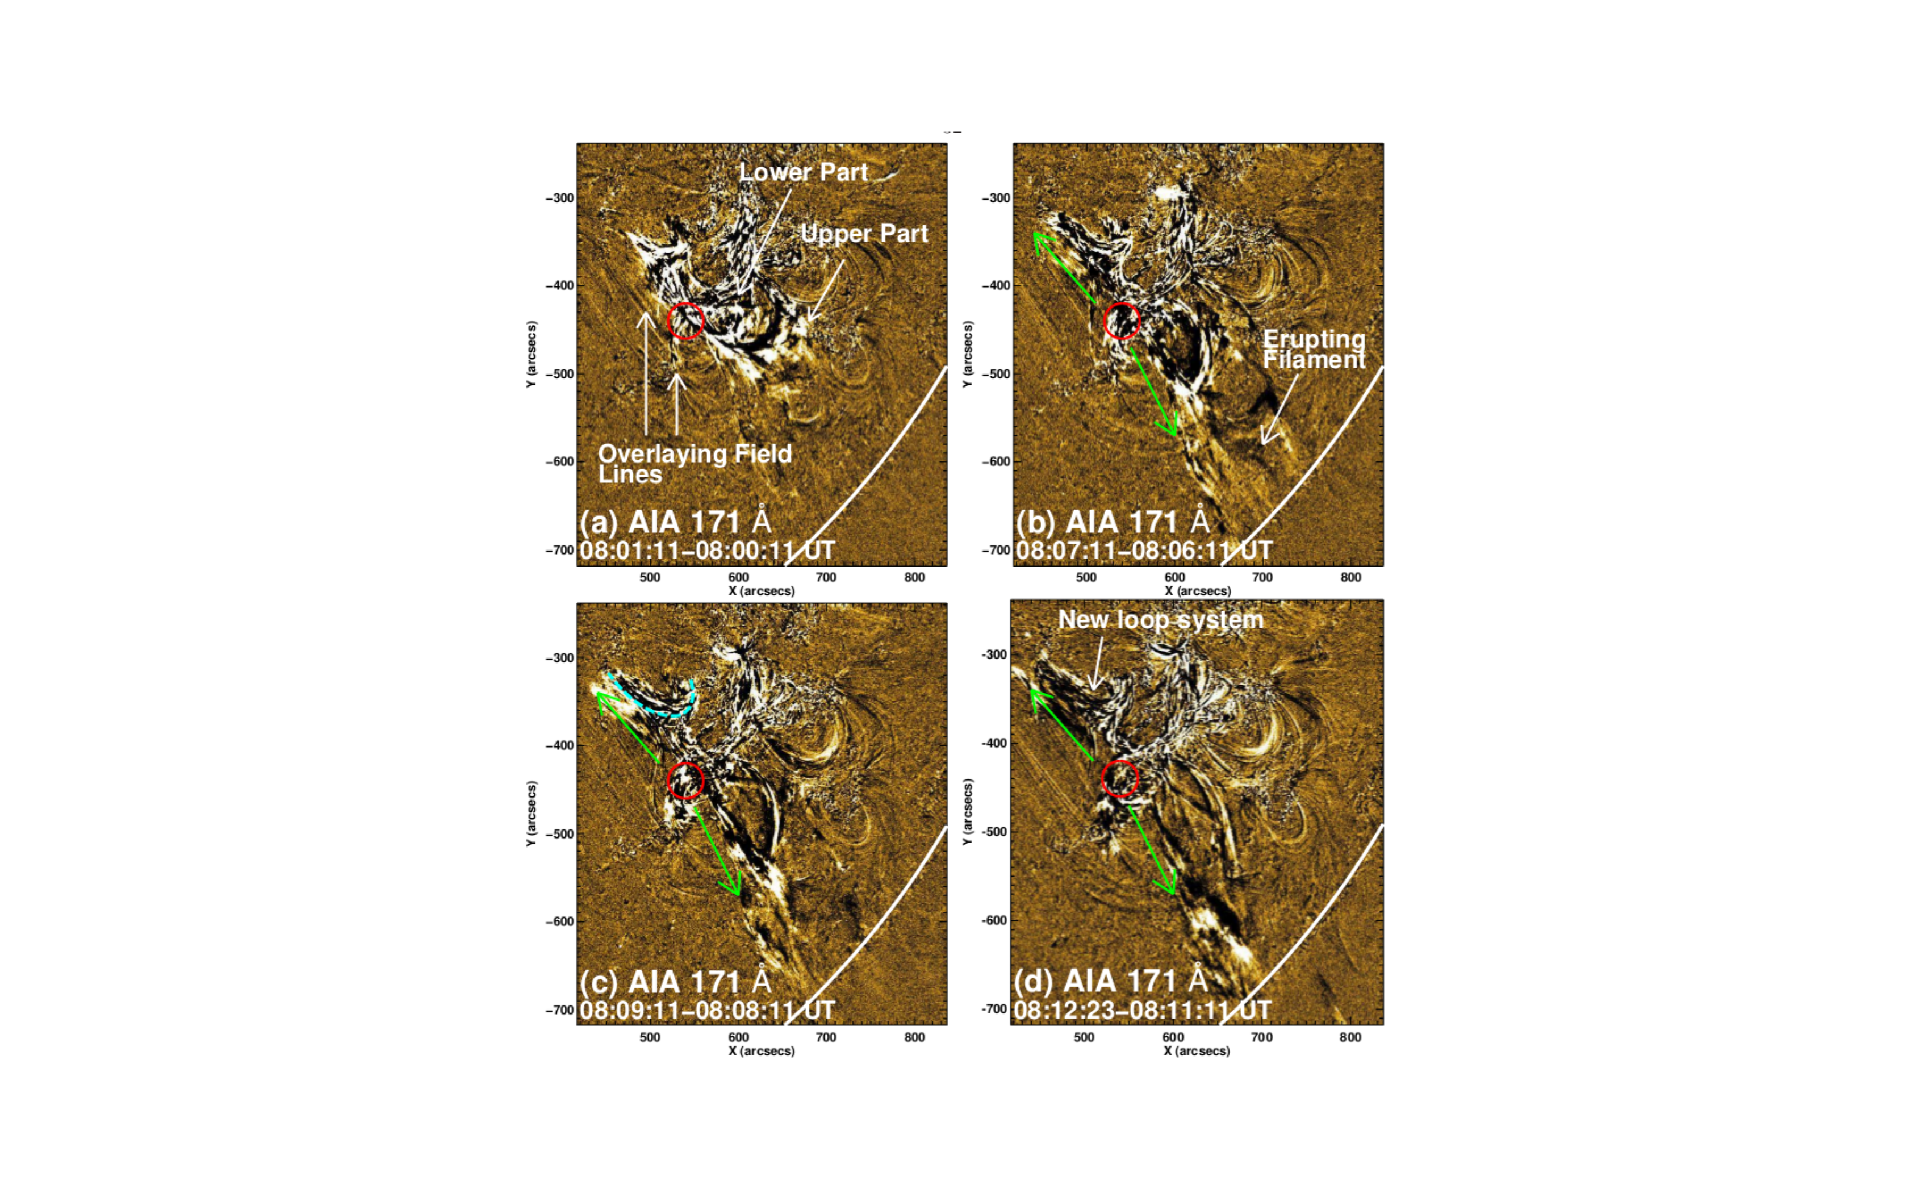
At about 07:58 UT, we observe that the erupting filament F1 broke into two parts, namely, the lower and the upper parts. These upper and lower parts are represented in Figures 4(h), 5(h) and 12(a). Thereafter, we observe the eruption of the upper part only, while the lower part remains stable against eruption (animations associated with Figures 4 and 5). Along with the eruption of the upper part, we observe the formation of two ribbons simultaneously (Figure 11(d)). In the late decay phase at 08:30 UT, two set of post flare loops have also been observed in SDO/AIA 171 Å channel (Figure 11(e)). Right set of post flare loops (i.e., loops 1) are associated with the first flare, while the left set of post flare loops (i.e., loops 2) are associated with the second flare. The overall dynamics of both eruptions can be clearly seen in the H and SDO/AIA movies (see attached full length movies with Figures 4 and 5).
3.6 Reconnection between the Erupting Filament F1 and the Ambient Field: Fourth Stage Reconnection
The erupting arcades of filament F1 underwent reconnection with the ambient field during 07:58 UT to 08:12 UT (Figure 12). This can be interpreted as the fourth stage of the magnetic reconnection. Figure 12 represents the SDO/AIA 171 Å running difference images during 08:01 to 08:12 UT. The eruptive upper and stable lower parts and the surrounding ambient field can be seen at 08:01 UT (Figure 12(a)). The erupting upper part of filament F1 is reconnected with the nearby overlying ambient field lines (Figures 12(b)–(d)). The approximate locations of the reconnection regions are marked by the red circles in each panel. As a result, the filament plasma appears to show downward and upward flow motions (animations associated with Figure 12). The green arrows in Figures 12(b)–(d) represent the directions of the upward and downward filament plasma motion. We also observe the formation of a new loop system joining the negative footpoint of filament F1 and the nearby positive polarity (Figures 4(i), 5(i) and 12(b)–(d)).
3.7 Kinematics of Filament F1 and Associated CMEs
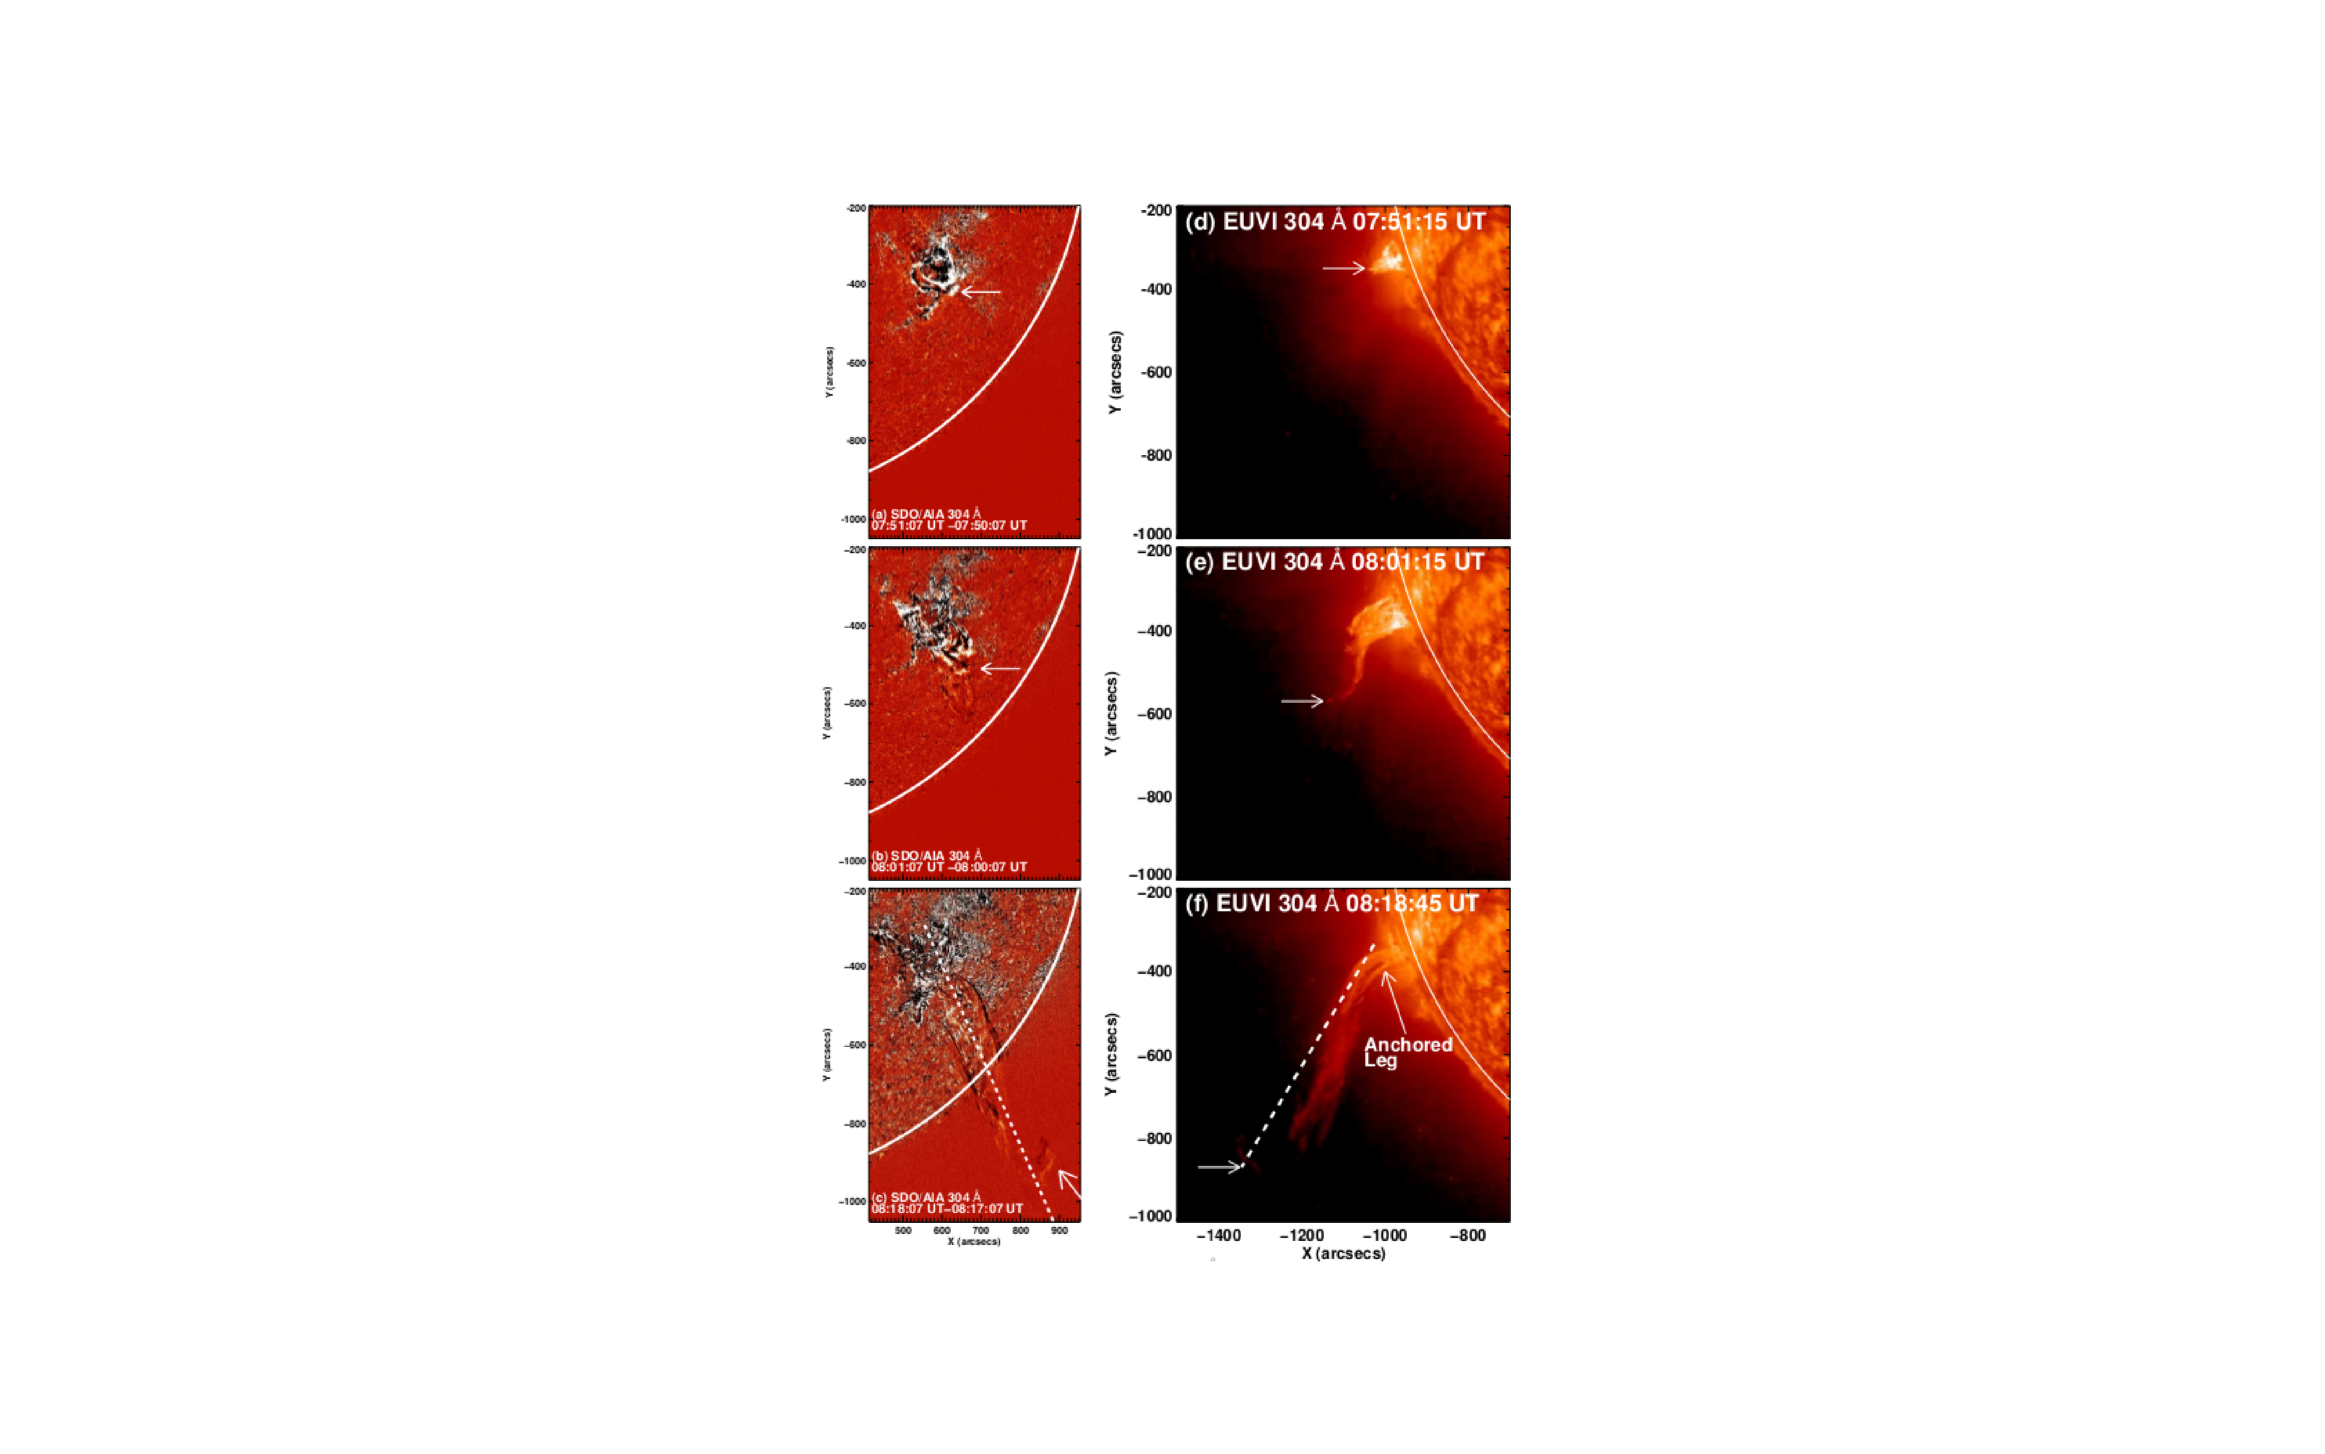
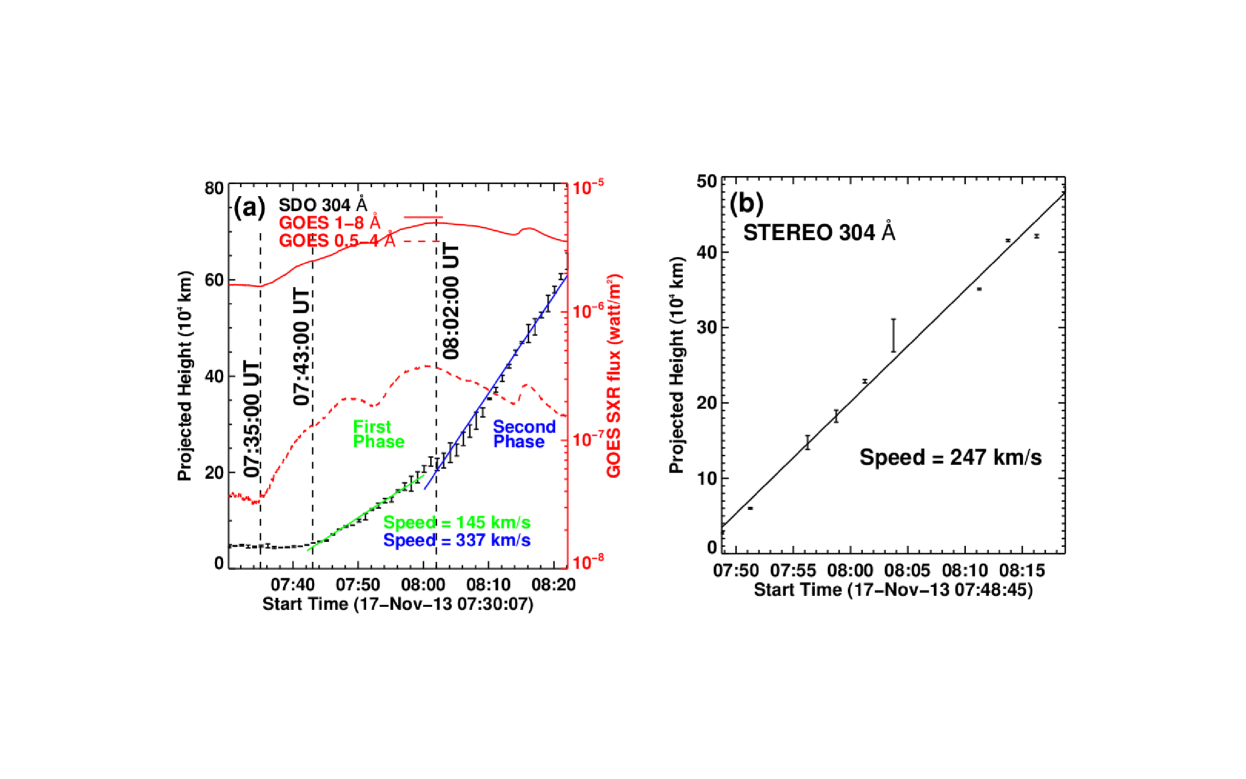
Left and right panels of Figure 13 show the eruption of filament F1 using on disk observations by SDO/AIA 304 Å and the limb observations by STEREO-A/EUVI 304 Å respectively. The arrows in all the respective panels mark the similar leading edge of the erupting part of filament F1. Both the panels show similar morphological evolution of the filament F1 eruption. Figures 14(a) and 14(b) show the height–time profiles of the erupting part of filament F1 for on disk SDO/AIA 304 Å as well as STEREO-A/EUVI 304 Å limb observations during 07:30 UT to 08:22 UT. The error bars in these plots are the standard deviations estimated by three repeated measurements of the same point. The rough trajectories along which the height–time measurements have been performed are represented in the Figures 13(c) and 13(f) with dashed white lines. In the height–time profile of SDO/AIA 304 Å, we can identify two stages of the eruption of filament F1, namely, the first slow phase and the second fast phase. It is observed that initially filament F1 erupted with a slow speed during 07:41 UT to 08:02 UT (Figures 13(a), 13(b) and 14(a)). The estimated speed during this phase is around 145 . It went into the fast phase eruption after 08:02 UT. The estimated higher speed is around 337 during 08:02 UT to 08:22 UT (Figures 14(a)). The speed increase is due to the reconnection between the erupting filament F1 with the ambient magnetic field. The reconnection between the erupting filament F1 with the ambient field started at around 08:02 UT and continued up to around 08:15 UT, which is consistent with the fast rising phase of filament F1. Figure 14(b) shows the height-time relationship using the STEREO-A/EUVI 304 Å observations during 07:40 to 08:18 UT. The estimated speed is 247 . Because of the low cadence, we can not see the two different phases in this panel. The speeds are calculated using the linear fit to the height-time data points during selected time intervals. The eruption of filament F1 seems to be asymmetric with the full eruptive northern and anchored southern legs (Figure 13(f)).
Both the first and the second eruptions produced CMEs. The first of these eruptions originated from the vicinity of the filament we call F2, and produced the CME that we call CME1. During this first eruption, we observed disruption of filament F2 along with expulsion of loops above F2, but it is not clear whether F2 itself was ejected or if instead it just faded. Figures 8 and 12 show the erupting loops. The spreading ribbons in Figure 6(d) are the footpoints of the arcade formed as the legs of these erupting loops reconnect, while the loops themselves continue to move outward to form part of CME1. The second eruption started with eruption of the filament we call F1, and produced the CME we call CME2. In this case, F1 clearly did erupt outward (e.g., Figures 5(f) and 5(g)). The flare ribbons shown in Figure 11(d) are the footpoints of the arcade formed by this second eruption. Figure 11(e) points out the post flare loops from both the first (post flare loops 1) and the second eruption (post flare loops 2).
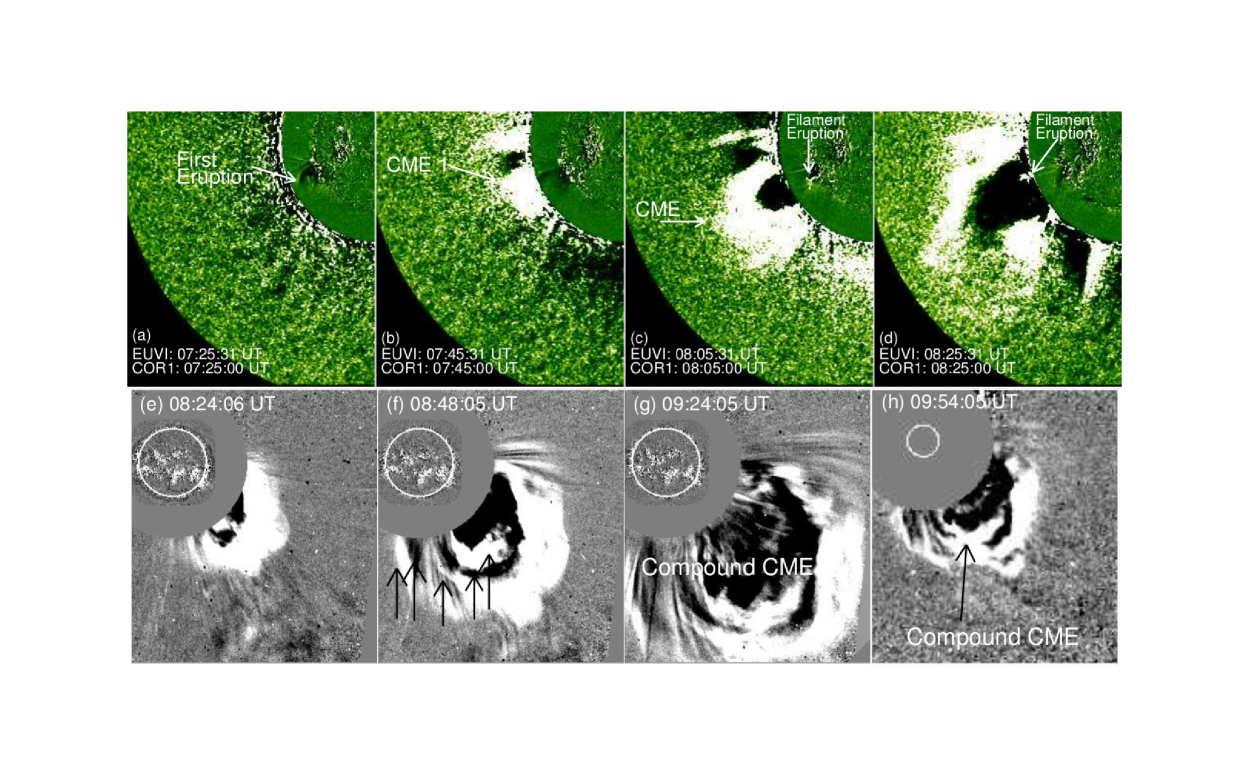
Figure 15 represents the sequence of white-light chronograph images of the CMEs. Figures 15(a)–(d) show the STEREO-A/COR1 images from 07:25 UT to 08:25 UT, overplotted with the STEREO-A/EUVI images. Figures 15(e)–(h) represent the SOHO/LASCO C2 and C3 images during 08:24 UT to 09:54 UT, overplotted with the SDO/AIA images. All the panels show the complete sequence of the evolution of the CMEs. At 07:25 UT, we observe the dimming and the eruption of the overlying field in STEREO-A/EUVI image (Figure 15(a)). The eruption was observed in COR1 field of view at 07:45 in the form of CME1 (Figure 15(b)). No core structure was associated with CME1. The erupting filament F1 was observed at 08:05 UT in the EUVI field of view while the leading edge of CME1 moved more outward in COR1 field of view (Figure 15(c)). The erupting filament was seen for the first time in STEREO-A/EUVI (Figure 15(d)) as well as LASCO C2 (Figure 15(e)) field of view at around 08:24–08:25 UT. The second CME was associated with a core structure, i.e., the erupting part of filament F1. At 08:48 UT we also observe multiple white and dark bands that show the signature of different leading edges and cavities (marked by black arrows in Figure 15(f)). The similar pattern progressed simultaneously (Figures 15(g) and 15(h)), which suggests that both the CMEs produced by different eruptions merged and formed a compound CME structure at the later stages.
3.8 Magnetic Field Modeling
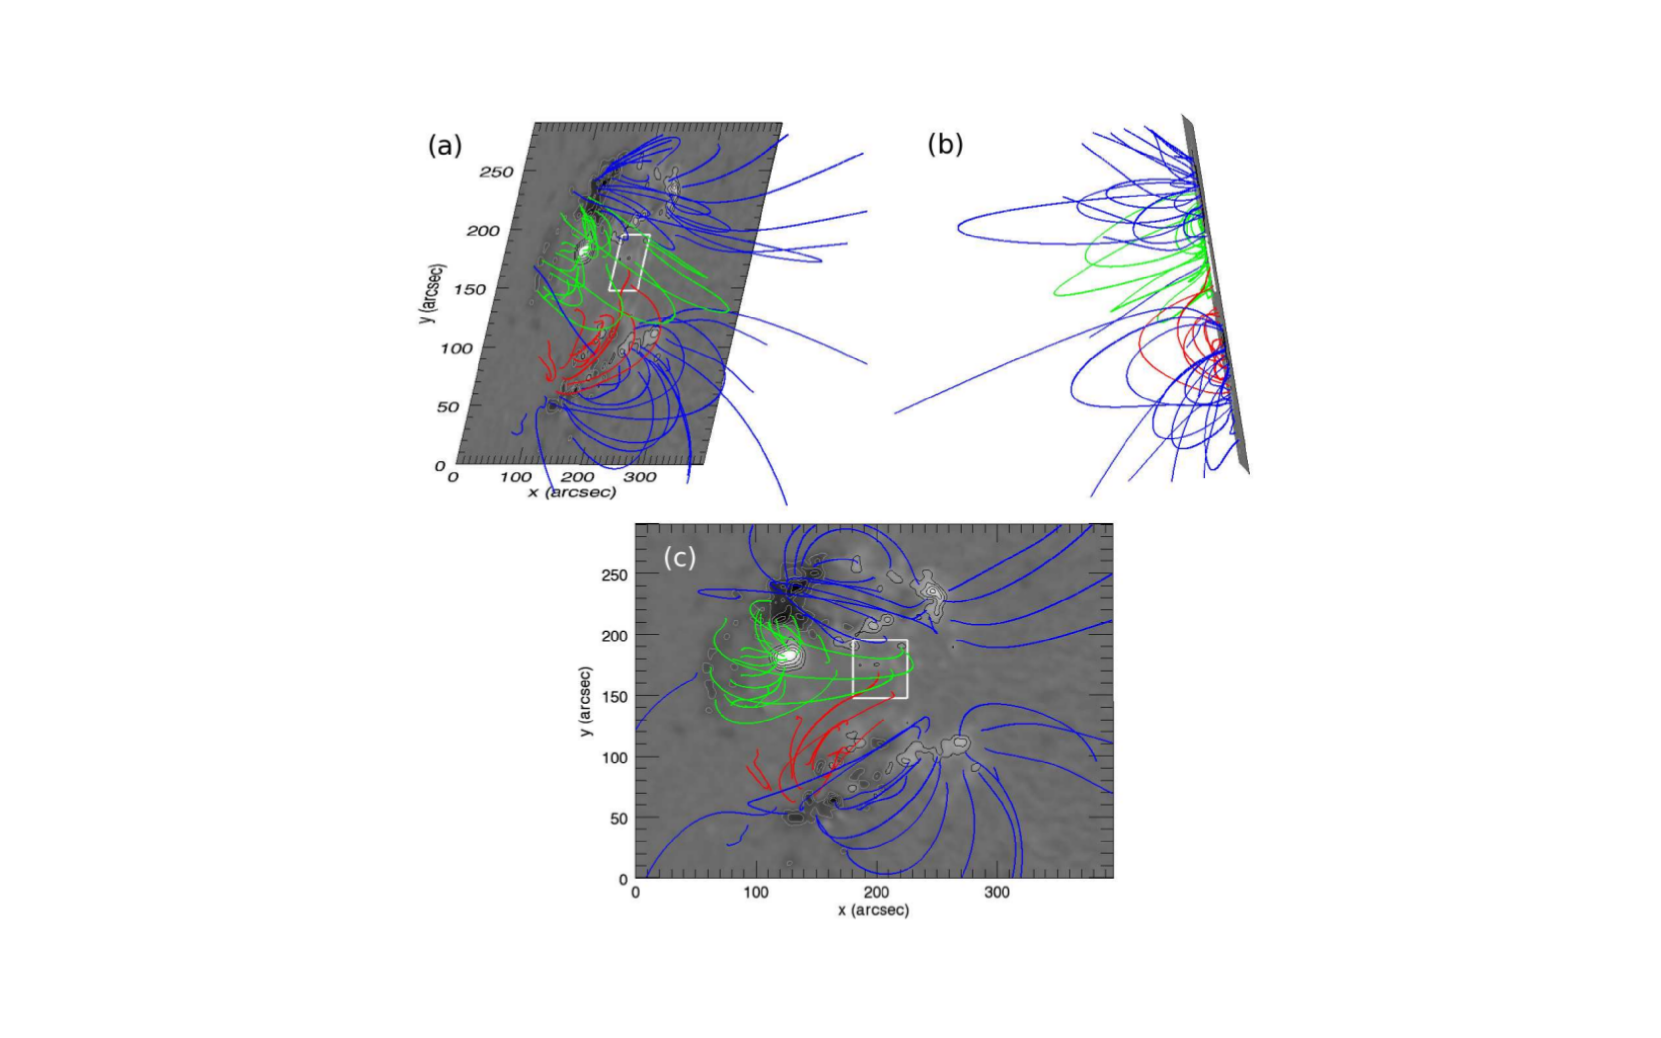
In order to understand the overlying magnetic field configuration, we have carried out an NLFFF extrapolation using the optimization method (Wiegelmann, 2004; Wiegelmann et al., 2006) over the active regions and presented in Figure 16. Panels (a) and (b) show the approximate AIA on–disk and STEREO-A/EUVI limb views respectively, while the bottom panel (c) represents the top view of the active regions with extrapolated field lines. Green and red lines represent the low lying magnetic field lines over the northern and southern interacting magnetic systems respectively. Blue lines represent the open field lines and the field lines not concerned by the present events. By comparing Figures 16(c) and 2(d), we note that the magnetic field lines in red are the overlying arcades of the filament F2, the magnetic field lines in green are the overlying arcade field of F1. Some connections between the overlying fields of F1 and F2 have also been observed. The white box shows the region of positive polarity between the active regions. As shown in the top view of the extrapolation result, some magnetic field lines overlying filament F2 extend to the region where some other magnetic field lines overlying F1 anchored. This signifies that magnetic interaction can occur between the two filaments. This connection is very important to explain the second stage of reconnection between the two filament magnetic systems. The second stage reconnection is supposed to occur between the expanding filament system (namely, the magnetic flux rope and surrounding field lines) of F2 and the overlying magnetic arcades of filament F1.
4 Results and Discussions
The present work deals with the observational analyses and interpretations of sympathetic eruptions, associated flares and CMEs using multiwavelength data from SDO/AIA, GOES, NSO/GONG, STEREO-A/EUVI, STEREO-A/COR1, RHESSI and SOHO/LASCO occurring in two active regions on 2013 November 17. We discuss various interactions and reconnections between filament magnetic field systems and between the filament magnetic field and the surrounding ambient magnetic field during the eruptions. The main results of the study are as follows:
-
1.
Observations clearly show that the two successive eruptions and associated flares can be interpreted as the sympathetic events.
-
2.
The magnetic reconnection can be divided into four stages during these sympathetic events. The first stage reconnection occurred as a flux cancellation between the legs of sheared arcades of filament F2. This might trigger a two ribbon solar flare, the eruption of the overlying coronal arcades and coronal loops.
-
3.
The second stage reconnection could be between the field lines of the expanding flux rope F2 and the flux rope F1 as well as with its arcades. It activates F1 with heating signatures all along the flux rope and destabilizes it.
-
4.
The third stage reconnection occurred at the wake of the erupting filament F1 between the legs of overlaying arcades. This may trigger another two ribbon solar flare.
-
5.
The fourth stage of reconnection occurred between the erupting arcades of the filament F1 with the nearby surrounding ambient field. We believe that the acceleration phase and the asymmetric eruption of filament F1 are the consequences of this coronal reconnection.
The present observed eruptions and flares can be interpret as two consecutive sympathetic eruptions and flares. For the sympathetic eruptions, it requires that they should occur in two different active regions and different PILs on the Sun with some physical connections (Jiang et al., 2009; Liu et al., 2009; Jiang et al., 2011; Török et al., 2011; Yang et al., 2012; Shen et al., 2012; Lynch & Edmondson, 2013). In our case, we observed two eruptions, from two different nearby active regions as well as different PILs (Figure 2). The NLFFF extrapolation shows the presence of overlying field lines of F1 and F2 anchored in the small positive region between them, showing some possible connection between them (see box 2 in Figures 3, 16 and 17). The similar directions of both eruptions within a short time period of 40 minutes provides another evidence for sympathetic eruptions. We also observed two flares associated with these sympathetic eruptions, which can also be considered as the sympathetic flares. Two different set of flare loops have been observed close to each other with common anchoring at the central positive polarity region (Figure 11(e)). Hence, the present observations not only show the sympathetic eruptions but also the sympathetic flares produced by them. Similar types of sympathetic flares associated with two eruptions have also been reported in a few earlier works (e.g., Wang et al., 2001, 2007).
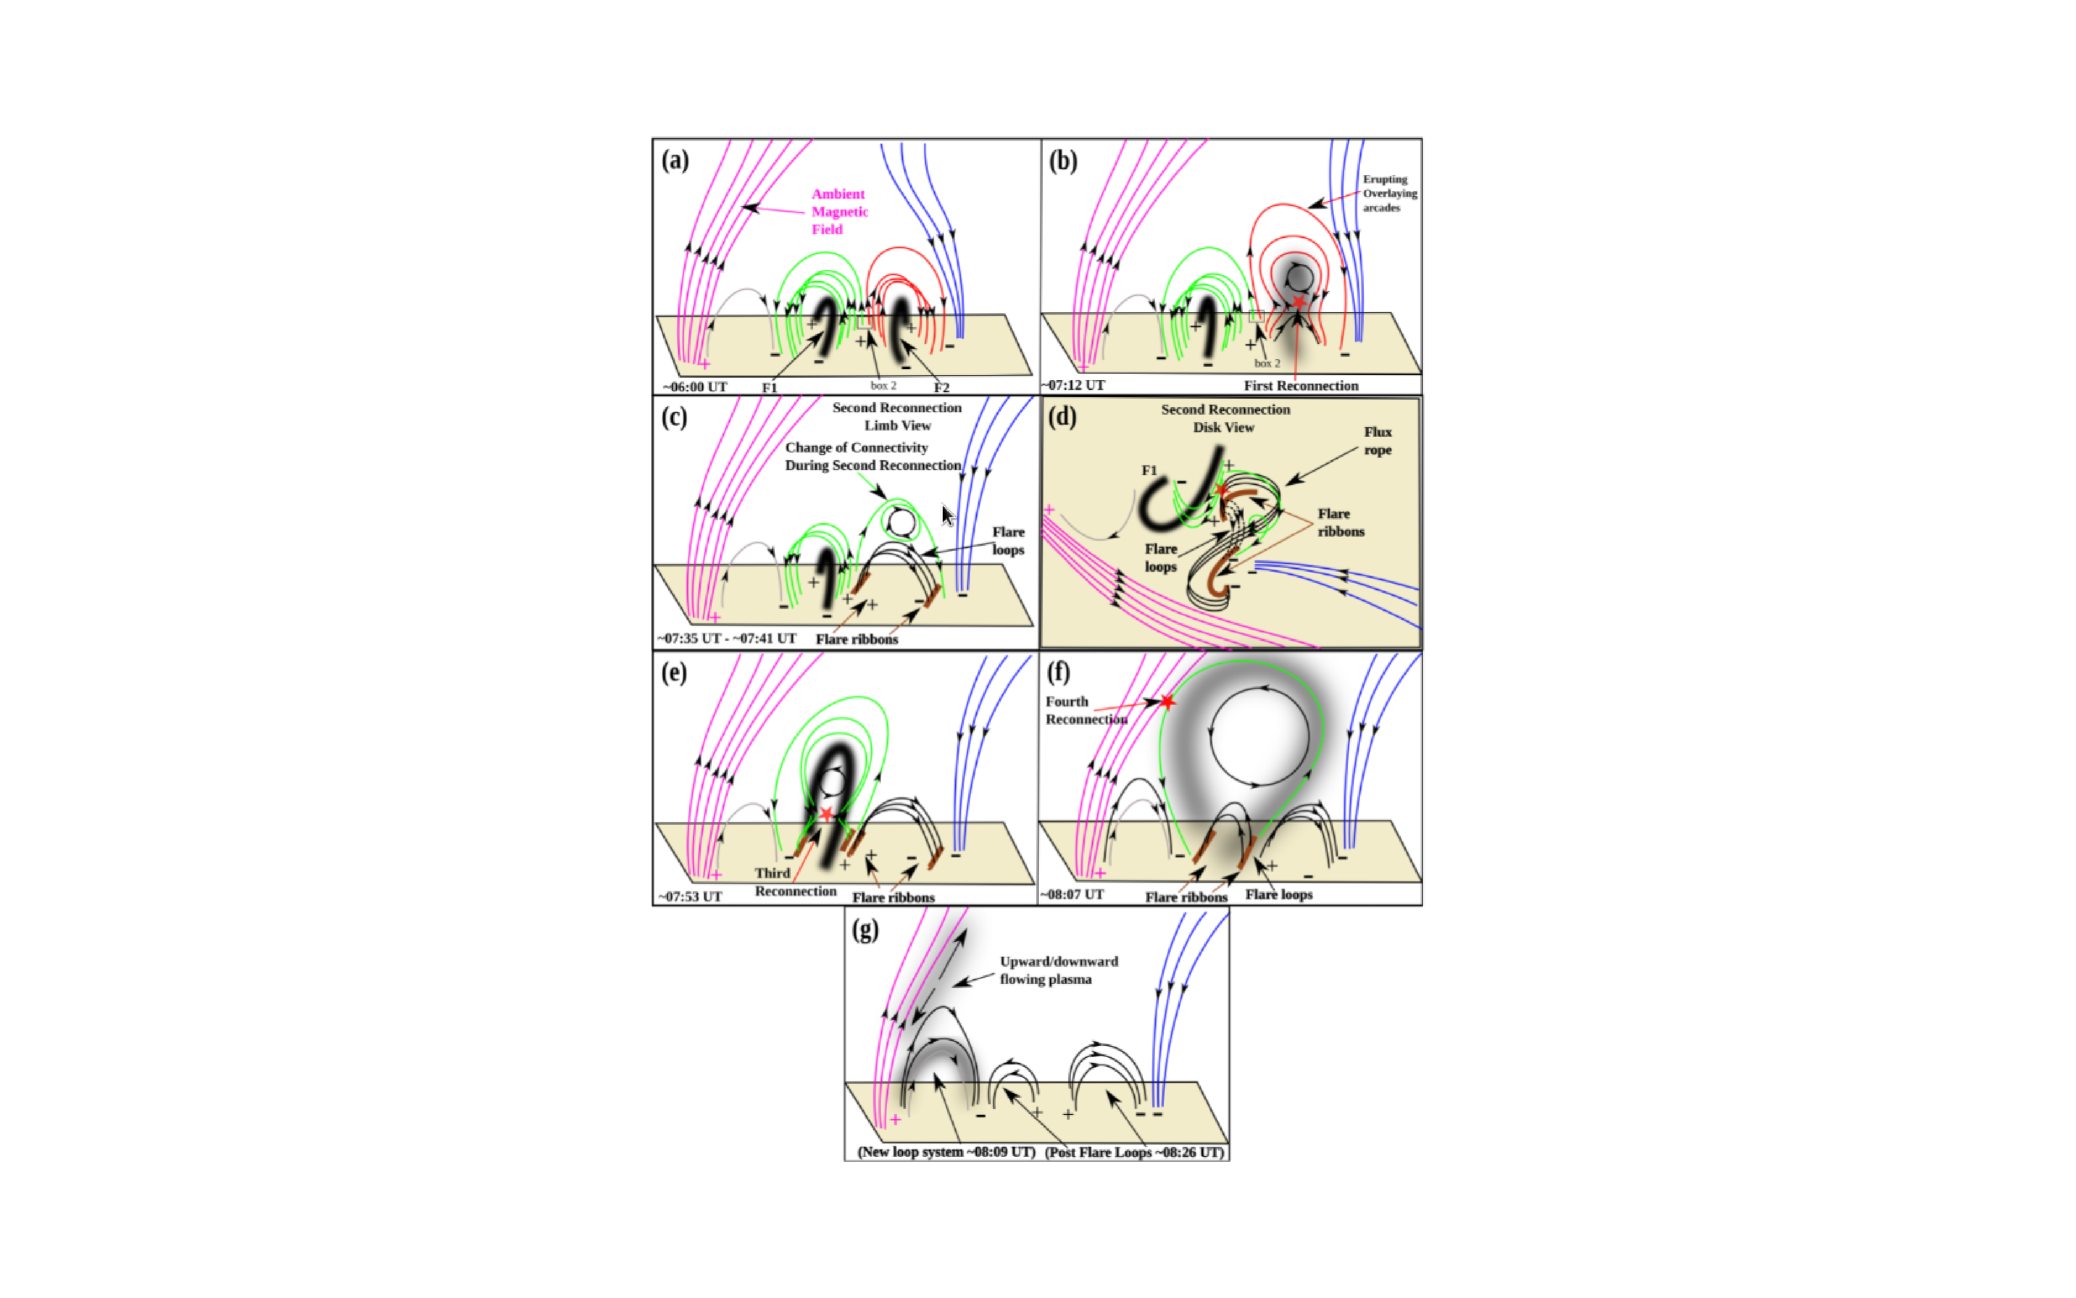
Based on the multi-wavelength observations, we identify the four different stages of reconnections during the sympathetic eruptions (see schematic in Figure 17). Figure 17(a) represents the initial magnetic topology of the filaments and overlying ambient coronal fields. Two nearby filaments (i.e., F1 and F2) exist along with their overlying arcades as well as surrounding ambient fields (see Figure 2 also). The first flare reconnection seems to be consistent with the low–lying tether–cutting type reconnection between the sheared arcades leading to the formation of a flux rope (c.f., Moore et al., 2001). The formation of the flare loops and their separation with time can be understood as resulting from reconnection between the legs of the surrounding field as the flux rope of that first eruption moves outward to form CME1. The growing flare loops and the spreading flare ribbons are the observational signatures of this first reconnection (see animations accompanying Figure 6). Our observations show that the first eruption, which led to this first reconnection, began from near filament F2, but there is no clear ejection of F2. Apparently, F2 was located below the field that erupted in that first eruption. Similar kind of eruptions has been discussed in observational studies (e.g., Pevtsov, 2002; Tripathi et al., 2009; Schmieder et al., 2015). Some of them have been interpreted with the partial eruption model of flux rope (Gibson & Fan, 2006; Tripathi et al., 2009).
The second stage of reconnection is the most difficult one to explain and it is not obvious where it happened. What we are sure is that there is an interaction between both systems (Figure 17(d)) and the flux rope of F2 destabilizes the F1 system. Various observational signatures of second interaction and reconnection have been discussed in Section 3.4. It has been observed that the removal of overlying field lines during the first eruption plays a crucial role to trigger a nearby eruption (e.g., Jiang et al., 2009, 2011; Yang et al., 2012). Some studies proposed that the external breakout type magnetic reconnection during the first eruption either in quadrupolar magnetic configuration (Shen et al., 2012) or in unipolar helmet streamer (Török et al., 2011; Yang et al., 2012; Lynch & Edmondson, 2013) magnetic configuration may be responsible for the other nearby successive eruption by removing the overlying flux. On the other hand the sucking of the field lines over F1 by the first reconnection is also a factor of diminishing the tension (green field lines over F2 in Figure 17(c)). There was probably a driving reconnection pushing the two systems together. This kind of reconnection is only possible in 3D as shown MHD simulations for other event sequences (Török et al., 2011).
The third stage of reconnection is believed to occur during the eruption of filament F1 and has some similarity with the first stage of reconnection occurring in the F2 system (Figures 11(b)–(d) and 17(e) and Section 3.5). This reconnection may be consistent with the standard CSHKP flare model by filament or flux rope eruption (c.f., Carmichael, 1964; Sturrock, 1966; Hirayama, 1974; Kopp & Pneuman, 1976). According to this, during the eruption of filament or flux rope the reconnection between the legs of surrounding arcades in the wake may trigger a solar flare.
The erupting arcades of filament F1 also reconnected with the near-by ambient magnetic flux (Figure 17(f)) and formed another new loop system (Figure 17(f)). We interpret this reconnection as the fourth stage of reconnection (refer to Section 3.6 for detail). This reconnection can be interpreted between the ambient open field lines with the filament F1 growing arcades in the corona. Similar kind of coronal reconnection senario has been discussed by Vršnak et al. (2003) to interpret the filament eruption on 2000 September 12. Recently, for the first time van Driel-Gesztelyi et al. (2014) found the evidence of reconnection in the corona between the field lines of two different active regions during CMEs. They also identified the bright coronal region of reconnection as well as the cool down flowing plasma. In our case, we also find observational signature of coronal reconnection via bi–directional flow of filament F1 plasma after their arcade reconnection with the ambient magnetic field (Figure 12 and associated animations). We also believe that this reconnection was responsible for the acceleration phase of the eruptive part of filament F1 (Section 3.7 and Figure 14(a)). This result suggests that this kind of coronal magnetic field reconnection may play an important role in accelerating the filament speed during its eruption. This reconnection is also believed for the asymmetric eruption of filament F1. We observed that the northern leg of filament F1 erupted fully, while the southern leg remained anchoring on the Sun (Figure 13). We believe that the interaction and reconnection of the erupting southern part of filament F1 with the ambient magnetic field caused the eruption asymmetry. This is a different mechanism compared with the whipping and zipping type model of asymmetric filament eruption given by Liu et al. (2009). In the end, three different types of loop system are formed, i.e., two post flare loops and one newly formed loop system (Figures 11(e), 12(c) and 17(g)).
Another interesting result is that filament F1 broke into two different parts, i.e., the erupting upper and stable lower parts (Figures 4(h), 5(h) and 12(a)). We suggest that the reconnection of the erupting filament F1 with the surviving field of F2 may break F1 into two parts. Also, the observed enhancement in the brightness of the southern ribbon of the first flare during the eruption of filament F1 also provides some hint for this type of interaction (Figure 11(d)).
We also observe that the second fast eruption (speed 377 ) overtook the first slow eruption (160 ) and the associated CMEs merged and formed a compound CME (see Section 3.7 and Figure 15). The compound CME structure can be seen at 08:48 UT and onward with multiple leading edges and cavities (Figures 15(f)–(h)). These observations suggest that the sympathetic nearby eruptions and associated CMEs in the same directions can also lead to the interesting CME–CME interaction events in the corona near the Sun. These interactions have great importance for the production of solar energetic particle events (e.g., Gopalswamy et al., 2001; Joshi et al., 2013b; Masson et al., 2013).
Study of nearby eruptions, flares and CMEs tells important information about magnetic interactions and reconnections between them. We have identified several physical mechanisms for producing this sequence of sympathetic events in two different active regions: canceling flux, shear arcades, inflation or expansion of magnetic field systems. In this study, all these mechanisms work together or successively between the different magnetic systems. It provides a good example of sympathetic events. These kind of observational studies also provide important inputs for MHD modelings of sympathetic eruptions and the associated flares. High resolution observations and more numerical simulation studies are needed to understand the sympathetic events more clearly.
References
- Antiochos et al. (1999) Antiochos, S. K., DeVore, C. R., & Klimchuk, J. A. 1999, ApJ, 510, 485
- Aulanier et al. (1998) Aulanier, G., Demoulin, P., van Driel-Gesztelyi, L., Mein, P., & Deforest, C. 1998, A&A, 335, 309
- Aulanier & Schmieder (2002) Aulanier, G., & Schmieder, B. 2002, A&A, 386, 1106
- Brueckner et al. (1995) Brueckner, G. E., et al. 1995, Sol. Phys., 162, 357
- Carmichael (1964) Carmichael, H. 1964, NASA Special Publication, 50, 451
- Chandra et al. (2011) Chandra, R., Schmieder, B., Mandrini, C. H., Démoulin, P., Pariat, E., Török, T., & Uddin, W. 2011, Sol. Phys., 269, 83
- Chen et al. (2015) Chen, H., Zhang, J., Ma, S., Yang, S., Li, L., Huang, X., & Xiao, J. 2015, ArXiv e-prints
- Chen & Shibata (2000) Chen, P. F., & Shibata, K. 2000, ApJ, 545, 524
- Dalmasse et al. (2015) Dalmasse, K., Chandra, R., Schmieder, B., & Aulanier, G. 2015, A&A, 574, A37
- Filippov et al. (2015) Filippov, B., Martsenyuk, O., Srivastava, A. K., & Uddin, W. 2015, Journal of Astrophysics and Astronomy, 36, 157
- Forbes (2000) Forbes, T. G. 2000, J. Geophys. Res., 105, 23153
- Gibson & Fan (2006) Gibson, S. E., & Fan, Y. 2006, ApJ, 637, L65
- Gilbert et al. (2007) Gilbert, H. R., Alexander, D., & Liu, R. 2007, Sol. Phys., 245, 287
- Gilbert et al. (2000) Gilbert, H. R., Holzer, T. E., Burkepile, J. T., & Hundhausen, A. J. 2000, ApJ, 537, 503
- Gopalswamy et al. (2001) Gopalswamy, N., Yashiro, S., Kaiser, M. L., Howard, R. A., & Bougeret, J.-L. 2001, ApJ, 548, L91
- Guo et al. (2010a) Guo, Y., Ding, M. D., Schmieder, B., Li, H., Török, T., & Wiegelmann, T. 2010a, ApJ, 725, L38
- Guo et al. (2010b) Guo, Y., Schmieder, B., Démoulin, P., Wiegelmann, T., Aulanier, G., Török, T., & Bommier, V. 2010b, ApJ, 714, 343
- Harvey et al. (2011) Harvey, J. W., et al. 2011, in AAS/Solar Physics Division Abstracts #42, 1745
- Hirayama (1974) Hirayama, T. 1974, Sol. Phys., 34, 323
- Hoeksema et al. (2014) Hoeksema, J. T., et al. 2014, Sol. Phys., 289, 3483
- Howard et al. (2008a) Howard, R. A., et al. 2008a, Space Sci. Rev., 136, 67
- Howard et al. (2008b) Howard, R. A., et al. 2008b, Space Sci. Rev., 136, 67
- Jiang et al. (2011) Jiang, Y., Yang, J., Hong, J., Bi, Y., & Zheng, R. 2011, ApJ, 738, 179
- Jiang et al. (2014) Jiang, Y., Yang, J., Wang, H., Ji, H., Liu, Y., Li, H., & Li, J. 2014, The Astrophysical Journal, 793, 14
- Jiang et al. (2009) Jiang, Y.-C., Bi, Y., Yang, J.-Y., Zheng, R.-S., & Wang, J.-X. 2009, Research in Astronomy and Astrophysics, 9, 603
- Joshi et al. (2014) Joshi, N. C., Magara, T., & Inoue, S. 2014, ApJ, 795, 4
- Joshi et al. (2014) Joshi, N. C., Srivastava, A. K., Filippov, B., Kayshap, P., Uddin, W., Chandra, R., Prasad Choudhary, D., & Dwivedi, B. N. 2014, ApJ, 787, 11
- Joshi et al. (2013a) Joshi, N. C., Srivastava, A. K., Filippov, B., Uddin, W., Kayshap, P., & Chandra, R. 2013a, ApJ, 771, 65
- Joshi et al. (2013b) Joshi, N. C., et al. 2013b, Advances in Space Research, 52, 1
- Kopp & Pneuman (1976) Kopp, R. A., & Pneuman, G. W. 1976, Sol. Phys., 50, 85
- Labrosse et al. (2010) Labrosse, N., Heinzel, P., Vial, J.-C., Kucera, T., Parenti, S., Gunár, S., Schmieder, B., & Kilper, G. 2010, Space Sci. Rev., 151, 243
- Lemen et al. (2012) Lemen, J. R., et al. 2012, Sol. Phys., 275, 17
- Lin et al. (2002) Lin, R. P., et al. 2002, Sol. Phys., 210, 3
- Liu et al. (2009) Liu, C., Lee, J., Karlický, M., Prasad Choudhary, D., Deng, N., & Wang, H. 2009, ApJ, 703, 757
- Liu et al. (2012) Liu, R., Kliem, B., Török, T., Liu, C., Titov, V. S., Lionello, R., Linker, J. A., & Wang, H. 2012, ApJ, 756, 59
- Liu & Ofman (2014) Liu, W., & Ofman, L. 2014, Sol. Phys., 289, 3233
- Liu (2008) Liu, Y. 2008, ApJ, 679, L151
- López Ariste et al. (2006) López Ariste, A., Aulanier, G., Schmieder, B., & Sainz Dalda, A. 2006, A&A, 456, 725
- Lynch & Edmondson (2013) Lynch, B. J., & Edmondson, J. K. 2013, ApJ, 764, 87
- Mackay et al. (2010) Mackay, D. H., Karpen, J. T., Ballester, J. L., Schmieder, B., & Aulanier, G. 2010, Space Sci. Rev., 151, 333
- Martens & Zwaan (2001) Martens, P. C., & Zwaan, C. 2001, ApJ, 558, 872
- Martin (1998a) Martin, S. F. 1998a, Sol. Phys., 182, 107
- Martin (1998b) Martin, S. F. 1998b, in Astronomical Society of the Pacific Conference Series, Vol. 150, IAU Colloq. 167: New Perspectives on Solar Prominences, ed. D. F. Webb, B. Schmieder, & D. M. Rust, 419
- Masson et al. (2013) Masson, S., Antiochos, S. K., & DeVore, C. R. 2013, ApJ, 771, 82
- Moon et al. (2002) Moon, Y.-J., Choe, G. S., Park, Y. D., Wang, H., Gallagher, P. T., Chae, J., Yun, H. S., & Goode, P. R. 2002, ApJ, 574, 434
- Moore et al. (2001) Moore, R. L., Sterling, A. C., Hudson, H. S., & Lemen, J. R. 2001, ApJ, 552, 833
- Pevtsov (2002) Pevtsov, A. A. 2002, Sol. Phys., 207, 111
- Pevtsov et al. (2003) Pevtsov, A. A., Balasubramaniam, K. S., & Rogers, J. W. 2003, ApJ, 595, 500
- Schmieder et al. (2015) Schmieder, B., Aulanier, G., & Vršnak, B. 2015, Sol. Phys., 290, 3457
- Schmieder et al. (2008) Schmieder, B., Bommier, V., Kitai, R., Matsumoto, T., Ishii, T. T., Hagino, M., Li, H., & Golub, L. 2008, Sol. Phys., 247, 321
- Schmieder et al. (2013) Schmieder, B., Démoulin, P., & Aulanier, G. 2013, Advances in Space Research, 51, 1967
- Schou et al. (2012) Schou, J., et al. 2012, Sol. Phys., 275, 229
- Schrijver & Title (2011) Schrijver, C. J., & Title, A. M. 2011, Journal of Geophysical Research (Space Physics), 116, 4108
- Shen et al. (2012) Shen, Y., Liu, Y., & Su, J. 2012, ApJ, 750, 12
- Sturrock (1966) Sturrock, P. A. 1966, Nature, 211, 695
- Sun et al. (2015) Sun, X., et al. 2015, ApJ, 804, L28
- Török & Kliem (2005) Török, T., & Kliem, B. 2005, ApJ, 630, L97
- Török et al. (2011) Török, T., Panasenco, O., Titov, V. S., Mikić, Z., Reeves, K. K., Velli, M., Linker, J. A., & De Toma, G. 2011, ApJ, 739, L63
- Török et al. (2013) Török, T., Temmer, M., Valori, G., Veronig, A. M., van Driel-Gesztelyi, L., & Vršnak, B. 2013, Sol. Phys., 286, 453
- Tripathi et al. (2009) Tripathi, D., Gibson, S. E., Qiu, J., Fletcher, L., Liu, R., Gilbert, H., & Mason, H. E. 2009, A&A, 498, 295
- van Ballegooijen (2004) van Ballegooijen, A. A. 2004, ApJ, 612, 519
- van Ballegooijen & Martens (1989) van Ballegooijen, A. A., & Martens, P. C. H. 1989, ApJ, 343, 971
- van Driel-Gesztelyi et al. (2014) van Driel-Gesztelyi, L., et al. 2014, ApJ, 788, 85
- Vršnak et al. (2003) Vršnak, B., Warmuth, A., Maričić, D., Otruba, W., & Ruždjak, V. 2003, Sol. Phys., 217, 187
- Wang et al. (2001) Wang, H., Chae, J., Yurchyshyn, V., Yang, G., Steinegger, M., & Goode, P. 2001, ApJ, 559, 1171
- Wang et al. (2007) Wang, H., Liu, C., Jing, J., & Yurchyshyn, V. 2007, ApJ, 671, 973
- Wiegelmann (2004) Wiegelmann, T. 2004, Sol. Phys., 219, 87
- Wiegelmann et al. (2006) Wiegelmann, T., Inhester, B., & Sakurai, T. 2006, Sol. Phys., 233, 215
- Wuelser et al. (2004) Wuelser, J.-P., et al. 2004, in Society of Photo-Optical Instrumentation Engineers (SPIE) Conference Series, Vol. 5171, Society of Photo-Optical Instrumentation Engineers (SPIE) Conference Series, ed. S. Fineschi & M. A. Gummin, 111
- Yang et al. (2012) Yang, J., Jiang, Y., Zheng, R., Bi, Y., Hong, J., & Yang, B. 2012, ApJ, 745, 9
- Zhang et al. (2015) Zhang, Q. M., Ning, Z. J., Guo, Y., Zhou, T. H., Cheng, X., Ji, H. S., Feng, L., & Wiegelmann, T. 2015, ApJ, 805, 4
- Zhukov & Veselovsky (2007) Zhukov, A. N., & Veselovsky, I. S. 2007, ApJ, 664, L131