Identifying and characterizing Sybils in the Tor network
Abstract
Being a volunteer-run, distributed anonymity network, Tor is vulnerable to Sybil attacks. Little is known about real-world Sybils in the Tor network, and we lack practical tools and methods to expose Sybil attacks. In this work, we develop sybilhunter, the first system for detecting Sybil relays based on their appearance, such as configuration; and behavior, such as uptime sequences. We used sybilhunter’s diverse analysis techniques to analyze nine years of archived Tor network data, providing us with new insights into the operation of real-world attackers. Our findings include diverse Sybils, ranging from botnets, to academic research, and relays that hijack Bitcoin transactions. Our work shows that existing Sybil defenses do not apply to Tor, it delivers insights into real-world attacks, and provides practical tools to uncover and characterize Sybils, making the network safer for its users.
1 Introduction
In a Sybil attack, an attacker controls many virtual identities to obtain disproportionately large influence in a network. These attacks take many shapes, such as sockpuppets hijacking online discourse [34]; the manipulation of BitTorrent’s distributed hash table [35]; and, most relevant to our work, relays in the Tor network that seek to deanonymize users [8]. In addition to coining the term “Sybil,” Douceur showed that practical Sybil defenses are challenging, arguing that Sybil attacks are always possible without a central authority [11]. In this work, we focus on Sybils in Tor—relays that are controlled by a single operator. But what harm can Sybils do?
The effectiveness of many attacks on Tor depends on how large a fraction of the network’s traffic—the consensus weight—an attacker can observe. As the attacker’s consensus weight grows, the following attacks become easier.
- Exit traffic tampering:
-
A Tor user’s traffic traverses exit relays, the last hop in a Tor circuit, when leaving the Tor network. Controlling exit relays, an attacker can sniff traffic to collect unencrypted credentials, break into TLS-protected connections, or inject malicious content [37].
- Website fingerprinting:
-
Tor’s encryption prevents guard relays (the first hop in a Tor circuit) from learning their user’s online activity. Ignoring the encrypted payload, an attacker can still take advantage of flow information such as packet lengths and timings to infer what web site her users are connecting to [18].
- Bridge address harvesting:
-
Users behind censorship firewalls use private Tor relays (“bridges”) as hidden stepping stones into the Tor network. It is important that censors cannot obtain all bridge addresses, which is why bridge distribution is rate-limited. However, an attacker can harvest bridge addresses by running a middle relay and looking for incoming connections that do not originate from any of the publicly known guard relays [23].
- End-to-end correlation:
-
By running both entry guards and exit relays, an attacker can use timing analysis to link a Tor user’s identity to her activity, e.g., learn that Alice is visiting Facebook. For this attack to work, an attacker must run at least two Tor relays, or be able to eavesdrop on at least two networks [15].
Configuring a relay to forward more traffic allows an attacker to increase her consensus weight. However, the capacity of a single relay is limited by its link bandwidth and, because of the computational cost of cryptography, by CPU. Ultimately, increasing consensus weight requires an adversary to add relays to the network; we call these additional relays Sybils.
In addition to the above attacks, an adversary needs Sybil relays to manipulate onion services, which are TCP servers whose IP address is hidden by Tor. In the current onion service protocol, six Sybil relays are sufficient to take offline an onion service because of a weakness in the design of the distributed hash table (DHT) that powers onion services [4]. Finally, instead of being a direct means to an end, Sybil relays can be a side effect of another issue. In Section 5.1, we provide evidence for what appears to be botnets whose zombies are running Tor relays, perhaps because of a misguided attempt to help the Tor network grow.
Motivated by the lack of practical Sybil detection tools, we design and implement heuristics, leveraging that Sybils (i) frequently go online and offline simultaneously, (ii) share similarities in their configuration, and (iii) may change their identity fingerprint—a relay’s fingerprint is the hash over its public key—frequently, to manipulate Tor’s DHT. We implemented these heuristics in a tool, sybilhunter, whose development required a major engineering effort because we had to process 100 GiB of data and millions of files. We used sybilhunter to analyze archived network data, dating back to 2007, to discover past attacks and anomalies. Finally, we characterize the Sybil groups we discovered. To sum up, we make the following key contributions:
-
•
We design and implement sybilhunter, a tool to analyze past and future Tor network data. While we designed it specifically for the use in Tor, our techniques are general in nature and can easily be applied to other distributed systems such as I2P [31].
-
•
We expose and characterize Sybil groups, and publish our findings as datasets to stimulate future research.111The dataset is online at https://nymity.ch/sybilhunting/. We find that Sybils run MitM attacks, DoS attacks, and are used for research projects.
The rest of this paper is structured as follows. We begin by discussing related work in Section 2 and give some background on Tor in Section 3. Section 4 presents the design of our analysis tools, which is then followed by experimental results in Section 5. We discuss our results in Section 6 and conclude the paper in Section 7.
2 Related work
In his seminal 2002 paper, Douceur showed that only a central authority that verifies new nodes as they join the distributed system is guaranteed to prevent Sybils [11]. This approach conflicts with Tor’s design philosophy that seeks to distribute trust and eliminate central points of control. In addition, a major factor contributing to Tor’s network growth is the low barrier of entry, allowing operators to set up relays both quickly and anonymously. An identity-verifying authority would raise that barrier, alienate privacy-conscious relay operators, and impede Tor’s growth. Barring a central authority, researchers have proposed techniques that leverage a resource that is difficult for an attacker to scale. Two categories of Sybil-resistant schemes turned out to be particularly popular, schemes that build on social constraints and schemes that build on computational constraints. For a broad overview of alternative Sybil defenses, refer to Levine et al. [20].
Social constraints rely on the assumption that it is difficult for an attacker to form trust relationships with honest users, e.g., befriend many unknown people on online social networks. Past work leveraged this assumption in systems such as SybilGuard [39], SybilLimit [38], and SybilInfer [6]. Unfortunately, social graph-based defenses do not work in our setting because there is no existing trust relationship between relay operators.222Relay operators can express in their configuration that their relays are run by the same operator, but this denotes an intra-person and not an inter-person trust relationship. Note that we could create such a relationship by, e.g., linking relays to their operator’s social networking account, or by creating a “relay operator web of trust,” but again, we believe that such an effort would alienate relay operators and receive limited adoption.
Orthogonal to social constraints, computational resource constraints guarantee that an attacker that seeks to operate 100 Sybils needs 100 times the computational resources she would have needed for a single virtual identity. Both Borisov [5] and Li et al. [22] used computational puzzles for that purpose. Computational constraints work well in distributed systems where the cost of joining the network is low. For example, a lightweight client is enough to use BitTorrent, allowing even low-end consumer devices to participate. However, this is not the case in Tor because relay operations require constant use of bandwidth and CPU. Unlike in many other distributed systems, it is impossible to run 100 Tor relays while not spending the resources for 100 relays. Computational constraints are inherent to running a relay.
There has also been progress outside of academic research; namely, The Tor Project has incorporated a number of both implicit and explicit Sybil defenses that are in place as of February 2016. First, directory authorities—the “gatekeepers” of the Tor network—accept at most two relays per IP address to prevent low-resource Sybil attacks [3, 2]. Similarly, Tor’s path selection algorithm states that Tor clients never select two relays in the same /16 network [9]. Second, directory authorities automatically assign flags to relays, indicating their status and quality of service. The Tor Project has recently increased the minimal time until relays obtain the Stable flag (seven days) and the HSDir flag (96 hours). This change increases the cost of Sybil attacks and gives Tor developers more time to discover and block suspicious relays before they get in a position to run an attack. Finally, the operation of a Tor relay causes recurring costs—most notably bandwidth and electricity—which can further restrain an adversary.
In summary, we believe that existing Sybil defenses do not work well when applied to the Tor network; its distinctive features call for customized solutions that consider the nature of Tor relays.
3 Background
We now provide necessary background on the Tor network [10]. Tor consists of several thousand volunteer-run relays that are summarized in the network consensus that is voted on and published every hour by eight distributed directory authorities. The authorities assign a variety of flags to relays:
- Valid:
-
The relay is valid, i.e., not known to be broken.
- HSDir:
-
The relay is an onion service directory, i.e., it participates in the DHT that powers Tor onion services.
- Exit:
-
The relay is an exit relay.
- BadExit:
-
The relay is an exit relay but is either misconfigured or malicious, and should therefore not be used by Tor clients.
- Stable:
-
Relays are stable if their mean time between failure is at least the median of all relays, or at least seven days.
- Guard:
-
Guard relays are the rarely-changing first hop for Tor clients.
- Running:
-
A relay is running if the directory authorities could connect to it in the last 45 minutes.
Tor relays are uniquely identified by their fingerprint, a Base32-encoded and truncated SHA-1 hash over their public key. Operators can further assign a nickname to their Tor relays, which is a string that identifies a relay (albeit not uniquely) and is easier to remember than its pseudo-random fingerprint. Exit relays have an exit policy—a list of IP addresses and ports that the relay allows connections to. Finally, operators that run more than one relay are encouraged to configure their relays to be part of a relay family. Families are used to express that a set of relays is controlled by a single party. Tor clients never use more than one family member in their path to prevent correlation attacks. As of February 2016, there are approximately 400 relay families in all 7,000 relays.
4 Data and design
We define Sybils in the Tor network as two or more relays that are controlled by a single person or group of people. Sybils per se do not have to be malicious; a relay operator could simply have forgotten to configure her relays as a relay family. Such Sybils are no threat to the Tor network, which is why we refer to them as benign Sybils. What we are interested in is malicious Sybils whose purpose is to deanonymize or otherwise harm Tor users.
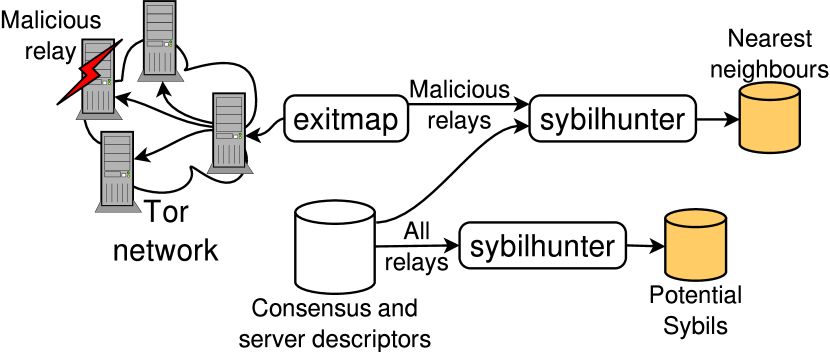
We draw on two datasets—one publicly available and one created by us—to uncover malicious Sybils. Our detection methods are implemented in a tool, sybilhunter, which takes as input our two datasets and then attempts to expose Sybil groups, as illustrated in Figure 1. Sybilhunter is implemented in Go and consists of 3,300 lines of code.
4.1 Datasets
Figure 1 shows how we use our two datasets. Archived consensuses and router descriptors (in short: descriptors) allow us to (i) restore past states of the Tor network, which sybilhunter mines for Sybil groups, and to (ii) find “partners in crime” of malicious exit relays that we discovered by running exitmap, a scanner for Tor exit relays that is presented below.
4.1.1 Consensuses and router descriptors
The consensus and descriptor dataset is publicly available on CollecTor [32], an archiving service that is run by The Tor Project. Some of the archived data dates back to 2004, allowing us to restore arbitrary Tor network configurations from the last ten years. Not all of CollecTor’s archived data is relevant to our hunt for Sybils, however, which is why we only analyze the following two:
Descriptors
Tor relays and bridges periodically upload router descriptors, which capture their configuration, to directory authorities. Figure 2 shows an example in the box to the right. Relays upload their descriptors no later than every 18 hours, or sooner, depending on certain conditions. Note that some information in router descriptors is not verified by directory authorities. Therefore, relays can spoof information such as their operating system, Tor version, and uptime.
Consensuses
Each hour, the nine directory authorities vote on their view of all Tor relays that are currently online. The vote produces the consensus, an authoritative list that comprises all running Tor relays, represented as a set of router statuses. Each router status in the consensus contains basic information about Tor relays such as their bandwidth, flags, and exit policy. It also contains a pointer to the relay’s descriptor, as shown in Figure 2. As of February 2016, consensuses contain approximately 7,000 router statuses, i.e., each hour, 7,000 router statuses are published, and archived, by CollecTor.
Table 1 gives an overview of the size of our consensus and descriptor archives. We found it challenging to repeatedly process these millions of files, amounting to more than 100 GiB of uncompressed data. In our first processing attempt, we used the Python parsing library Stem [17], which is maintained by The Tor Project. The data volume turned out to be difficult to handle for Stem because of Python’s interpreted and dynamic nature. To process our dataset more efficiently, we implemented a custom parser in Go [36].
| Dataset | # of files | Size | Time span |
|---|---|---|---|
| Consensuses | 72,061 | 51 GiB | 10/2007–01/2016 |
| Descriptors | 34,789,777 | 52 GiB | 12/2005–01/2016 |
4.1.2 Malicious exit relays
In addition to our publicly available and primary dataset, we collected malicious exit relays over 18 months. We call exit relays malicious if they modify forwarded traffic in bad faith, e.g., to run man-in-the-middle attacks. We add these relays to our dataset because they frequently surface in groups, as malicious Sybils, because an attacker runs the same attack on several, physically distinct exit relays. Winter et al.’s work [37, §5.2] further showed that attackers make an effort to stay under the radar, which is why we cannot only rely on active probing to find such relays. We also seek to find potential “partners in crime” of each newly discovered malicious relay, which we discuss in Section 4.3.4.
We exposed malicious exit relays using Winter et al.’s exitmap tool [37]. Exitmap is a Python-based scanning framework for Tor exit relays. Exitmap modules perform a network task that can then be run over all exit relays. One use case is HTTPS man-in-the-middle detection: A module can fetch the certificate of a web server over all exit relays and then compare its fingerprint with the expected, valid fingerprint. Exposed attacks, however, can be difficult to attribute because an attack can take place upstream of the exit relay, e.g., at a malicious autonomous system.
In addition to the original modules that the exitmap authors shared with us, we implemented exitmap modules to detect HTML tampering and TLS downgrading, by connecting to servers under our control and raising an alert if the returned HTML or TLS server hello were modified. Our modules ran from August 2014 to January 2016 and discovered 251 malicious exit relays, shown in Appendix A, that we all reported to The Tor Project, which subsequently blocked these relays.
4.2 Threat model
Most of this paper is on applying sybilhunter to archived network data, but we can also apply it to newly incoming data. This puts us in an adversarial setting as attackers can tune their Sybils to evade our system. This is reflected in our adversarial assumptions. We assume that an adversary does run more than one Tor relay and exhibits redundancy in their relay configuration, or uptime sequence. An adversary further can know how sybilhunter’s modules work, run active or passive attacks, and make a limited effort to stay under the radar, by diversifying parts of their configuration. To detect Sybils, however, our heuristics require some redundancy.
4.3 Analysis techniques
Having discussed our datasets and threat model, we now turn to presenting techniques that can expose Sybils. Our techniques are based on the insight that Sybil relays typically behave or appear similarly. Shared configuration parameters such as port numbers and nicknames cause similar appearance whereas Sybils behave similarly when they reboot simultaneously, or exhibit identical quirks when relaying traffic.
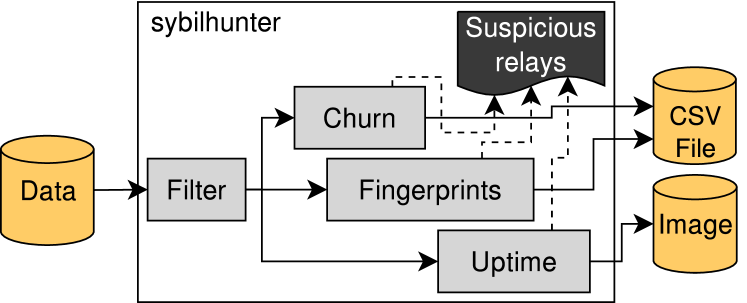
Sybilhunter can analyze (i) historical network data, dating back to 2007; (ii) online data, to detect new Sybils as they join the network; and (iii) find relays that might be associated with previously discovered, malicious relays. Figure 3 shows sybilhunter’s internal architecture. Tor network data first passes a filtering component that can be used to inspect a subset of the data. It is then forwarded to one or more modules that implement an analysis technique. These modules work independently, but share a data structure to find suspicious relays that show up in more than one module. Depending on the analysis technique, sybilhunter’s output is CSV files or images.
While developing sybilhunter, we had to make many design decisions that we tackled by drawing on the experience we gained by manually analyzing numerous Sybil groups. We iteratively improved our code and augmented it with new features when we experienced operational shortcomings.
4.3.1 Network churn
The churn rate of a distributed system captures the rate of joining and leaving network participants. In the Tor network, these participants are relays. An unexpectedly high churn rate between two subsequent consensuses means that many relays joined or left, which can reveal Sybils and other network issues because Sybil operators frequently start and stop their Sybils at the same time, to ease administration—they behave similarly.
The Tor Project is maintaining a Python script [16] that determines the number of previously unobserved relay fingerprints in new consensuses. If that number is greater than or equal to the static threshold 50, the script sends an e-mail alert. We reimplemented the script in sybilhunter and ran it over all archived consensus documents, dating back to 2007. The script raised 47 alerts in nine years, all of which seemed to be true positives, i.e., they should be of interest to The Tor Project. The script did not raise false positives, presumably because the median number of new fingerprints in a consensus is only six—significantly below the conservative threshold of 50. Yet, the threshold likely causes false negatives, but we cannot determine the false negative rate because we lack ground truth. In addition, The Tor Project’s script does not consider relays that left the network, does not distinguish between relays with different flags, and does not adapt its threshold as the network grows. We now present an alternative approach that is more flexible and robust.
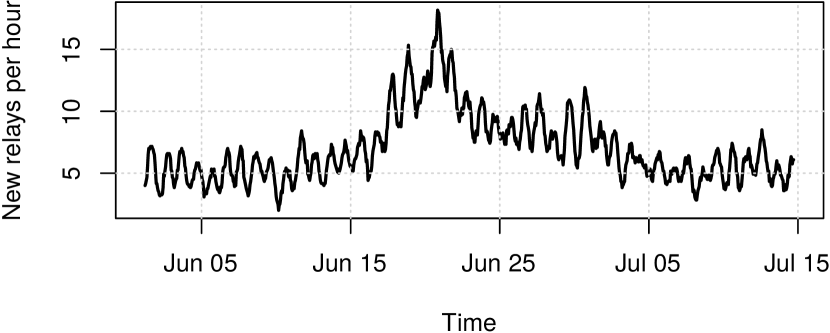
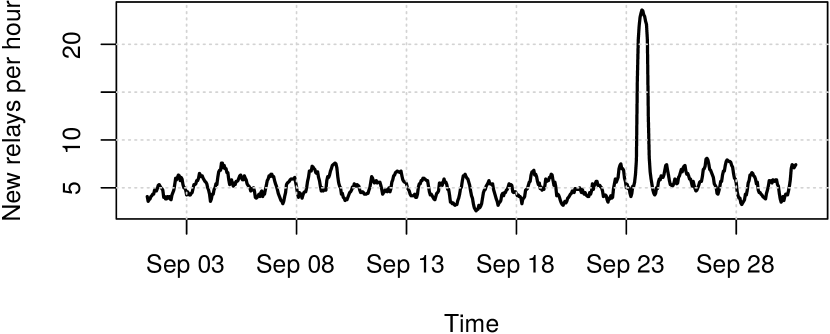
We found that churn anomalies worthy of our attention range from flat hills (Fig. 4) to sudden spikes (Fig. 5). Flat hills can be a sign of an event that concerned a large number of relays, over many hours or days. Such an event happened shortly after the Heartbleed bug, when The Tor Project asked relay operators to generate new keys. Relay operators acted gradually, most within two days. Sudden spikes can happen if an attacker adds many relays, all at once. These are mere examples, however; the shape of a time series cannot tell us anything about the nature of the underlying incident.
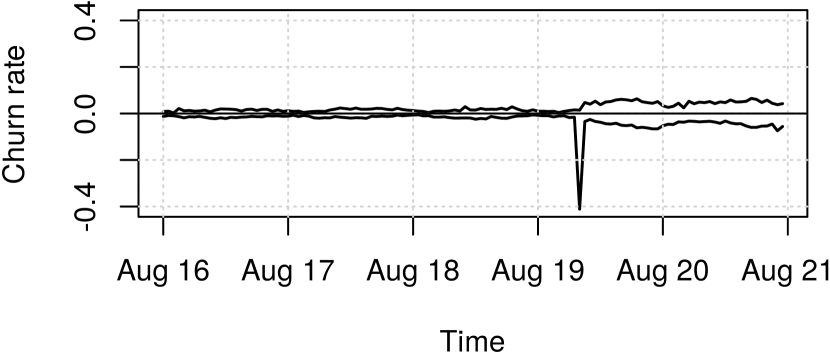
To quantify the churn rate between two subsequent consensus documents, we adapt Godfrey et al.’s formula, which yields a churn value that captures both systems that joined and systems that left the network [14]. However, an unusually low number of systems that left could cancel out an unusually high number of new systems and vice versa—an undesired property for a technique that should spot abnormal changes. To address this issue, we split the formula in two parts, creating a time series for new relays () and for relays that left (). is the network consensus at time , and denotes the complement between two consensuses, i.e., the relays that are in the left operand, but not the right operand. We define and as
| (1) |
Both and are bounded to the interval . A churn value of 0 indicates no change between two subsequent consensuses whereas a churn value of 1 indicates a complete turnover. Determining for the sequence , …, , yields a time series of churn values that can readily be inspected for abnormal spikes. We found that many churn anomalies are caused by relays that share a flag, or a flag combination, e.g., HSDir (onion service directories) and Exit (exit relays). Therefore, sybilhunter can also generate per-flag churn time series that can uncover patterns that would be lost in a flag-agnostic time series.
Finally, to detect changes in the underlying time series trend—flat hills—we can smooth using a simple moving average defined as
| (2) |
As we increase the window size , we can detect more subtle changes in the underlying churn trend. If or exceed a manually defined threshold, an alert is raised. Section 5.2 elaborates on how a threshold can be chosen in practice.
4.3.2 Uptime matrix
For convenience, Sybil operators are likely to administer their relays simultaneously, i.e., update, configure, and reboot them all at the same time. This is reflected in their relays’ uptime. An operating system upgrade that requires a reboot of Sybil relays will induce a set of relays to go offline and return online in a synchronized manner. To isolate such events, we are visualizing the uptime patterns of Tor relays by grouping together relays whose uptime is highly correlated. The churn technique presented above is similar but it only provides an aggregate, high-level view on how Tor relays join and leave the network. Since the technique is aggregate, it is poorly suited for visualizing the uptime of specific relays; an abnormally high churn value attracts our attention but does not tell us what caused the anomaly. To fill this gap, we complement the churn analysis with an uptime matrix that we will now present.
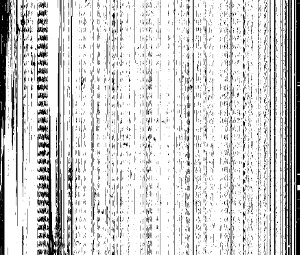
This uptime matrix consists of the uptime patterns of all Tor relays, which we represent as binary sequences. Each hour, when a new consensus is published, we add a new data point—“online” or “offline”—to each Tor relay’s sequence. We visualize all sequences in a bitmap whose rows represent consensuses and whose columns represent relays. Each pixel denotes the uptime status of a particular relay at a particular hour. Black pixels mean that the relay was online and white pixels mean that the relay was offline. This type of visualization was first proposed by Ensafi and subsequently implemented by Fifield [13].
Of particular importance is how the uptime sequences are sorted. If highly correlated sequences are not adjacent in the visualization, we might miss them. We sort sequences using single-linkage clustering, a type of hierarchical clustering algorithm that forms groups bottom-up, based on the minimum distance between group members. Our clustering algorithm requires a distance function. Similar to Andersen et al. [1], we use Pearson’s correlation coefficient as our distance function because it tells us if two uptime sequences change together. The sample correlation coefficient yields a value in the interval . A coefficient of denotes perfect anti-correlation (relay is only online when relay is offline) and 1 denotes perfect correlation (relay is only online when relay is online). We define our distance function as , so two perfectly correlated sequences have a distance of zero while two perfectly anti-correlated sequences have a distance of two. Once all sequences are sorted, we color adjacent sequences in red if their uptime sequence is identical. Figure 6 shows an example of our visualization algorithm, the uptime matrix for a subset of all Tor relays in November 2012.

4.3.3 Fingerprint analysis
The information a Tor client needs to connect to an onion service is stored in a DHT that consists of a subset of all Tor relays, the onion service directories (HSDirs). As of February 2016, 46% of all Tor relays serve as HSDirs. A daily-changing set of six HSDirs host the contact information of any given onion service. Tor clients contact one of these six HSDirs to request information about the onion service they intend to connect to. A HSDir becomes responsible for an onion service if the difference between its relay fingerprint and the service’s descriptor ID is smaller than that of any other relay. The descriptor ID is derived from the onion service’s public key, a time stamp, and additional information. All HSDirs are public, making it possible to determine at which position in the DHT an onion service will end up at any point in the future. Attackers can exploit the ability to predict the DHT position by repeatedly generating identity keys until their fingerprint is sufficiently close to the targeted onion service’s index, thus becoming its HSDir [4].
We detect relays that change their fingerprint frequently by maintaining a lookup table that maps a relay’s IP address to a list of all fingerprints we have seen it use. We sort the lookup table by the relays that changed their fingerprints the most, and output the results.
4.3.4 Nearest-neighbor search
We frequently found ourselves in a situation where exitmap discovered a malicious exit relay and we were left wondering if there were similar, potentially associated relays. Looking for such relays involved extensive manual work, which we soon started to automate. We needed an algorithm for nearest-neighbor search that takes as input a “seed” relay and finds its most similar neighbors. We define similarity as shared configuration parameters such as port numbers, IP addresses, exit policies, or bandwidth values. Our search algorithm sorts relays by comparing these configuration parameters.
To quantify the similarity between two relays, we use the Levenshtein distance, a distance metric that takes as input two strings and determines the minimum number of modifications—insert, delete, and modify—that are necessary to turn string into . Our algorithm turns the router statuses and descriptors of two relays into strings and determines their Levenshtein distance. As an example, consider a simplified configuration representation consisting of the concatenation of nickname, IP address, and port. To turn string into , six operations are necessary; three modifications (green) and two deletions (red):
: Foo10.0.0.19001
: Bar10.0.0.2549001
Our algorithm determines the Levenshtein distance between a “seed” relay and all relays in a consensus. It then sorts the calculated distances in ascending order and prints the most similar relays to the console. For a consensus consisting of 6,525 relays, our algorithm takes approximately 1.5 seconds to finish.333We measured on an Intel Core i7-3520M CPU at 2.9 GHz, a consumer-grade CPU.
5 Evaluation and results
Equipped with sybilhunter, we applied our techniques to nine years of archived Tor network data, resulting in several megabytes of CSV files and uptime images. We sorted our results in descending order by severity, and started manually analyzing the most significant incidents. Several outliers were caused by problems and events in the Tor network that were unrelated to Sybil relays. Instead of providing an exhaustive list of all potential Sybils, we focus on our most salient findings—relay groups that were either clearly malicious or distinguished themselves otherwise.444Our datasets and visualizations are available online, and can be inspected for an exhaustive list of potential Sybils. The URL is https://nymity.ch/sybilhunting/.
Once we discovered a seemingly harmful Sybil group, we reported it to The Tor Project. To defend against Sybil attacks, directory authorities can either remove a relay from the consensus, or take away its Valid flag, which means that the relay is still in the consensus, but Tor clients will not consider it for their first or last hop in a circuit. The majority of directory authorities, i.e., five out of eight, must agree on either strategy. This mechanism is meant to distribute the power of removing relays into the hands of a diverse set of people.
We present our results by first giving an overview of the most interesting Sybils we discovered in Section 5.1; followed by technique-specific results in Sections 5.2, 5.3, and 5.4; an evaluation of our nearest-neighbor search in Section 5.5; and the computational cost of our techniques in Section 5.6.
5.1 Sybil characterization
Table 2 shows the most interesting Sybil groups we identified. The columns show (i) what we believe to be the purpose of the Sybils, (ii) when the Sybil group was at its peak size, (iii) the ID we gave the Sybils, (iv), the number of Sybil fingerprints, (v) the analysis techniques that could discover the Sybils, and (vi) a short description. The analysis techniques are abbreviated as “E” (exitmap), “C” (Churn), “U” (Uptime), “F” (Fingerprint), and “N” (Neighbor search). We now discuss the most insightful incidents in greater detail.
| Purpose | Peak activity | Group ID | Number | Method | Description |
| MitM | Jan 2016 | rewrite | 42 | E | Replaced onion domains with impersonation site. |
| Nov 2015 | rewrite | 8 | E | Replaced onion domains with impersonation site. | |
| Jun 2015 | rewrite | 55 | E | Replaced onion domains with impersonation site. | |
| Apr 2015 | rewrite | 71 | U,E | Replaced onion domains with impersonation site. | |
| Mar 2015 | redirect | 24 | E | Redirected users to impersonated site. | |
| Feb 2015 | redirect | 17 | E | Redirected users to impersonated site. | |
| Jan 2015 | redirect | 26 | E | Redirected users to impersonated site. | |
| Botnet | Mar 2014 | default | — | N | Likely a Windows-powered botnet. The group features wide geographical distribution, which is uncommon for typical Tor relays. |
| Oct 2010 | trotsky | 649 | N | The relays were likely part of a botnet. They appeared gradually, and were all running Windows. | |
| Unknown | Jan 2016 | cloudvps | 61 | C,U | Hosted by Dutch hoster XL Internet Services. |
| Nov 2015 | 11BX1371 | 150 | C,U | All relays were in two /24 networks and a single relay had the Exit flag. | |
| Jul 2015 | DenkoNet | 58 | U | Hosted on Amazon AWS and only present in a single consensus. No relay had the Exit flag. | |
| Jul 2015 | cloudvps | 55 | C,U | All relays only had the Running and Valid flag. As their name suggests, the relays were hosted by the Dutch hoster “CloudVPS.” | |
| Dec 2014 | Anonpoke | 284 | C,U | The relays did not have the Exit flag and were removed from the network before they could get the HSDir flag. | |
| Dec 2014 | FuslVZTOR | 246 | C,U | The relays showed up only hours after the LizardNSA incident. | |
| DoS | Dec 2014 | LizardNSA | 4,615 | C,U | A group publicly claimed to be responsible for the attack [25]. All relays were hosted in the Google cloud and The Tor Project removed them within hours. |
| Research | May 2015 | fingerprints | 168 | F | All twelve IP addresses, located in the same /24, changed their fingerprint regularly, presumably in an attempt to manipulate the distributed hash table. |
| Mar 2014 | FDCservers | 264 | C,U | Relays that were involved in an experimental onion service deanonymization attack [8]. | |
| Feb 2013 | AmazonEC2 | 1,424 | F,C,U | We observed 1,424 relay fingerprints on 88 IP addresses. These Sybils were likely part of a research project [4]. | |
| Jun 2010 | planetlab | 595 | C,U | According to a report from The Tor Project [21], a researcher started these relays to learn more about scalability effects. |
The “rewrite” Sybils
These recurring Sybils hijacked Bitcoin transactions by rewriting Bitcoin addresses. All relays had the Exit flag and replaced onion domains found in a web server’s HTTP response with an impersonation domain, presumably hosted by the attacker. Interestingly, the impersonation domains shared a prefix with the original. For example, sigaintevyh2rzvw.onion was replaced with the impersonation domain sigaintz7qjj3val.onion whose first seven digits are identical to the original. The attacker could create shared prefixes by repeatedly generating key pairs until the hash over the public key resembled the desired prefix. Onion domains are generated by determining the SHA-1 hash over the public key, truncating it to its 80 most significant bits, and encoding it in Base32. Each Base32 digit of the 16-digit-domain represents five bits. Therefore, to get an -digit prefix in the onion domain, operations are required on average. For the seven-digit prefix above, this results in operations. The author of scallion [30], a tool for generating vanity onion domains, determined that an nVidia Quadro K2000M, a mid-range laptop GPU, is able to generate 90 million hashes per second. On this GPU, a partial collision for a seven-digit prefix can be found in seconds, i.e., just over three minutes.
We inspected some of the phishing domains and found that the attackers replaced the original Bitcoin addresses, presumably with addresses under their control, to hijack transactions. Therefore, we believe that this attack was financially motivated.
The “redirect” Sybils
These relays all had the Exit flag and tampered with HTTP redirects of exit traffic. Some Bitcoin sites would redirect users from their HTTP site to the encrypted HTTPS version, to protect their users’ login credentials. This Sybil group tampered with the redirect and directed users to an impersonation site, resembling the original Bitcoin site, perhaps to steal credentials. We only observed this attack for Bitcoin sites, but cannot rule out that other sites were not attacked.
Interestingly, the Sybils’ descriptors and consensus entries had less in common than other Sybil groups. They used a small set of different ports, Tor versions, bandwidth values, and their nicknames did not exhibit an easily-recognizable pattern. In fact, the only reason why we know that these Sybils belong together is because their attack was identical.
We discovered three Sybil groups that implemented the redirect attack, each of them beginning to surface when the previous one got blocked. The initial group first showed up in May 2014, with only two relays, but slowly grew over time, until it was finally discovered in January 2015. We believe that these Sybils were run by the same attacker because their attack was identical.
It is possible that this Sybil group was run by the same attackers that controlled the “rewrite” group but we have no evidence to support that hypothesis. Interestingly, only our exitmap module was able to spot these Sybils. The relays joined the network gradually over time and had little in common in their configuration, which is why our sybilhunter methods failed. In fact, we cannot rule out that the adversary was upstream, or gained control over these relays.
The “FDCservers” Sybils
These Sybils were used to deanonymize onion service users, as discussed by The Tor Project in a July 2014 blog post [8]. Supposedly, CMU/CERT researchers were executing a traffic confirmation attack by sending sequences of RELAY_EARLY and RELAY cells as a signal down the circuit to the client, which the reference implementation never does [8, 7]. The attacking relays were onion service directories and guards, allowing them to control both ends of the circuit for some Tor clients that were fetching onion service descriptors. Most relays were running FreeBSD, used Tor in version 0.2.4.18-rc, had identical flags, mostly identical bandwidth values, and were located in 50.7.0.0/16 and 204.45.0.0/16. All of these shared configuration options made the relays easy to identify.
The relays were added to the network in batches, presumably starting in October 2013. On January 30, 2014, the attackers added 58 relays to the 63 existing ones, giving them control over 121 relays. On July 8, 2014, The Tor Project blocked all 123 IP addresses that were running at the time.
The “default” Sybils
This group, named after the Sybils’ shared nickname “default,” has been around since September 2011 and consists of Windows-powered relays only. We extracted relays by filtering consensuses for the nickname “default,” onion routing port 443, and directory port 9030. The group features high IP address churn. For October 2015, we found “default” relays in 73 countries, with the top three countries being Germany (50%), Russia (8%), and Austria (7%). The majority of these relays, however, has little uptime. Figure 17 shows the uptime matrix for “default” relays in October 2015. Many relays exhibit a diurnal pattern, suggesting that they are powered off regularly—as it often is the case for desktop computers and laptops.
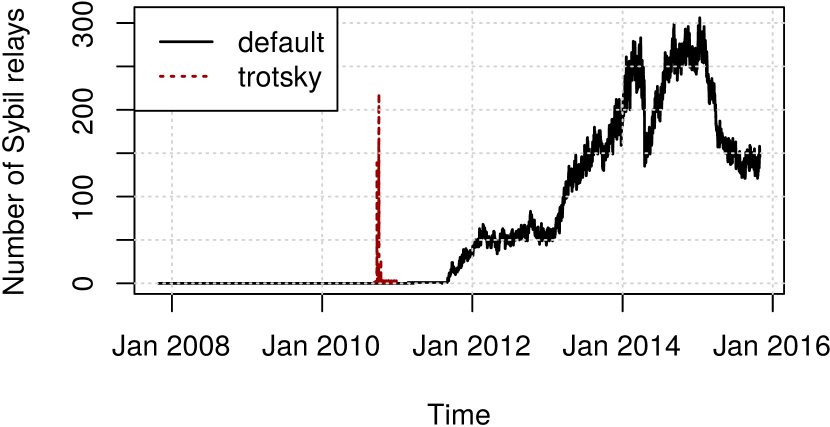
To get a better understanding of the number of “default” relays over time, we analyzed all consensuses, extracting the number of relays whose nickname was “default,” whose onion routing port was 443, and whose directory port was 9001. We did this for the first consensus every day and plot the result in Figure 7. Note that we might overestimate the numbers as our filter could capture unrelated relays.
The above suggests that some of the “default” relays are running without the owner’s knowledge. While the relays do not fit the pattern of Sefnit (a.k.a. Mevade) [27] and Skynet [28]—two pieces of malware that use an onion service as command and control server—we believe that the “default” relays constitute a botnet.
The “trotsky” Sybils
Similar to the “default” group, the “trotsky” relays appear to be part of a botnet. Most of the relays’ IP addresses were located in Eastern Europe, in particular in Slovenia, Croatia, and Bosnia and Herzegovina. The relays were all running on Windows, in version 0.2.1.26, and listening on port 443. Most of the relays were configured as exits, and The Tor Project assigned some of them the BadExit flag.
The first “trotsky” members appeared in September 2010. Over time, there were two relay peaks, reaching 139 (September 23) and 219 (October 3) relays, as illustrated in Figure 7. After that, only 1–3 relays remained in the consensus.
The “Amazon EC2” Sybils
The relays all used randomly-generated nicknames, consisting of sixteen or seventeen letters and numbers; Tor in version 0.2.2.37; GNU/Linux; and IP addresses in Amazon’s EC2 netblock. Each of the 88 IP addresses changed its fingerprint 24 times, but not randomly: the fingerprints were chosen systematically, in a small range. For example, relay 54.242.248.129 had fingerprints with the prefixes 8D, 8E, 8F, and 90. The relays were online for 48 hours. After 24 hours, most of the relays obtained the HSDir flag.
We believe that this Sybil group was run by Biryukov, Pustogarov, and Weinmann as part of their Security and Privacy 2013 paper “Trawling for Tor Hidden Services” [4]—one of the few Sybil groups that were likely run by academic researchers.
The “FuslVZTOR” Sybils
All machines were middle relays and hosted in 212.38.181.0/24, which is owned by a UK VPS provider. The directory authorities started rejecting the relays five hours after they joined the network. The relays advertized the default bandwidth of 1 GiB/s and used randomly determined ports. The Sybils were active in parallel to the “LizardNSA” attack, but there is no reason to believe that both incidents were related.
The “Anonpoke” Sybils
All relays shared the nickname “Anonpoke” and were online for four hours until they were rejected. All relays were hosted by a VPS provider in the U.S., Rackspace, with the curious exception of a single relay that was hosted in the UK, and running a different Tor version. The relays advertized the default bandwidth of 1 GiB/s on port 9001 and 9030. All relays were middle relays and running as directory mirror. All Sybils were configured to be an onion service directory, but did not manage to get the flag in time.
The “PlanetLab” Sybils
A set of relays that used a variation of the strings “planet”, “plab”, “pl”, and “planetlab” as their nickname. The relays’ exit policy allowed ports 6660–6667, but they did not get the Exit flag. The Sybils were online for three days and then removed by The Tor Project, as mentioned in a blog post [21]. The blog post further says that the relays were run by a researcher to learn more about “cloud computing and scaling effects.”
The “LizardNSA” Sybils
All relays were hosted in the Google Cloud and only online for ten hours, until the directory authorities started to reject them. The majority of machines were middle relays (96%), but the attackers also started some exit relays (4%). The Sybils were set up to be onion service directories, but the relays were taken offline before they could earn the HSDir flag. If all relays would have obtained the HSDir flag in time, they would have constituted almost 50% of all onion service directories; the median number of onion service directories on December 26 was 3,551.
Shortly after the attack began, somebody claimed responsibility on the tor-talk mailing list [25]. Judging by the supposed attacker’s demeanor, the attack was mere mischief.
5.2 Churn rate analysis
We determined the churn rate between two subsequent consensuses for all 72,061 consensuses that were published between October 2007 and January 2016. Considering that (i) there are 162 gaps in the archived data, that (ii) we create time series for joining and leaving relays, and that (iii) we determined churn values for all twelve relay flags, we ended up with churn values. Figure 8 shows a box plot for the churn distribution (joining and leaving churn values concatenated) for the seven most relevant relay flags. We removed values greater than the plot whiskers (which extend to values times the interquartile range from the box) to better visualize the width of the distributions. Unsurprisingly, relays with the Guard, HSDir, and Stable flag experience the least churn, probably because relays are only awarded these flags if they are particularly stable. Exit relays have the most churn, which is surprising given that exit relays are particularly sensitive to operate. Interestingly, the median churn rate of the network has steadily decreased over the years, from in 2008 to in 2015.
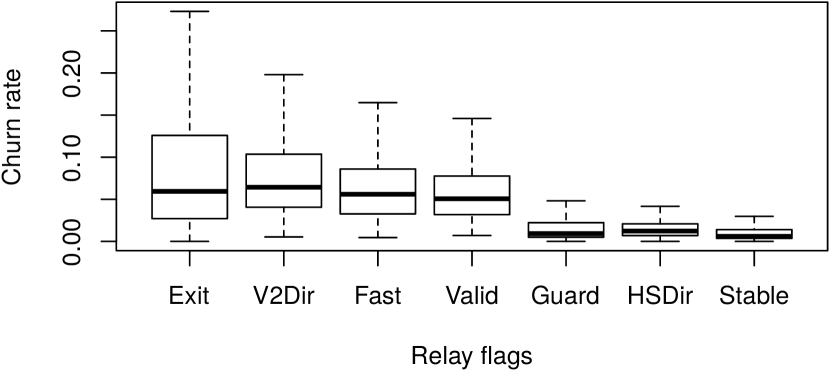
Figure 9 illustrates churn rates for five days in August 2008, featuring the most significant anomaly in our data. On August 19, 822 relays left the network, resulting in a sudden spike, and an increase in the baseline. The spike was caused by the Tor network’s switch from consensus format version three to four. The changelog says that in version four, routers that do not have the Running flag are no longer listed in the consensus.
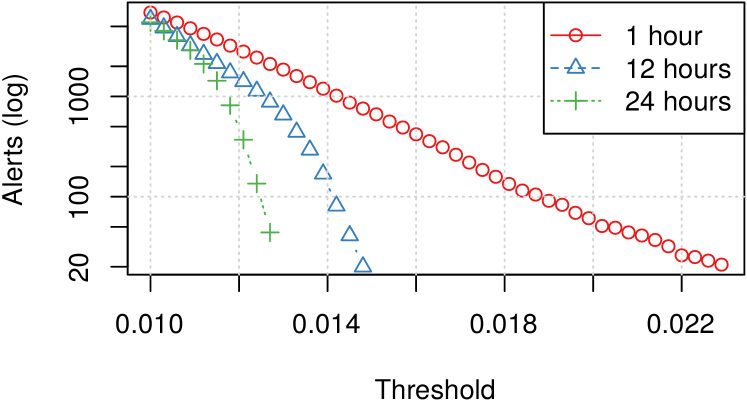
To alleviate the choice of a detection threshold, we plot the number of alerts (in log scale) in 2015 as the threshold increases. We calculate these numbers for four simple moving average window sizes. The result is shown in Figure 10. Depending on the window size, thresholds greater than 0.012 seem practical considering that 181 alerts per year average to approximately one alert in two days—a tolerable number of incidents to investigate. Unfortunately, we are unable to determine the false positive rate because we do not have ground truth.
5.3 Uptime analysis
We generated relay uptime visualizations for each month since 2007, resulting in 100 images. We now discuss a subset of these images that contain particularly interesting patterns.
Figure 11 shows June 2010, featuring a clear “Sybil block” on the left side. The Sybils belonged to a researcher who, as documented by The Tor Project [21], started several hundred Tor relays on PlanetLab for research on scalability. Our manual analysis could verify this. The relays were easy to identify because their nicknames suggested that they were hosted on PlanetLab, containing strings such as “planetlab,” “planet,” and “plab.” Note the small height of the Sybil block, indicating that the relays were only online for a short time.
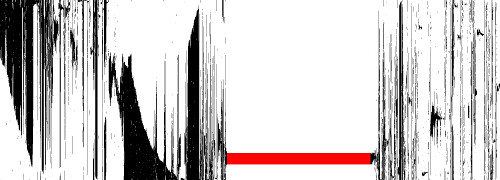
Figure 12 features a curious “step pattern” for approximately 100 relays, all of which were located in Russia and Germany. The relays appeared in December 2011, and started exhibiting the diurnal step pattern (nine hours uptime followed by fifteen hours downtime) in March 2012. All relays had similar nicknames, consisting of eight seemingly randomly-generated characters. In April 2013, the relays finally disappeared.

Figure 13 shows the effect of the Heartbleed incident [12] on the Tor network. Several days after the incident, The Tor Project decided to block all relays that had not generated new key pairs. The large red rectangle on the left side of the image illustrates when the biggest part of the block became active, rejecting approximately 1,700 Tor relay fingerprints.

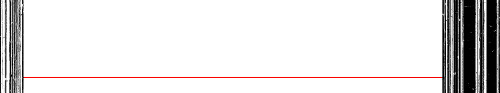
Figure 14 illustrates the largest Sybil group to date, comprising 4,615 Tor relays that an attacker started in the Google cloud in December 2014. Because of its magnitude, the attack was spotted almost instantly, and The Tor Project removed the offending relays only ten hours after they appeared.
5.4 Fingerprint anomalies
We determined how often all Tor relays changed their fingerprint from 2007 to 2015. Figure 15 illustrates the number of fingerprints ( axis) we have observed for the 1,000 Tor relays ( axis) that changed their fingerprint the most. All these relays changed their fingerprint at least ten times. Twenty one relays changed their fingerprint more than 100 times, and the relay at the very right end of the distribution changed its fingerprint 936 times. This relay’s nickname was “openwrt,” suggesting that it was a home router that was rebooted regularly. It was running from August 2010 to December 2010.
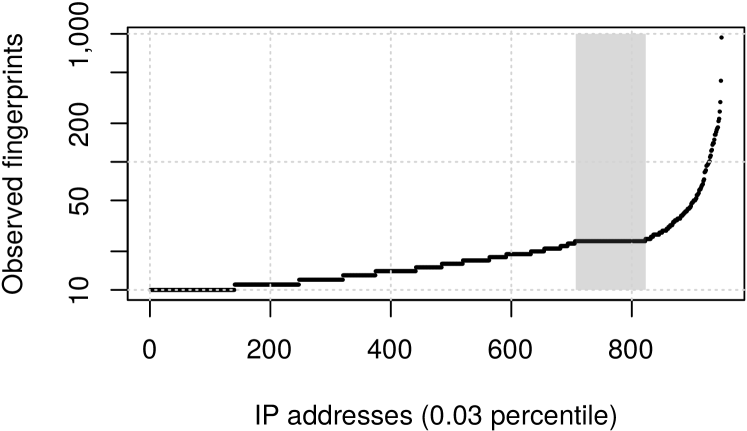
Figure 15 further contains a peculiar plateau, shown in the shaded area between index 707 and 803. This plateau was caused by a group of Sybils, hosted in Amazon EC2, that changed their fingerprint exactly 24 times. Upon inspection, we noticed that this was likely an experiment for a Security and Privacy 2013 paper on deanonymizing Tor onion services [4].
We also found that many IP addresses in the range 199.254.238.0/24 changed their fingerprint frequently. We contacted the owner of the address block and were told that the block used to host VPN services. Apparently, several people started Tor relays and since the VPN service would not assign permanent IP addresses, the Tor relays would periodically change their address, causing the churn we observe.
5.5 Accuracy of nearest-neighbor search
Given a single Sybil relay, how good is our nearest-neighbor search at finding the remaining Sybils? To answer this question, we now evaluate our algorithm’s accuracy, which we define as the fraction of neighbors it correctly labels as Sybils. For example, if eight out of ten Sybils are correctly labeled as neighbors, the accuracy is 0.8.
A sound evaluation requires ground truth, i.e., relays that are known to be Sybils. All we have, however, are relays that we believe to be Sybils. In addition, the number of Sybils we found is only a lower bound—we are unlikely to have detected all Sybil groups. Therefore, our evaluation is doomed to overestimate our algorithm’s accuracy because we are unable to test it on the Sybils we did not discover.
We evaluate our search algorithm on two datasets; the “bad exit” Sybil groups from Table 4, and relay families. We chose the bad exit Sybils because we observed them running identical, active attacks, which makes us confident that they are in fact Sybils. Recall that a relay family is a set of Tor relays that is controlled by a single operator, but configured to express this mutual relationship in the family members’ configuration file. Relay families are benign Sybils. As of January 2016, approximately 400 families populate the Tor network, ranging in size from only two to 25 relays.
We evaluate our algorithm by finding the nearest neighbors of a family member. Ideally, all neighbors are family members, but the use of relay families as ground truth is very likely to overestimate results because family operators frequently configure their relays identically on purpose. At the time of this writing, a popular relay family has the nicknames “AccessNow000” to “AccessNow009,” adjacent IP addresses, and identical contact information—perfect prerequisites for our algorithm. We expect the operators of malicious Sybils, however, to go out of their way to obscure the relationship between their relays.
To determine our algorithm’s accuracy, we used all relay families that were present in the first consensus that was published in October 2015. For each relay that had at least one mutual family relationship, we searched for its nearest neighbors where is the family size. Basically, we evaluated how good our algorithm is at finding the relatives of a family member. We determined the accuracy—a value in —for each family member. The result is shown in Figure 16(b), a distribution of accuracy values.
Next, we repeated the evaluation with the bad exit Sybil groups from Table 4. Again, we searched for the nearest neighbors of all bad exit relays, where is the size of the Sybil group. The accuracy is the fraction of relays that our algorithm correctly classified as neighbor. The result is illustrated in Figure 16(a).
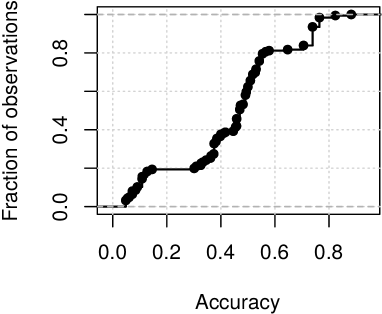
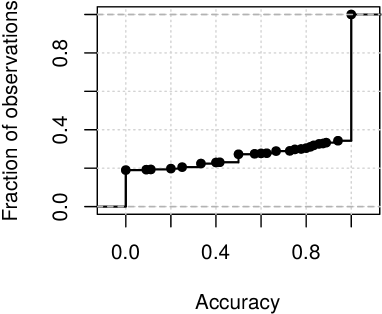
As expected, our algorithm is significantly more accurate for the family dataset—66% of searches had perfect accuracy. The bad exit dataset, however, did worse. Not a single search had perfect accuracy and 59% of all searches had an accuracy in the interval . Nevertheless, we find that our search algorithm facilitates manual analysis given how quickly it can provide us with a list of the most similar relays. Besides, false positives (i.e., neighbors that are not Sybils) are cheap as sybilhunter users would not spend much time on neighbors that bear little resemblance to the “seed” relay.
5.6 Computational cost
Fast techniques lend themselves to being run hourly, for every new consensus, while slower ones must be run less frequent. Table 3 gives an overview of the runtime of our methods.555We determined all performance numbers on an Intel Core i7-3520M CPU at 2.9 GHz, a consumer-grade CPU. We stored our datasets on a solid state drive to eliminate I/O as performance bottleneck.
| Method | Analysis window | Run time |
|---|---|---|
| Churn | Two consensuses | 0.16s |
| Neighbor search | One consensus | 1.6s |
| Fingerprint | One month | 58s |
| Uptimes | One month | 145s |
The table columns contain, from left to right, our analysis technique, the technique’s analysis window, and how long it takes to compute its output. Network churn calculation is very fast; it takes as input only two consensus files and can easily be run for every new network consensus. Nearest-neighbor search takes approximately 1.6 seconds for a single consensus counting 6,942 relays. Fingerprint and uptime analysis for one month worth of consensuses takes approximately one and two minutes, respectively—easy to invoke daily, or even several times a day.
6 Discussion
After having used sybilhunter in practice for several months, we elaborate on both our operational experience and the shortcomings we encountered.
6.1 Operational experience
Our practical work with sybilhunter taught us that detecting Sybils frequently requires manual work; for example, comparing a new Sybil group with a previously disclosed one, sending decoy traffic over Sybils, or sorting and comparing information in their descriptors. It is difficult to predict all kinds of manual analyses that might be necessary in the future, which is why we designed sybilhunter to be highly interoperable with Unix command line tools [29]. Its CSV-formatted output can easily be piped into tools such as sed, awk, and grep. We found that compact text output was significantly easier to process, both for plotting results and for manual analysis. We also found that sybilhunter can serve as valuable tool to better understand the Tor network and monitor its reliability. Our techniques can disclose network consensus issues and illustrate the wide diversity of Tor relays, providing empirical data that can support future network design decisions.
We are also working with The Tor Project on incorporating our techniques in Tor Metrics [33], a web site that contains network visualizations, which are frequented by numerous volunteers that sometimes report anomalies. By incorporating our techniques, we hope to benefit from “crowd-sourced” Sybil detection.
6.2 Limitations
In Section 4.2 we argued that we are unable to prevent all Sybil attacks. An adversary unconstrained by time and money can add an unlimited number of Sybils to the network. Indeed, Table 2 contains six Sybil groups that sybilhunter was unable to detect. Exitmap, however, was able to expose these Sybils, which emphasizes the importance of having diverse and complementary analysis techniques to raise the bar for adversaries. By characterizing past attacks and documenting the evolution of recurring attacks, we can adapt our techniques, allowing for the bar to be raised even further. However, this arms race is unlikely to end, barring fundamental changes in how Tor relays are operated. Given that attackers can stay under our radar, our results represent a lower bound because we might have missed Sybil groups.
Finally, sybilhunter is unable to ascertain the purpose of a Sybil attack. While the purpose is frequently obvious, Table 2 contains several Sybil groups that we could not classify. In such cases, it is difficult for The Tor Project to make a call and decide if Sybils should be removed from the network. Keeping them runs the risk of exposing users to an unknown attack, but removing them deprives the network of bandwidth. Often, additional context is helpful in making a call. For example, Sybils that are (i) operated in “bulletproof” ASes [19], (ii) show signs of not running the Tor reference implementation, or (iii) spoof information in their router descriptor all suggest malicious intent. In the end, Sybil groups have to be evaluated case by case, and the advantages and disadvantages of blocking them have to be considered.
7 Conclusion
We presented sybilhunter, a novel system that uses diverse analysis techniques to expose Sybils in the Tor network. Equipped with this tool, we set out to analyze nine years of The Tor Project’s archived network data. We discovered numerous Sybil groups, twenty of which we present in this work. By analyzing these Sybil groups sybilhunter discovered, we found that (i) Sybil relays are frequently configured very similarly, and join and leave the network simultaneously; (ii) attackers differ greatly in their technical sophistication; and (iii) our techniques are not only useful for spotting Sybils, but turn out to be a handy analytics tool to monitor and better understand the Tor network. Given the lack of a central identity-verifying authority, it is always possible for well-executed Sybil attacks to stay under our radar, but we found that a complementary set of techniques can go a long way towards finding malicious Sybils, making the Tor network more secure and trustworthy for its users.
Both code and data for this work are available online at https://nymity.ch/sybilhunting/.
Acknowledgments
This research was supported in part by the Center for Information Technology Policy at Princeton University. We want to thank Stefan Lindskog and the Tor developers for helpful feedback.
References
- [1] David G. Andersen, Nick Feamster, Steve Bauer and Hari Balakrishnan “Topology Inference from BGP Routing Dynamics” In Internet Measurement Workshop ACM, 2002 URL: https://nymity.ch/sybilhunting/pdf/Andersen2002a.pdf
- [2] Kevin Bauer and Damon McCoy “No more than one server per IP address”, 2007 URL: https://gitweb.torproject.org/torspec.git/tree/proposals/109-no-sharing-ips.txt
- [3] Kevin Bauer et al. “Low-Resource Routing Attacks Against Tor” In Workshop on Privacy in the Electronic Society ACM, 2007 URL: https://nymity.ch/sybilhunting/pdf/Bauer2007a.pdf
- [4] Alex Biryukov, Ivan Pustogarov and Ralf-Philipp Weinmann “Trawling for Tor Hidden Services: Detection, Measurement, Deanonymization” In Security & Privacy IEEE, 2013 URL: https://nymity.ch/sybilhunting/pdf/Biryukov2013a.pdf
- [5] Nikita Borisov “Computational Puzzles as Sybil Defenses” In Peer-to-Peer Computing IEEE, 2005 URL: https://nymity.ch/sybilhunting/pdf/Borisov2006a.pdf
- [6] George Danezis and Prateek Mittal “SybilInfer: Detecting Sybil Nodes using Social Networks” In Network and Distributed System Security The Internet Society, 2009 URL: https://nymity.ch/sybilhunting/pdf/Danezis2009a.pdf
- [7] Roger Dingledine “Did the FBI Pay a University to Attack Tor Users?”, 2015 URL: https://blog.torproject.org/blog/did-fbi-pay-university-attack-tor-users
- [8] Roger Dingledine “Tor security advisory: “relay early” traffic confirmation attack”, 2014 URL: https://blog.torproject.org/blog/tor-security-advisory-relay-early-traffic-confirmation-attack
- [9] Roger Dingledine and Nick Mathewson “Tor Path Specification” URL: https://gitweb.torproject.org/torspec.git/tree/path-spec.txt
- [10] Roger Dingledine, Nick Mathewson and Paul Syverson “Tor: The Second-Generation Onion Router” In USENIX Security USENIX, 2004 URL: https://nymity.ch/sybilhunting/pdf/Dingledine2004a.pdf
- [11] John R. Douceur “The Sybil Attack” In Peer-to-Peer Systems, 2002 URL: https://nymity.ch/sybilhunting/pdf/Douceur2002a.pdf
- [12] Zakir Durumeric et al. “The Matter of Heartbleed” In Internet Measurement Conference ACM, 2014 URL: https://nymity.ch/sybilhunting/pdf/Durumeric2014a.pdf
- [13] David Fifield “#12813—Look at a bitmap visualization of relay consensus”, 2014 URL: https://bugs.torproject.org/12813
- [14] P. Brighten Godfrey, Scott Shenker and Ion Stoica “Minimizing Churn in Distributed Systems” In SIGCOMM ACM, 2006 URL: https://nymity.ch/sybilhunting/pdf/Godfrey2006a.pdf
- [15] Aaron Johnson et al. “Users Get Routed: Traffic Correlation on Tor by Realistic Adversaries” In Computer and Communications Security ACM, 2013 URL: https://nymity.ch/sybilhunting/pdf/Johnson2013a.pdf
- [16] Damian Johnson “doctor – service that periodically checks the Tor network for consensus conflicts and other hiccups” URL: https://gitweb.torproject.org/doctor.git/tree/
- [17] Damian Johnson “Stem Docs” URL: https://stem.torproject.org
- [18] Marc Juarez et al. “A Critical Evaluation of Website Fingerprinting Attacks” In Computer and Communications Security ACM, 2014 URL: https://nymity.ch/sybilhunting/pdf/Juarez2014a.pdf
- [19] Maria Konte, Roberto Perdisci and Nick Feamster “ASwatch: An AS Reputation System to Expose Bulletproof Hosting ASes” In SIGCOMM ACM, 2015 URL: https://nymity.ch/sybilhunting/pdf/Konte2015a.pdf
- [20] Brian Neil Levine, Clay Shields and N. Boris Margolin “A Survey of Solutions to the Sybil Attack”, 2006 URL: https://nymity.ch/sybilhunting/pdf/Levine2006a.pdf
- [21] Andrew Lewman “June 2010 Progress Report”, 2010 URL: https://blog.torproject.org/blog/june-2010-progress-report
- [22] Frank Li, Prateek Mittal, Matthew Caesar and Nikita Borisov “SybilControl: Practical Sybil Defense with Computational Puzzles” In Scalable Trusted Computing ACM, 2012 URL: https://nymity.ch/sybilhunting/pdf/Li2012a.pdf
- [23] Zhen Ling et al. “Tor Bridge Discovery: Extensive Analysis and Large-scale Empirical Evaluation” In IEEE Transactions on Parallel and Distributed Systems 26.7, 2015 URL: https://nymity.ch/sybilhunting/pdf/Ling2015b.pdf
- [24] Zhen Ling et al. “TorWard: Discovery, Blocking, and Traceback of Malicious Traffic Over Tor” In IEEE Transactions on Information Forensics and Security 10.12, 2015 URL: https://nymity.ch/sybilhunting/pdf/Ling2015a.pdf
- [25] “Lizards”, 2014 URL: https://lists.torproject.org/pipermail/tor-talk/2014-December/036197.html
- [26] Moxie Marlinspike “sslstrip” URL: http://www.thoughtcrime.org/software/sslstrip/
- [27] msft-mmpc “Tackling the Sefnit botnet Tor hazard”, 2014 URL: http://blogs.technet.com/b/mmpc/archive/2014/01/09/tackling-the-sefnit-botnet-tor-hazard.aspx
- [28] nex “Skynet, a Tor-powered botnet straight from Reddit”, 2012 URL: https://community.rapid7.com/community/infosec/blog/2012/12/06/skynet-a-tor-powered-botnet-straight-from-reddit
- [29] Rob Pike and Brian W. Kernighan “Program Design in the UNIX System Environment” In Bell Labs Technical Journal 63.8, 1983 URL: https://nymity.ch/sybilhunting/pdf/Pike1983a.pdf
- [30] Eric Swanson “GPU-based Onion Hash generator” URL: https://github.com/lachesis/scallion
- [31] “The Invisible Internet Project” URL: https://geti2p.net
- [32] The Tor Project “CollecTor – Your friendly data-collecting service in the Tor network” URL: https://collector.torproject.org/
- [33] The Tor Project “Tor Metrics” URL: https://metrics.torproject.org
- [34] Kurt Thomas, Chris Grier and Vern Paxson “Adapting Social Spam Infrastructure for Political Censorship” In Large-Scale Exploits and Emergent Threats USENIX, 2012 URL: https://nymity.ch/sybilhunting/pdf/Thomas2012a.pdf
- [35] Liang Wang and Jussi Kangasharju “Real-World Sybil Attacks in BitTorrent Mainline DHT” In Globecom IEEE, 2012 URL: https://nymity.ch/sybilhunting/pdf/Wang2012a.pdf
- [36] Philipp Winter “zoossh—Parsing library for Tor-specific data formats” URL: https://gitweb.torproject.org/user/phw/zoossh.git/
- [37] Philipp Winter et al. “Spoiled Onions: Exposing Malicious Tor Exit Relays” In Privacy Enhancing Technologies Symposium Springer, 2014 URL: https://nymity.ch/sybilhunting/pdf/Winter2014a.pdf
- [38] Haifeng Yu, Phillip B. Gibbons Michael Kaminsky and Feng Xiao “SybilLimit: A Near-Optimal Social Network Defense against Sybil Attacks” In Security & Privacy IEEE, 2008 URL: https://nymity.ch/sybilhunting/pdf/Yu2008a.pdf
- [39] Haifeng Yu, Michael Kaminsky, Phillip B. Gibbons and Abraham Flaxman “SybilGuard: Defending Against Sybil Attack via Social Networks” In SIGCOMM ACM, 2006 URL: https://nymity.ch/sybilhunting/pdf/Yu2006a.pdf
Appendix A Exposed malicious exit relays
Table 4 provides an overview of our second dataset, 251 bad exit relays that we discovered between August 2014 and January 2016. We believe that all single relays in the dataset were isolated incidents while sets of relays constituted Sybil groups. Sybil groups marked with the symbols , , and were run by the same attacker.
| Discovery | # of relays | Attack description |
|---|---|---|
| Aug 2014 | 1 | The relay injected JavaScript into returned HTML. The script embedded another script from the domain fluxx.crazytall.com—not clearly malicious, but suspicious. |
| Aug 2014 | 1 | The relay injected JavaScript into returned HTML. The script embedded two other scripts, jquery.js from the official jQuery domain, and clr.js from adobe.flashdst.com. Again, this was not necessarily malicious, but suspicious. |
| Sep 2014 | 1 | The exit relay routed traffic back into the Tor network, i.e., we observed traffic that was supposed to exit from relay , but came from relay . The system presented by Ling et al. behaves the same [24]; the authors proposed to run intrusion detection systems on Tor traffic by setting up an exit relay that runs an NIDS system, and routes the traffic back into the Tor network after having inspected the traffic. |
| Oct 2014 | 1 | The relay injected JavaScript into returned HTML. |
| Oct 2014 | 1 | The relay ran the MitM tool sslstrip [26], rewriting HTTPS links to unencrypted HTTP links in returned HTML. |
| Oct 2014 | 1 | Same as above. |
| Jan 2015 | 23 | Blockchain.info’s web server redirects its users from HTTP to HTTPS. These relays tampered with blockchain.info’s redirect and returned unprotected HTTP instead—presumably to sniff login credentials. |
| Jan 2015 | 1 | The relay used OpenDNS as DNS resolver and had the web site category “proxy/anonymizer” blocked, resulting in several inaccessible web sites, including torproject.org. |
| Feb 2015 | 1 | The relay injected a script that attempted to load a resource from the now inaccessible torclick.net. Curiously, torclick.net’s front page said “We place your advertising materials on all websites online. Your ads will be seen only for anonymous network TOR [sic] users. Now it is about 3 million users. The number of users is always growing.” |
| Feb 2015 | 17 | Again, these relays tampered with HTTP redirects of Bitcoin web sites. Interestingly, the attack became more sophisticated; these relays would only target connections whose HTTP headers resembled Tor Browser. |
| Mar 2015 | 18 | Same as above. |
| Mar 2015 | 1 | The relay injected JavaScript and an iframe into the returned HTML. The injected content was not clearly malicious, but suspicious. |
| Apr 2015 | 70 | These exit relays transparently rewrote onion domains in returned HTML to an impersonation domain. The impersonation domain looked identical to the original, but had different Bitcoin addresses. We believe that this was attempt to trick Tor users into sending Bitcoin transactions to phishing addresses. |
| Jun 2015 | 55 | Same as above. |
| Aug 2015 | 4 | Same as above. |
| Sep 2015 | 1 | The relay injected an iframe into returned HTML that would load content that made the user’s browser participate in some kind of mining activity. |
| Nov 2015 | 1 | The relay ran the MitM tool sslstrip. |
| Nov 2015 | 8 | Same as the relays marked with a . |
| Dec 2015 | 1 | The relay ran the MitM tool sslstrip. |
| Dec 2015 | 1 | Same as above. |
| Jan 2016 | 43 | Same as the relays marked with a . |
Appendix B Supporting diagrams
Figure 17 shows the uptime matrix for the “default” Sybil group for October 2015. Matrix rows represent consensuses and columns represent relays. As a result, a single pixel shows if a given relay was online (black pixel) or offline (white pixel) in a given consensus. The matrix shows that many relays exhibit a diurnal uptime pattern.