The bandmerged Planck Early Release Compact Source Catalogue: Probing sub-structure in the molecular gas at high Galactic latitude
Abstract
The Planck Early Release Compact Source Catalogue (ERCSC) includes nine lists of highly reliable sources, individually extracted at each of the nine Planck frequency channels. To facilitate the study of the Planck sources, especially their spectral behaviour across the radio/infrared frequencies, we provide a “bandmerged” catalogue of the ERCSC sources. This catalogue consists of 15191 entries, with 79 sources detected in all nine frequency channels of Planck and 6818 sources detected in only one channel. We describe the bandmerging algorithm, including the various steps used to disentangle sources in confused regions. The multi-frequency matching allows us to develop spectral energy distributions of sources between 30 and 857 GHz, in particular across the 100 GHz band, where the energetically important CO =10 line enters the Planck bandpass. We find evidence for contribution to the 100 GHz intensity from foreground CO along the line of sight to 147 sources with . The median excess contribution is 4.50.9% of their measured 100 GHz flux density which cannot be explained by calibration or beam uncertainties. This translates to 0.50.1 K km s-1 of CO which must be clumped on the scale of the Planck 100 GHz beam, i.e., 10. If this is due to a population of low mass (15 M☉) molecular gas clumps, the total mass in these clumps may be more than 2000 M☉. Further, high-spatial-resolution, ground-based observations of the high-latitude sky will help shed light on the origin of this diffuse, clumpy CO emission.
keywords:
surveys: radio sources – radio continuum: galaxies – radiation mechanisms: general1 Introduction
From 2009 August to 2012 January, the Planck111Planck (http://www.esa.int/Planck) is a project of the European Space Agency (ESA) with instruments provided by two scientific consortia funded by ESA member states (in particular the lead countries France and Italy), with contributions from NASA (USA) and telescope reflectors provided by a collaboration between ESA and a scientific consortium led and funded by Denmark. satellite carried out high sensitivity all-sky surveys at nine frequencies from 30 to 857 GHz, with beam sizes ranging from about 33 to 4.2 arcmin (Planck Collaboration I, 2011). The Planck Early Release Compact Source Catalogue (Planck Collaboration VII, 2011) lists sources detected in the first 1.6 full-sky survey maps, and offers a unique opportunity for studying these sources, both Galactic and extragalactic, in a previously under-explored frequency domain. The ERCSC was released on 2011 January 11, and is available from both the ESA Planck Legacy Archive222http://www.cosmos.esa.int/web/planck/pla and the NASA Planck Archive.333http://irsa.ipac.caltech.edu/Missions/planck.html
In the ERCSC, source detection and characterization were done independently in each Planck band yielding source lists at each frequency. The minimum S/N in the compact source kernel filtered individual frequency maps is 5. In addition, since the primary goal of the ERCSC was % reliability, a Monte-Carlo algorithm based on the injection and extraction of artificial sources into the Planck maps was implemented to select reliable sources among all extracted 5 candidates such that the cumulative reliability of the catalogue is 90%. The reliability was defined as the signal to noise where that the extracted flux density of the extracted artificial sources would agree with the input flux density to better than 30%. Thus, if a source fell on top of a bright cirrus feature such that its flux density was biased by more than 30%, it would be ignored. Since Galactic cirrus emission is the dominant contaminant at the higher frequencies, and cirrus emission is patchy, the completeness at a particular flux density can be high in clean patches of sky but low in regions where the ISM emission is strong. The reliability cuts are applied per band with a full description of the process provided in Planck Collaboration VII (2011). Here, we merged the catalogs per band after these cuts; so whether or not a source is a multiband source is not known until after the bandmerging process.
While the source lists in individual bands are important in characterizing the statistical properties of source populations at each frequency (Planck Collaboration XIII, 2011; Planck Collaboration Int. VII, 2013), the multi-frequency power of Planck can only be fully exploited when the sources detected in each band are associated. A suite of Planck Early Results papers have already shown the power of multifrequency SED in finding gigahertz peaked spectrum (GPS) sources (Planck Collaboration XIV, 2011), identifying anomalous microwave emission regions and associating the emission with spinning dust (Planck Collaboration XX, 2011), and studying the synchrotron break frequencies of blazars (Planck Collaboration XV, 2011). To better facilitate the study of spectral properties of the Planck sources by the scientific community, we have attempted to find associations between the sources detected at different frequencies in the ERCSC, a process known as “bandmerging.”
In Section 2 we describe the bandmerge algorithm, with emphasis on confusion processing. In Section 3 we present the bandmerged catalogue and discuss the spectral energy distributions of the sources. In Section 4 we use the bandmerged catalogue to estimate the flux-density excess due to CO contamination in the Planck 100 GHz channel and use this information to assess the CO intensity at high Galactic latitudes. Section 5 presents our conclusions.
2 Bandmerge Algorithm
Following Fowler (2003), we designed an algorithm that suits the specific needs of the ERCSC. The main challenges we face in the merging process are: (1) different resolution across the bands, which leads to source confusion; and (2) the broad frequency coverage, which induces complications due to the interstellar medium (ISM) emission and the transition from frequencies where the synchrotron and free-free emission dominate to where the thermal dust emission becomes significant.
2.1 Cross-band matching
We begin by selecting a source in one Planck band (the “seed” band), and searching all the other eight bands (the “candidate” bands) for counterparts. The matching radius is always chosen to be half of the full width at half maximum (FWHM) of the larger of the two beams between the seed and candidate bands. Table 1 provides the frequency and beam width of each of the Planck bands. Planck is not a diffraction-limited telescope and the resolution is limited by the scan rate, the sparse focal plane and under-illumination of the primary; therefore the resolution at the upper frequencies is nearly the same. Since the upper four bands have very similar angular resolutions, we adopted 5 arcmin as the uniform beam size for these four bands in the matching process. We link a source in the candidate band to the seed source when the positional offset between them is less than the matching radius. The positional accuracy of the ERCSC sources is estimated to be better than 1/5 of the FWHM at each band (Planck Collaboration VII, 2011). Therefore our choice of the matching radius reflects a balance between including the correct counterparts of our seed source in the candidate bands, and excluding close but unrelated neighbours at the same time. To avoid biasing towards or against any class of astrophysical sources, we do not use any brightness information at this step. Whether a detection in the candidate band is an acceptable match to the seed source is decided exclusively on the basis of position.
| LFI | HFI | ||||||||||
|---|---|---|---|---|---|---|---|---|---|---|---|
| Planck Band [GHz] | 30 | 44 | 70 | 100 | 143 | 217 | 353 | 545 | 857 | ||
| Band Pass [, GHz] | 6 | 9 | 14 | 32.9 | 45.8 | 64.5 | 101.4 | 171.3 | 245.9 | ||
| Beam FWHM [arcmin] | 32.65 | 27.00 | 13.01 | 9.94 | 7.04 | 4.66 | 4.41 | 4.47 | 4.23 | ||
| (adopted valuea) | 5.00 | 5.00 | 5.00 | 5.00 | |||||||
a The upper four bands have similar angular resolutions, we therefore adopted 5 arcmin as the uniform beam size for these four bands in the bandmerging process.
Each of the nine Planck bands is used as seed band once. For each source in the seed band, we save the total number of acceptable matches (i.e., those with positional offsets less than the matching radius) in each candidate band to quantify the seriousness of the confusion at that frequency. However, we only save pointers to up to three qualifying matches per candidate band, arranged in ascending order of the distance to the seed source. This choice was somewhat arbitrary, although we later found that the maximum number of acceptable matches per candidate band for each seed source in our analysis is actually three.
2.2 Confusion Processing
Ideally, after the cross-band matching, for each given source in a band, there would be at most one pointer to a counterpart in another band, with the counterpart having only one pointer pointing back to the given source. In addition, every source in a single merged chain should point to the others. This is indeed the most common case. However, in regions of high source density (typically at low Galactic latitudes), sources that are separated by less than the matching radius often get erroneously cross-associated with each other. We describe below the four different types of confusion cases we encountered in the ERCSC bandmerging process and our solutions.
2.2.1 Inconsistent chain
“Inconsistent chain” refers to the situation where a given seed source’s first-choice counterpart in a candidate band does not have a reciprocal first-choice pointer back to the given source. A model of an inconsistent chain is given in Figure 1, where source S1 in band B1 finds source S2 as the preferred match (i.e., closest neighbour) in band B2. However, when source S2 is used as the seed source, it finds source S3 in band B1 is a better match, i.e., closer to source S2. In the lower part of Figure 1, we show a real example of inconsistent chain in our bandmerging process. When we use 100 GHz as the seed band and 30 GHz as the candidate band, source PLCKERC100 G291.2700.71 finds PLCKERC030 G291.4700.62 as the closest match. However, when the 30 GHz band is used as seed band, the same 30 GHz source finds PLCKERC100 G291.6000.52 as the closest match in the 100 GHz band.

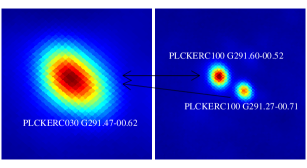
To solve inconsistent chains, we loop over all source records, and check that the preferred pointers are symmetric under interchange of seed and candidate sources. If not, we follow the chain of pointers until a reciprocal relation is found, and break the previous link. Whenever a linkage is broken, any existing second-choice pointer is elevated to first-choice status, and any existing third-choice pointer is elevated to second-choice status. We then begin processing the current source records from the beginning until only reciprocal links remain. In our example, PLCKERC100 G291.6000.52 and PLCKERC030 G291.4700.62 are found to be the preferred matches to each other. We therefore keep the link between them and break the one between the 30 GHz source and PLCKERC100 G291.2700.71.
Due to resolution differences between the two bands, the 30 GHz source could also be a blend of the two 100 GHz sources. We therefore further check the flux densities and inspect multifrequency cutout images around our sources of interest using the ERCSC visualization tool at the Planck IRSA archive. In this case, the images reveal that PLCKERC100 G291.2700.71 is a dusty source that only starts to emerge at 70 GHz, and gets brighter towards the higher frequencies. Based on its 70–353 GHz flux densities, the contribution of this source to the 30 GHz flux density could not be more than of the flux density of PLCKERC030 G291.4700.62.
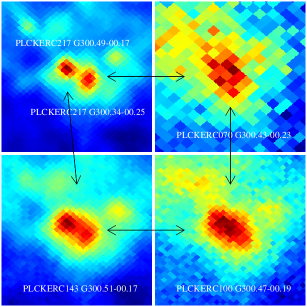
2.2.2 Excess linkage
After all the linkages have been made reciprocal, inconsistencies can still exist. For example (see Figure 2), a detection S1 in band B1 may have a reciprocal relationship with a detection S2 in band B2, which has a reciprocal relationship with a detection S3 in band B3, which then has a reciprocal relationship with a different source S4 in band B1 than the detection that started the chain. We therefore have two sources in band B1 in the same merged chain. Such situation is referred to as excess linkage. In the ERCSC bandmerging process, excess linkage often happens when one source detected in a lower-resolution band is resolved into multiple sources in higher-resolution bands. We break the links between the unresolved detections and the resolved ones, and separate them as different entries in the bandmerged catalogue. In the real case we present in Figure 2, a hotspot that is seen as one source from 70 to 143 GHz ( arcmin resolution) is resolved into two distinct sources at 217 GHz ( arcmin resolution). In this case, PLCKERC070 G300.4300.23, PLCKERC100 G300.4700.19 and PLCKERC143 G300.5100.17 would remain linked and be listed as one entry in the merged catalogue, with a note indicating its association with the two sources at 217 GHz that are listed separately as two independent entries.

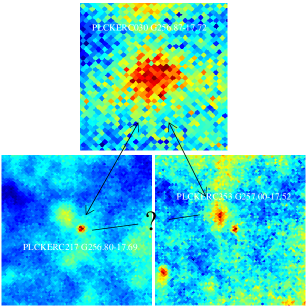
2.2.3 Linkage rejection
Linkage rejection refers to the problem that not all detections in a single merged chain are linked to each other. We illustrate this problem using the model given in Figure 3, where source S1 in band B1 is matched to both source S2 in band B2 and source S3 in band B3, but S2 and S3 are not matched to each other. For bands with similar resolutions, this problem is usually caused by the different positional errors of the detections in different bands. In the case of ERCSC, the main cause is the difference in the beam sizes in different band, which means that different matching radii are used for each pair of bands during the process of cross-band matching. For instance, assuming source S1 is from the 30 GHz band, sources S2 and S3 are from 217 GHz and 353 GHz bands individually. As defined in Section 2.1, the matching radii between the 30 and 217 GHz bands and the 30 and 353 GHz bands are both arcmin as the 30 GHz band has the larger beam in both matching pairs. Therefore sources S2 and S3 can both be associated with source S1 if the positional offsets of these two pairs are both less than 16 arcmin. However, when source S2 and source S3 are compared, the matching radius is 0.5 FWHM of the 217 or 353 GHz beam, 2.5 arcmin. Therefore, these two sources will not be matched if they are further than 2.5 arcmin apart. However, the fact that S2 and S3 are indirectly linked to a common source gives some credibility that they are probably matches to each other. We therefore test the unlinked detections with an enlarged matching radius of 1 FWHM. If this relaxed threshold is passed, these detections are temporarily associated. We then use the ERCSC visualization tool to inspect the multifrequency images of these sources. If the images confirm that the detections at different frequencies are indeed the same source, we make the linkage permanent. If the images suggest that the detection made at the lower-resolution band is the blending of the detections at higher-resolution bands, we break the linkage. Figure 3 presents such an example, where the 30 GHz detection PLCKERC030 G256.8717.72 breaks into two components at higher frequencies. The more compact component in the center is detected at 217 GHz, but is not in the 353 GHz catalogue; while the component to the upper left of the center is detected at 353 GHz but not 217 GHz. Although the compact 217 GHz source is seen at 353 GHz (Figure 3), its high frequency counterpart did not meet the SNR requirements of the ERCSC and was excluded from the 353 GHz catalogue. We link PLCKERC217 G256.8017.69 and PLCKERC353 G257.0017.52 temporarily after they survive the larger matching radius, but eventually break the links between these two sources as it is evident from the images that they are two distinct sources. We further examine the SED of the sources and find that PLCKERC217 G256.8017.69 is the correct counterpart of PLCKERC030 G256.8717.72. We therefore keep the link between these two and merge them into one entry in the bandmerged catalogue.

2.2.4 Cirrus contamination
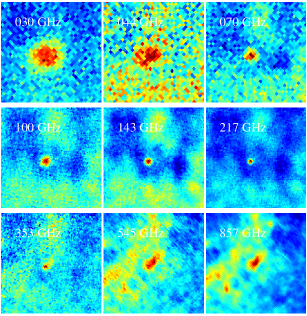
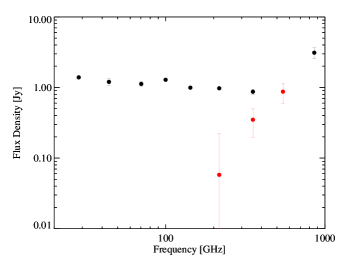
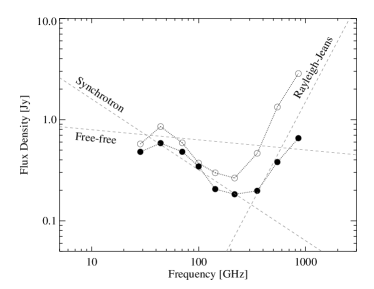
The aforementioned steps result in a bandmerged catalogue with reciprocal one-to-one pointers between matched sources, and in which all the sources linked in each merged chain are pointed to each other. However, between the 353 and 857 GHz frequency channels, the contribution from the ISM emission gets stronger and Galactic cirrus features can sometimes be confused with compact sources. An example is given in the top panel of Figure 4, where a detection is made at the center of the field in all the Planck bands except for the 545 GHz band. All the detections are linked to each other in a one-to-one reciprocal relationship in a single merged chain. The 30–353 GHz images show a bright, compact source in the center, and a positional search in the NASA/IPAC Extragalactic Database444http://ned.ipac.caltech.edu/ confirms the source as the well-known blazar 4C +56.27. The 545 and 857 GHz images, however, clearly reveal the structure of extended ISM emission which physically overlaps the blazar detected at the lower frequencies. Therefore, we cannot blindly associate the blazar with the detection at 857 GHz since the ISM emission at 857 GHz would boost the flux density of the blazar at the resolution of Planck and result in a rising spectrum which may not be truly associated with the blazar. We plot the SED of this merged chain in the bottom panel of Figure 4. The black filled circles are the flux densities of all the detections in the merged chain. The clean, flat spectrum of the blazar between 30 and 353 GHz suggests the association at these frequency channels is robust. The jump at 857 GHz is due to the contamination by ISM emission. We overplot the bandfilled flux densities for the 857 GHz sources555For each source detected in the 857 GHz band, the ERCSC also had entries which contained the flux densities of the source in the 217, 353 and 545 GHz maps derived through photometry in apertures centered on the 857 GHz position of the source. These flux densities are referred to as bandfilled flux densities, and are included in the ERCSC 857 GHz source list. at 217, 353, and 545 GHz in red. Large discrepancies can be seen between the bandfilled flux densities of the 857 GHz detection and the flat spectrum of the blazar at 217 and 353 GHz. This suggests that there is a small offset between the 857 GHz source position (the peak of the cirrus feature) and the position of the blazar. The bandfilled flux densities and the 857 GHz flux density constitute a smooth rising spectrum that is a signature of thermal dust emission, which further confirms that the detection at 857 GHz is mostly an ISM feature. It is also noticeable here that the 100 GHz flux density of the quasar is a little high. This is due to the contamination from the CO =10 emission line in the 100 GHz bandpass of Planck, which we will discuss in more detail in Sections 3.3 and 4.
We detect and disassociate cirrus contamination by first selecting sources with bandmerged 217–545 GHz flux densities that differ from the bandfilled flux densities at these frequencies by more than the total of uncertainties from both the bandmerged and the bandfilled flux densities. Since the ISM emission is normally extended – as in the example shown here – and the upper four bands have very similar spatial resolution, if the sources detected at 217 and 353 GHz are compact, then the 545 and 857 GHz counterparts should also be compact for robust matches. The EXTENDED flag in the ERCSC is used to selected sources which are extended at 857 or 545 GHz but compact at 217 or 353 GHz and these are identified as cirrus candidates. Finally we inspected the images and SEDs of these cirrus candidates, keeping the robust matches and separating the incorrect associations.
3 The Bandmerged Catalogue
3.1 Content
| Parameter | Description |
|---|---|
| NAME | Source name |
| GLON | Galactic longitude [deg] |
| GLAT | Galactic latitude [deg] |
| RA | Right ascension in J2000 [deg] |
| DEC | Declination in J2000 [deg] |
| NBAND | Number of Planck bands with detection |
| FLUX | Flux density [mJy] in the Planck bands, set to NaN if not available. |
| FLUX_ERR | Flux density uncertainty [mJy] in the Planck bands, set to NaN if not available. |
| ERCSC_NAME | Name of the source in the ERCSC, set to blank if not available. |
| NOTE | Flag, set to 1 if there is an entry in the notes file. |
The final bandmerged ERCSC has 15191 entries. It is distributed on the form of a FITS binary table, and is available in the NASA Planck Archive. The columns are described in Table 2. Sources are sorted in ascending order of Galactic longitude. The entry name and positions are based on the detection at the highest frequency in a merged chain, as it is generally true for Planck that the higher the frequency, the better the angular resolution and the better the positional accuracy of the source. The spatial resolution for each of the upper four bands is comparable, therefore it does not matter which of the upper frequency counterparts we base the position on; we use the position from the detection at the highest frequency for consistency with the choice at lower frequencies. For instance, the first entry of the catalogue is PLCKERC G000.0118.90. The highest frequency at which this source is detected is 857 GHz. so its NAME is inherited from the 857 GHz counterpart PLCKERC857 G000.0118.90 (with the frequency omitted), and its GLON, GLAT, RA and DEC are propagated from the 857 GHz source. This choice of the position for the merged entry may not always be the best solution, as the emission centroid of a source can sometimes shift between radio and infrared wavelengths. We therefore encourage the users to refer to the ERCSC single-band source lists for characteristics of a source derived in each frequency channel.
The number of frequency channels (1–9) in which a source is detected is recorded in the NBAND column. FLUX and FLUX_ERR are both 9-element vectors that are set to the ERCSC FLUX and FLUX_ERR (Planck Collaboration VII, 2011) in the bands where a detection is made, and set to NaN in bands where there is no ERCSC detection. Similarly, the names of the sources in the ERCSC single-band lists are provided in ERCSC_NAME, with a null value indicating no detection at a given band. We distribute with the merged catalogue a note file, providing additional notes for sources with NOTE flag set to 1.
3.2 Spectral types
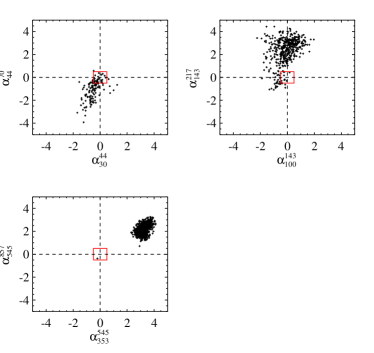
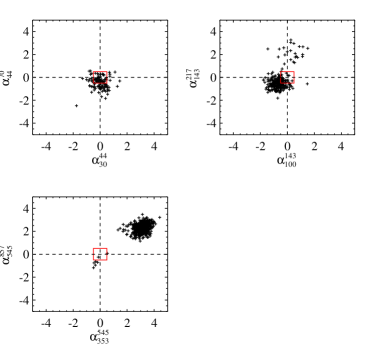
Using the bandmerged catalogue, we have selected sources that are detected in all three of the LFI bands (319 in total), in the 100–217 GHz bands (910 in total), and in the 353–857 GHz bands (3376 in total). Within each group, we have calculated spectral indices between the adjacent bands. Figure 5 presents the colour-colour diagrams for the spectral indices between 30, 44 and 70 GHz; 100, 143 and 217 GHz; and 353, 545 and 857 GHz. Separate colour-colour diagrams are presented for sources at b that are likely Galactic, and for sources at b that are likely extragalactic. Although not all high latitude sources may be extragalactic, statistically, they are likely dominated by extragalactic sources and appear to show a different distribution of spectral indices compared to sources close to the Galactic Plane. As can be seen, at low latitudes, the low frequency sources are predominantly synchrotron dominated sources while at high latitude, they have flat spectra, indicating the dominant role of radio galaxies and blazars. At intermediate frequencies, there is clearly a transition to free-free emission and thermal dust emission in the Plane while at high latitude, the population is still dominated by blazars with a flat spectrum. At the highest frequencies, we see primarily thermal dust emission both at low and high Galactic latitudes. Since the ERCSC is a high reliability, signal to noise limited catalogue, with varying flux density across the sky, there are a multitude of source classes which are sampled by the catalogue. With the large beam of Planck it is challenging to make associations with counterparts at other wavelengths, particularly the optical/near-infrared. Thus, the best attempt at source classification comes from the spectral indices across the Planck bands themselves. This helped identify sources such as planetary nebulae, stars and supernova remnants close to the Plane. At high latitudes, the low frequency sources are associated with AGN/radio galaxies while the high frequency sources are predominantly ISM features and star-forming galaxies. An attempt to classify 57 sources selected at 857 GHz at b, found that 44% of the sources were associated with the ISM. Stars, galaxies, pre-stellar cold clumps and star-forming regions accounting for 12% each, thereby highlighting the heterogeneity of the catalog (Johnson et al., 2013).
We consider all sources with to have a flat spectrum, where and are the two adjacent frequencies. We highlight this region with a red box in the colour-colour plot. Excluding this region, the upper left, upper right, lower right and lower left quadrants correspond to upturn, rising, peaked, and steep spectrum sources, respectively. It is clear that at the radio frequencies, Galactic sources are dominated by steep spectrum, while the extragalactic sources are dominated by flat spectrum. At the intermediate frequencies, while the Galactic sources are clearly transitioning from a relatively flat spectrum between 100 and 143 GHz to a rising spectrum between 143 and 217 GHz, the extragalactic sources mostly have steep or flat spectra. At the highest frequencies, rising-spectrum, dusty sources dominate both Galactic and extragalactic source populations.
 |

|

|
 |

|

|
3.3 Detections in all nine bands
There are 79 sources that are detected at all nine frequency channels of Planck. Most of these sources are Galactic, and only 12 are at , including the well-known quasars 3C 273 and 3C 279, and the starburst galaxy M82. SEDs for some of these sources are shown in Figure 6. Most of them show a visible bump in the SED at 100 GHz. This is because the CO =10 rotational transition line at 115 GHz falls within the bandpass of the Planck 100 GHz channel (Planck HFI Core Team, 2011), and thus the 100 GHz flux densities of ERCSC sources are boosted by the CO emission. We use the bandmerged catalogue to estimate the flux-density excess due to CO contribution in Section 4, where we discuss the possibility of using this flux excess to trace the CO distribution at high Galactic latitudes.
3.4 Detections in only one band
 |
|

|
 |

|

|
 |

|

|
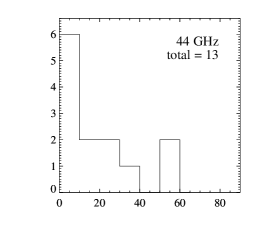
There are 6818 sources in the bandmerged catalogue that are detected in only one Planck frequency channel. Figure 7 gives the distribution of these sources in Galactic latitude for each of the Planck bands. The detection of a source in one band but not another can be due both to the spectral shape of the source and to the relative sensitivities across different Planck bands (Planck Collaboration VII, 2011). In Table 3, we show the flux densities of the faintest sources detected at and at , to quantify the sensitivity at each frequency. We also calculate the spectral indices between adjacent bands corresponding to these flux-density limits. Figure 8 plots the spectral shape derived from these flux-density limits, along with the expected spectra of the dominant radiation processes in the frequency regime covered by Planck. It is clear that the 30 GHz detections that are dominated by steep synchrotron spectra would be too faint to be detected at 44 or 70 GHz, hence the large number of unmatched sources at 30 GHz. The 44 GHz band is the least sensitive of the Planck bands, therefore if a source is detected in this band, it is likely to be detected at the 30 GHz band regardless of spectral shape, hence the small number of unmatched sources. With the exception of the 30 GHz channel, these singular sources are predominantly Galactic at frequencies up to 353 GHz. This is because extragalactic sources in this frequency regime usually have flat or close-to-flat spectra, as shown in Figure 5, and are therefore more likely to be detected at neighbouring frequencies. At higher frequencies, both the Galactic and the extragalactic source populations are dominated by dusty sources with rising spectra. Since the detection limit in these bands also mimics a rising spectrum (Fig. 8), the relative steepness of the two slopes determines whether a source is detected in one band or another. For example, the detection limit rises as for sources at between 217 and 857 GHz. If a source has , it is likely to be detected in the 857 GHz band but missed in the 217 GHz band.
Although the balance of map sensitivity and source spectral shape is the major reason for these single detections, it is not the only reason: the ERCSC is not a complete catalogue (to ensure a 90 cumulative reliability at each band, some detections were removed from the final source list due to the noisy sky background even though they individually passed the detection threshold; see Planck Collaboration VII 2011); and it is also possible that a few of the detections are spurious.
| Frequency [GHz] | 30 | 44 | 70 | 100 | 143 | 217 | 353 | 545 | 857 |
|---|---|---|---|---|---|---|---|---|---|
| Flux density limita [Jy] | 0.575 | 0.853 | 0.589 | 0.371 | 0.298 | 0.265 | 0.465 | 1.331 | 2.850 |
| Spectral index b | 0.90 | 0.79 | 1.31 | 0.61 | 0.28 | 1.16 | 2.42 | 1.68 | |
| Flux density limita [Jy] | 0.480 | 0.585 | 0.481 | 0.344 | 0.206 | 0.183 | 0.198 | 0.381 | 0.655 |
| Spectral index b | 0.45 | 0.42 | 0.95 | 1.44 | 0.28 | 0.16 | 1.51 | 1.20 | |
a Flux density of the faintest source at or in the ERCSC.
b Spectral index , calculated based on the flux density limit of the adjacent bands, . For the LFI bands, the central frequencies of 28.5, 44.1 and 70.3 GHz are used in the calculation instead of the nominal frequencies.
4 Probing CO at High Galactic Latitudes?
As we mentioned in Section 3.3, the Planck 100 GHz flux density measurements can be contaminated by the 12CO =10 line at 115.271 GHz (Planck Collaboration XIII, 2014). This CO is probably Galactic, along the line of sight between the Planck satellite and the source. However, an origin within the source cannot be ruled out since even a modest redshift () would shift the line further inside the 100 GHz bandpass. We take two approaches in assessing the flux-density excess due to the CO contamination.
In the first approach (Approach I), we select bandmerged sources that were detected at 100 GHz, at two or more channels below 100 GHz, and at two or more channels above 100 GHz. This allows us to fit three types of simple models to the source SED:
i) single power law
| (1) |
ii) quadratic fit
| (2) |
iii) double power law
| (3) |
where are parameters that are different in each model. The 100 GHz flux densities are excluded in the SED fitting. A model fit is accepted when the values indicate that the model is compatible with of the data. In cases when more than one model was acceptable, we selected the model with fewest parameters unless an additional parameter significantly improved the value of the reduced (as described in Bevington & Robinson 2003).
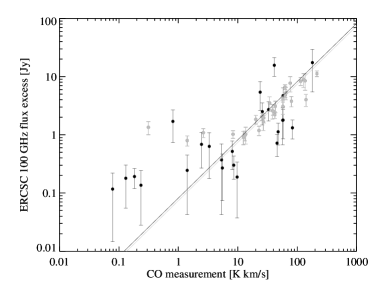
There are 367 sources in the bandmerged catalogue that meet the selection criteria, out of which 225 (61.3) yield a good fit. For the sources that have a good fit, we subtract the fitted values at 100 GHz from the ERCSC 100 GHz flux densities, i.e., , and the uncertainty of this excess is . We consider a source to have a positive flux-density excess at 100 GHz when ; 123 sources are found to have a positive 100 GHz flux density excess. Assuming this excess comes entirely from the CO =10 rotational transition line, we would expect a linear correlation between the amplitude of the excess and the observed CO intensity from Dame et al. (2001). In Figure 9 (left panel), we plot the excess values against the CO intensity for the 51 ERCSC sources that are in the region covered by the Dame et al. (2001) CO map. There is good agreement, especially in the high CO intensity zone. We then apply a linear fit in log-log space, forcing the slope to be 1, i.e., . For all the points with , the intercept has a value of . If we restrict the fit to only the points with highly significant excess (i.e., ), we find an intercept value of . Here, the first error term is propagated from , the second error term is the scattering of with respect to the mean value of b.
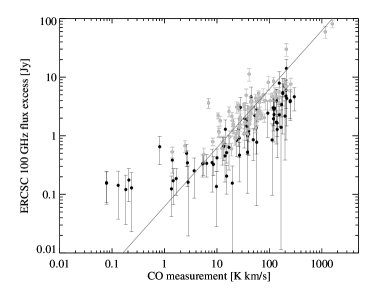
In a second approach (Approach II), we select sources that have detections at 70, 100 and 143 GHz. Assuming a single power-law spectrum across these three bands, we interpolate between the 70 and 143 GHz flux densities to approximate the true 100 GHz flux density of the source. There are 482 sources in the bandmerged catalogue that meet this selection criterion, out of which 147 are at . We apply the same definition for sources with flux excess or significant flux excess in the 100 GHz channel and find 254 sources have positive flux excess at 100 GHz, out of which 53 are at . We again compare the excess values of the ERCSC sources with ground-based CO measurements. Of the 254 sources, 154 reside in the region covered by the Dame et al. (2001) CO map. We see in Figure 9 (right panel) the linear correlation between this set of flux-density excess values and the measured CO intensity. In this case we find an intercept of for all the sources with positive excess and for sources with highly significant excess.
| Name | RA (J2000) | Dec (J2000) | ||||
|---|---|---|---|---|---|---|
| [h m s] | [d m] | [Jy] | [Jy] | [Jy] | [Jy] | |
| PLCKERC G000.65-00.03 | 17 47 17 | -28 23 | 109.28 9.02 | 227.76 9.90 | 196.90 7.13 | 81.3911.91 |
| PLCKERC G002.43+05.84 | 17 29 21 | -23 45 | 1.33 0.14 | 1.77 0.08 | 1.57 0.06 | 0.32 0.12 |
| PLCKERC G005.89-00.40 | 18 00 34 | -24 03 | 27.05 1.17 | 30.48 0.65 | 30.64 0.80 | 1.71 0.98 |
| PLCKERC G005.97-01.14 | 18 03 34 | -24 21 | 72.59 2.83 | 60.23 1.47 | 37.16 1.76 | 8.16 2.17 |
| PLCKERC G008.13+00.22 | 18 02 59 | -21 48 | 7.55 1.20 | 11.15 1.26 | 10.08 0.89 | 2.43 1.49 |
| PLCKERC G009.34-19.61 | 19 24 52 | -29 14 | 12.49 0.19 | 11.08 0.08 | 9.13 0.07 | 0.39 0.12 |
| PLCKERC G010.18-00.35 | 18 09 27 | -20 18 | 46.24 2.34 | 50.14 2.32 | 45.38 2.36 | 4.33 2.86 |
| PLCKERC G012.17-05.71 | 18 33 41 | -21 03 | 2.49 0.18 | 2.09 0.07 | 1.54 0.04 | 0.13 0.11 |
| PLCKERC G012.80-00.20 | 18 14 15 | -17 55 | 51.75 1.63 | 60.71 1.56 | 54.54 1.87 | 7.59 1.99 |
| PLCKERC G014.22+42.21 | 15 50 38 | +05 27 | 1.50 0.18 | 1.48 0.07 | 1.06 0.04 | 0.22 0.10 |
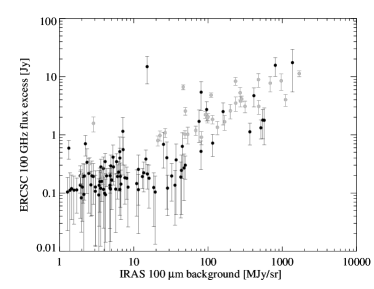
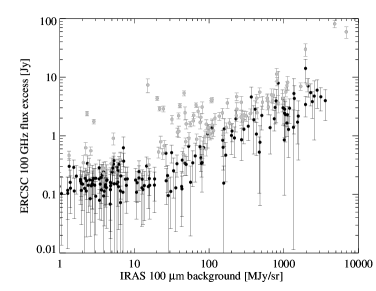
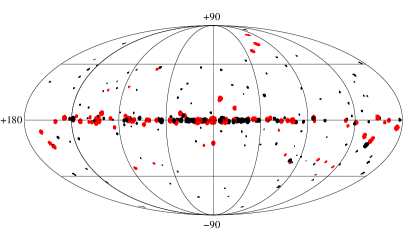
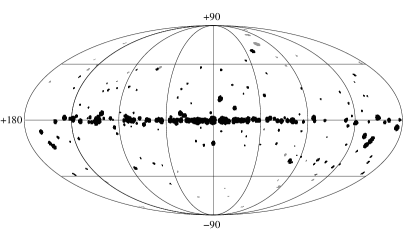
The Dame et al. (2001) CO map is largely restricted to the Galactic plane. Since the gas and dust content in the ISM are well correlated, we further compare the ERCSC 100 GHz flux-density excess values with the median intensity within an aperture radius of 1 FWHM at the source position in the IRAS 100 m full-sky map666http://irsa.ipac.caltech.edu/data/Planck/release_1/external-data/external_maps.html . We see that the linear relationship extends over the entire sky (Fig. 10) for excess values estimated by both approaches. This suggests that we can use the ERCSC 100 GHz flux-density excess to probe the distribution of CO at high Galactic latitudes. Since the values fitted in the two approaches are not distinguishable given the large scatter, and there is little difference between the fits from all the sources and the sources with highly significant excess, we therefore decide to adopt Approach II and a linear relation of as it is a simpler approach and has a bigger sample size. The full sample of sources with a positive 100 GHz flux density excess is given in Table 4, which list the positions of the sources, their 70, 100 and 143 GHz flux densities in the ERCSC, and the excess flux densities at 100 GHz. Figure 11 presents the sky distribution of this sample. All the sources with are indicated by filled circles, while red highlights the sources with .
The most natural explanation would be that the excess CO emission is coming from the source itself. However, the vast majority of these sources are radio-loud extragalactic AGN, especially at high latitude. The median redshift of the sources determined by cross-correlating with the NASA Extragalactic Database (NED) is . At these redshifts, the rest-frame 115 GHz CO line would be redshifted out of the 100 GHz Planck bandpass. Only at would the CO line remain in the 100 GHz bandpass. Furthermore, for even a source, a typical molecular gas mass of 1010 M☉ (Frayer et al., 2011; Riechers et al., 2011),would result in an bandpass integrated flux density excess at 100 GHz of less than a Jy; this is many orders of magnitude below the typical photometric noise of the sources. Thus, it appears that the CO that we detect is Galactic CO emission along the line of sight to the source.
It is important to note that the excess CO emission is measured in the photometry of the source which in turn is measured by subtracting the median sky background in an annulus around the source. It therefore appears that the detected CO emission is in excess of the diffuse, spatially extended, CO emission and is clumpy on the scale of the Planck 100 GHz source size which corresponds to 10 radius. This is a scale which has not been probed by previous ground-based, CO mapping experiments and this catalogue provides a unique window into this clumpy emission. Furthermore, even the Planck component separated CO maps are unable to trace this emission at the location of the sources since the maps suffer from leakage of source flux into the component maps.
In Figure 12, we plot the Galactic-latitude distribution of the excess in our sample of sources with positive flux density excess. It appears that there is a plateau in the 100 GHz excess, i.e., flux density excess is not varying with increasing Galactic latitudes. This plateau is likely the result of Eddington bias because we have not plotted any sources with negative flux density excesses. We recall that among the 147 high Galactic latitude () sources for which the multi-band photometry was adequate to assess the existence of CO emission, only 53 have and 10 of them have . It is these 53 sources which make it appear that there is a plateau. When including the remaining sources, the median excess at 100 GHz for all the 147 high latitude sources is 5510 mJy, which is 4.4% of the 100 GHz flux density of the sources and cannot be accounted for by beam uncertainties or calibration which are less than one percent.
We attempt to assess the robustness of this value to systematic errors. We first undertake a Monte-carlo simulation where we scatter the flux densities of the 147 sources at 70, 100 and 143 GHz by their photometric uncertainty and repeat the fitting process outlined as Approach II. We find that the median excess at 100 GHz from the 1000 Monte-carlo runs resulted in 6012 mJy with the full range of values spanning 24 to 96 mJy.
We also test random subsets of the sources for the excess. For example, Eddington bias affects fainter sources more than the brighter one. If the median was measured only for the SNR8 sources at 100 GHz, we would derive a median excess of 5710 mJy. When only sources with SNR30 are selected, we would derive a median excess of 3010 mJy (See Fig. 15).
Thus, it appears that the excess we detect due to CO at high Galactic latitude is robust at the level and equivalent to a flux density at 100 GHz between 30 and 60 mJy. Using Figure 9, we find that this would translate to a CO intensity of 0.50.1 K km s-1.
A similarly low value has been seen in individual lines of sight, away from sources, in the component-separated Planck maps. Fig. 17 of Planck Collaboration XIII (2014) shows evidence for low CO line intensities between 0.5 and 3 K km s-1 which correlate well with ground-based measurements of CO along individual lines of sight by Hartmann et al. (1998) and Magnani et al. (2000). It is however challenging to probe the low levels of intensity we are probing here since the noise in the Dame et al. (2001) CO map is about 1 K km s-1 while the noise in the Hartmann et al. (1998) maps is about 0.2 K km s-1. Substructure at the level that we are probing would be undetected in those surveys. We also find that the Northern hemisphere appears to show stronger emission than the Southern Hemisphere by a factor of (2.5) but given the weakness of the signal in the entire catalogue, we suggest that using deeper catalogues or deeper, higher resolution surveys from the ground are required to confirm this tentative result. If true, a comparison with the results in Hartmann et al. (1998) and Magnani et al. (2000) would suggest that the Northern Hemisphere contains fewer large clouds and more small clouds while the Southern Hemisphere contains relatively fewer small clouds and more large clouds where the distinction between large clouds and small clouds is 15 M☉. The most likely origin for this is likely to be the location of the Sun above the Galactic mid plane which provides an unimpeded sight line through the lower mass clumps at high latitude.
Finally, we assess the gas mass in the clumps that we are detecting. The filling factor of this gas is unclear since we only trace this low level of emission from the 147 sources with high SNR. The lower limit to the filling factor is the fractional solid angle subtended by these 100 GHz Planck sources and is 610-4. Adopting the same distance parameters and conversion factors of Hartmann et al. (1998) results in a total mass of 2060 M☉ which is comparable to the mass (and mass surface density) in the large clouds at high latitude.


4.1 Alternative explanation to the ERCSC 100 GHz flux excess?
Electric dipole emission from spinning dust is generally thought to contribute to the Galactic microwave emission detected between and 60 GHz. Theoretical models suggest that the peak frequency of spinning dust emission could be as high as GHz, depending on the properties of the dust grains and their environment (e.g., Draine & Lazarian, 1998; Ali-Haïmoud et al., 2009; Ysard & Verstraete, 2010). Therefore it could potentially contribute to the 100 GHz flux-density excess in the ERCSC sources. However, such high-frequency peaks require extreme environments: very high density, moderately-high radiation field, and high fraction of ions. To date, spinning dust emission has been detected mostly at 20–40 GHz across the Galactic sky. There has been one extragalactic detection of spinning dust emission peaked at 33 GHz in a star-forming region in the galaxy NGC 6946 (Murphy et al., 2010). Combining the Planck ERCSC, WMAP and other archival measurements, Peel et al. (2011) studied the continuum spectra of three nearby dusty star-forming galaxies (M82, NGC 253, and NGC 4945) but found no convincing evidence for spinning dust.
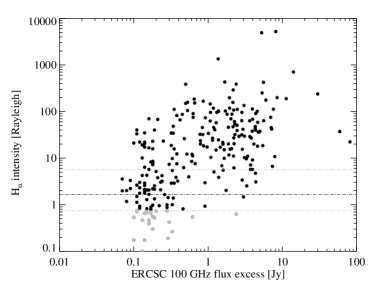
In addition, since CO is dense in star-forming regions which can also be traced by their H emission, we compare in Figure 13 the 100 GHz flux-density excess of our sample with the H intensity of these regions in the composite H full-sky map (Finkbeiner, 2003). The dark filled circles are sources with H intensity greater than the 25 percentile value of the full-sky map and are likely to be associated with star formation regions. The relationship with H shows a larger scatter than the correlations in Figure 9 and 10, suggesting a less direct relationship with a star-formation tracer. The formal Pearson’s correlation coefficient of the excess against H is 0.6 while that against the Dame CO map is 0.97. This suggests that although some star-formation may be present especially along the lines of sight to 100 GHz-excess sources in the Galactic plane, the CO emission that we detect is more likely attributable to diffuse ISM and is not associated with individual star-forming regions. There are 21 sources (grey filled circles) with H intensity below the 25 percentile value. For these sources, we compare the flux-density excesses with measures of dust extinction, such as the Schlegel et al. (1998) values and the Planck values (Figure 14). Although no strong correlation is seen, the plots show that the value of is not zero along those lines of sight; there is therefore dust present in these locations, which in turn is expected to be collocated with ISM gas. The formal correlation coefficient with extinction measures is 0.87.
4.2 Excess in other bands: A consistency check
A detection of the 12CO =10 emission in the 100 GHz band motivates a check for the next strongest line, the CO =21 emission in the 217 GHz bands. Indeed, during component separation of the diffuse foregrounds, Planck Collaboration XIII (2014) find evidence for significant contribution of CO =21 emission to the 217 GHz intensity and CO =32 emission to the 353 GHz intensity, albeit mainly in the Galactic plane. To be able to undertake the same analysis, at high latitude for the =21 line, a source needs to be detected at 143, 217 and 353 GHz in addition to 70 and 100 GHz. The 79 ERCSC sources seen in all bands are a robust, bright sample for this analysis. Reproducing the analysis that was performed to derive the 100 GHz excess at the 143, 217 and 353 GHz, we find that of the 69 sources that have an excess at 100 GHz, only 14 have an excess at 217 GHz and only 2 having a statistically significant excess () at both 100 and 217 GHz. This is partly because sources are typically brighter at 217 GHz due to the rising thermal dust emission and the fractional increase in their brightness due to CO =21 is a smaller fraction of their flux density and typically well within their flux density uncertainty. In addition, the bandwidth at 217 GHz is broader. Thus for the same CO line flux, the broadband flux density excess is half of what it is at 100 GHz, although that is compensated for in a limited way by the reduced noise in the 217 GHz map. For the two sources which do have a statistically significant excess at both 100 and 217 GHz, PLCKERC G250.08-31.09 and PLCKERC G305.11+57.05, they are both at high latitude and with 21 /10 ratios of 1.4 and 1.1 respectively, consistent with what is seen in the diffuse ISM where the ratio ranges from 0.5 to 1.5 and in individual galaxies where it may be as high as 5. For the 55 sources which do not show a 217 GHz excess, the median upper limit of 21 /10 is 0.7 further indicating that the 100 GHz excess is robust. We do not find any high latitude sources which have possible excess at 353 GHz due to CO 32 emission and also at 100 GHz.
We then attempt the converse; which is we attempt to measure an excess at 217 and 353 GHz from CO 21 and CO 32 emission, using the same methodology adopted earlier. We then assess if the excess in those bands is consistent with an absence of excess in the 100 GHz band. We note that this calculation is fraught with uncertainty because at these higher frequencies, particularly 353 GHz, the contamination from the Rayleigh-Jeans tail of cold dust emission is significant (Figure 5.). There are 95 sources for which there may be an excess at 217 GHz; comparing these regions with the Dame CO map shows a weak correlation with a correlation coefficient of 0.6. For the 4 sources at high latitude which have an apparent excess at 217 GHz, we find that two have lower limits of 21 /10 of 1.4 and 1.1, consistent with the range seen in the ISM. One other source is strongly contaminated by rising dust emission even at 217 GHz while the fourth source has a lower limit of 4, which is unusual but consistent with the range seen.
Repeating the analysis at 353 GHz, we find that of the 287 high latitude sources which have an apparent excess, seven have any observational constraints at 100 GHz. Four have low significance excess at 100 GHz while the rest have no evidence of excess at 100 GHz. If this excess were due to CO 32, the median lower limit would be 50 which is unphysical since values in star-forming galaxies are typically 5-10. For the one source which has excess from both CO 32 and 21 (but not constraints at 100 GHz), the intensity ratio is 5.7, at the high end but consistent with values seen in star-forming galaxies. As a result, we conclude that although the methodology we have adopted works well up to 217 GHz, at higher frequencies where dust properties show a wide range of far-infrared color temperatures, it is challenging to use an interpolation between adjacent bands to find evidence for CO 32 excess.
Thus, although a useful consistency check, we find that we do not have either the S/N or source statistics to claim a robust high latitude excess at the other bands although the average excess, where detectable, is consistent with the line ratios seen in Planck Collaboration XIII (2014).
4.3 Contamination from nearby sources at 143 GHz
Another possible contribution to the excess at 100 GHz is contamination of the 100 GHz flux density from a faint nearby source. Since the 100 GHz beam is larger than that of the 143 GHz band, an association of only one of multiple nearby 143 GHz sources to a 100 GHz source would result in an excess being artificially estimated at 100 GHz. To assess this, we have cross-matched the list of excess sources with the deeper, low-SNR 143 GHz catalogue from Planck Data Release 1 which is also available on the public Planck archive. We find that only 2 of the 53 excess sources at high latitude have two close 143 GHz counterparts within 1.5FWHM at 100 GHz and only 1 of the excess sources has the counterpart within 1 FWHM. This rules out the presence of contamination from faint nearby sources playing a significant role especially at high Galactic latitude. Naturally, there can be contamination close to the Galactic plane. In fact, we find that out of the 255 sources, 84 have a close companion within 1.5FWHM. However, our primary result is for the contribution of CO in the high latitude sky and hence the contamination in the Plane does not affect our conclusions.

5 Conclusions
We have created a bandmerged catalogue of the Planck Early Release Compact Source Catalog in this paper, and we have shown how confusing cases, arising from the varying spatial resolution in the different bandpasses, can be handled in the process. We used the catalogue to probe the spectral types of the sources at different Planck frequencies. The flux densities in the Planck 100 GHz bandpass are contaminated by CO =10 emission. We have shown that by simple interpolation between the 70 and 143 GHz flux densities of individual sources, we can estimate the flux-density excess arising from the CO along the lines of sight. The CO excess agrees well with the intensity from the observed CO map in regions close to the Galactic plane, and is also correlated with the IRAS 100 sky background, which is dominated by dust emission. Thus, we are able to use the multi-wavelength spectra of bright sources to probe the CO distribution at high Galactic latitudes where the first estimates from ground-based observations and Planck have only recently become available (Planck Collaboration XIII, 2014; Magnani et al., 2000; Hartmann et al., 1998). We find evidence that the high latitude CO emission is structured on 10 scales and contributes a median line of sight intensity of 0.50.1 K km s-1, which we argue is evidence for a population of low mass () high latitude, molecular gas clumps. There is evidence for asymmetricity between the Northern and Southern Galactic hemispheres where the Northern hemisphere seems to show more small clumps than the Southern hemisphere. These clumps could account for a lower limit of 2000 M☉ of molecular gas at high latitude. Deeper, higher resolution CO surveys will be required to provide an accurate census of these clumps and their contribution to the total molecular gas budget.
acknowledgements
We thank the referee for thoughtful comments which improved the manuscript. We also thank Dr. Clive Dickinson for helpful discussions in the preparation of this paper. This research has made use of the NASA/IPAC Extragalactic Database (NED) and NASA/ IPAC Infrared Science Archive, which are operated by the Jet Propulsion Laboratory, California Institute of Technology, under contract with the National Aeronautics and Space Administration. Some of the results in this paper have been derived using the HEALPix (Górski et al., 2005) package.
References
- Ali-Haïmoud et al. (2009) Ali-Haïmoud Y., Hirata C. M., Dickinson C., 2009, MNRAS, 395, 1055
- Bevington & Robinson (2003) Bevington P. R., Robinson D. K., 2003, Data reduction and error analysis for the physical sciences, 3rd edn. Boston, MA: McGraw-Hill
- Dame et al. (2001) Dame T. M., Hartmann D., Thaddeus P., 2001, ApJ, 547, 792
- Draine & Lazarian (1998) Draine B. T., Lazarian A., 1998, ApJ, 508, 157
- Finkbeiner (2003) Finkbeiner D. P., 2003, ApJS, 146, 407
- Fowler (2003) Fowler J. W., 2003, Technical report, Bandmerging SIRTF point sources. NASA Spitzer Science Center, http://irsa.ipac.caltech.edu/data/SPITZER/docs/dataanalysistools/tools/bandmerge/bandmerge_technical.pdf
- Frayer et al. (2011) Frayer, D. T., Harris, A. I., Baker, A. J., et al. 2011, ApJL, 726, L22
- Górski et al. (2005) Górski K. M., Hivon E., Banday A. J., Wandelt B. D., Hansen F. K., Reinecke M., Bartelmann M., 2005, ApJ, 622, 759
- Hartmann et al. (1998) Hartmann D., Magnani L., Thaddeus P., 1998, ApJ, 492, 205
- Johnson et al. (2013) Johnson, C. H., Border, C., O’Connor, K., et al. 2013, American Astronomical Society Meeting Abstracts #221, 221, #352.18
- Magnani et al. (2000) Magnani L., Hartmann D., Holcomb S. L., Smith L. E., Thaddeus P., 2000, ApJ, 535, 167
- Murphy et al. (2010) Murphy E. J., Helou G., Condon J. J., Schinnerer E., Turner J. L., Beck R., Mason B. S., Chary R.-R., Armus L., 2010, ApJL, 709, L108
- Peel et al. (2011) Peel M. W., Dickinson C., Davies R. D., Clements D. L., Beswick R. J., 2011, MNRAS, 416, L99
- Planck Collaboration I (2011) Planck Collaboration I 2011, A&A, 536, A1
- Planck Collaboration Int. VII (2013) Planck Collaboration Int. VII 2013, A&A, 550, A133
- Planck Collaboration VII (2011) Planck Collaboration VII 2011, A&A, 536, A7
- Planck Collaboration XIII (2011) Planck Collaboration XIII 2011, A&A, 536, A13
- Planck Collaboration XIII (2014) Planck Collaboration XIII 2014, A&A, 571, A13
- Planck Collaboration XIV (2011) Planck Collaboration XIV 2011, A&A, 536, A14
- Planck Collaboration XV (2011) Planck Collaboration XV 2011, A&A, 536, A15
- Planck Collaboration XX (2011) Planck Collaboration XX 2011, A&A, 536, A20
- Planck HFI Core Team (2011) Planck HFI Core Team 2011, A&A, 536, A6
- Riechers et al. (2011) Riechers D. A., Carilli C. L., Maddalena R. J., Hodge J., Harris A. I., Baker A. J., Walter F., Wagg J., Vanden Bout P. A., Weiß A., Sharon C. E., 2011, ApJL, 739, L32
- Schlegel et al. (1998) Schlegel D. J., Finkbeiner D. P., Davis M., 1998, ApJ, 500, 525
- Ysard & Verstraete (2010) Ysard N., Verstraete L., 2010, A&A, 509, A12