P.le Aldo Moro, 5, Rome, 00185, Italy
Tel.:+390649914462
11email: riccardo.gualtieri@uniroma1.it
Acknowledgement
The final publication is available at Springer via http://dx.doi.org/10.1007/s10909-015-1436-1
Multi-mode TES bolometer optimization for the LSPE-SWIPE instrument
Abstract
In this paper we explore the possibility of using transition edge sensor (TES) detectors in multi-mode configuration in the focal plane of the Short Wavelength Instrument for the Polarization Explorer (SWIPE) of the balloon-borne polarimeter Large Scale Polarization Explorer (LSPE) for the Cosmic Microwave Background (CMB) polarization. This study is motivated by the fact that maximizing the sensitivity of TES bolometers, under the augmented background due to the multi-mode design, requires a non trivial choice of detector parameters. We evaluate the best parameter combination taking into account scanning strategy, noise constraints, saturation power and operating temperature of the cryostat during the flight.
Keywords:
Cosmology, Detectors, TES, Multimode1 Introduction
One of the most interesting goals in Cosmology nowadays is the detection of the primordial curl component (”B-mode”) of the Cosmic Microwave Background (CMB) polarization at large angular scales. This tiny signal might provide the indirect confirmation of the inflationary paradigm since a background of primordial gravitational waves would leave such a characteristic imprint on the CMB.
Transition Edge Sensors (TES) are the state of the art technology in CMB measurements. Thanks to their high sensitivity they are the choice of cutting-edge experiments both from ground and stratosphere. The readout strategies are mature enough to manage thousands of detectors.
A step forward for applications which favor light collection efficiency per detector over spatial resolution, is represented by the use of multi-moded detectors We have modeled and simulated feedhorns and cavities for such purpose as shown in Lamagna2015 . This allows to significantly increase the sensitivity as for a given number of efficiently coupled radiation modes at a given frequency, the photon noise limited ratio improves as , at the cost of coarser angular resolution. This is an appealing solution for the LSPE-SWIPE instrument, designed to perform a balloon-borne measurement of CMB polarization at large angular scales 2012arXiv1208.0281T ; 2012SPIE.8452E..3FD .
LSPE will observe of the sky in a circumpolar flight during the Arctic night . The SWIPE instrument consists of two focal planes populated
with 330 multimoded TES bolometers multi-mode , equally split in the 3 bands , , GHz, and looking at the sky through a polarizer and cold rotating half wave plate (HWP).
This work is motivated by the necessity of optimizing the TES chip under an operating background larger than the one present in standard single-mode detectors operating in the same frequency bands.
This requires a fine-tuning and trade-off of the characteristics of the TES taking into account their noise and saturation power.
In this contribution we present the design of the LSPE-SWIPE detectors in terms of heat capacities and thermal conductivities for the chip constituents, and relate them to the bolometer time constant .
Finally we discuss the results of the optimization for the specific case of LSPE-SWIPE, for each band of the instrument, constraining the detector parameters as well as the transition temperature of the film and its normal resistance . We show that, with these choices, we are able to push the TES technology to its best performance 2014SPIE.9153E..08B .
2 Scan Strategy and Time Constant
LSPE scans the sky by spinning in azimuth, at a rate , so that the telescope, pointed at elevation , scans the sky at speed . If the beam has a Gaussian shape with standard deviation , and the time response of the detector is described by a first-order low-pass with time constant , the degradation of the beam response depends only on the ratio between the time required to cross one beamwidth and the time constant:
| (1) |
It has been demonstrated that for the deformation of the beam is negligible for accurate determination of CMB anisotropy and the related cosmological parameters 1998MNRAS.299..653H .
In the case of LSPE-SWIPE rpm, the beam FWHM is and the minimum elevation is : the condition results in a requirement for the time constant of the detectors
ms.
This can be met for our large throughput bolometers, exploiting the extreme electrothermal feedback conditions achievable with TES sensors.
Our choice is to consider a time constant:
| (2) |
where , that accounts for the chip geometry and the used materials, is the heat capacity of the bolometer,
is the thermal dynamic conductance of the link between the sensor and the thermal bath and is the loop gain that will be evaluated in what follows. With an assumed transition width , a bath temperature , a critical temperature Biasotti2015 and an , for , we obtain: transition slope , loop gain where 1998JAP….83.3978I .
The constraint on the time constant is also dictated by the choice of the readout scheme. The stability of the resonator, when it is AC biased, in a frequency domain multiplexing environment could be damaged by a small detector time constant 2012RScI…83g3113D .
Reverting Eq. (2), this converts into a requirement on the value of necessary to meet the time constant target such that: .
3 Noise Constraint
In order not have an increase in the Noise Equivalent Power (NEP) larger than of photon noise, we aim at a thermal NEP a factor smaller than photon NEP. Photon noises in the three SWIPE bands are: , and .
Photon noise has been computed adding in quadrature the contributions from the CMB, Galactic dust at high latitudes, residual atmosphere, cryostat window, optical filters at different temperature stages inside the cryostat. Each contribution has been modeled as a gray-body, with the appropriate emissivity term multiplied by the efficiency of the instrument (filters transmission times bolometer absorption efficiency). For each noise contribution, the Poisson and wave-interference photon noise terms have been added in quadrature. The noise contribution from different radiation modes has been assumed to be uncorrelated.
Under these assumptions the contribution to the NEP due to photon noise from each source can be computed as:
| (3) |
where is the instrument efficiency while is the emissivity of the source. This expression could be derived following 1986ApOpt..25..870L .
The thermal noise, is defined as:
| (4) |
with that ranges and takes into account non-equilibrium effects 2005cpd..book…63I , the Boltzmann constant, the critical temperature and the conductance. To meet the desired requirements, in each band, we need to have a :
, and .
For a given , just as we aim to have a , by reverting Eq. (4) we obtain the desired .
In this estimate we are not aware of the thermal fluctuation noise because of the geometry of the chip 2004Tiest : the thermistor is at the center of a spider-web absorber with a radial symmetry, as shown in Biasotti2015 .
4 Saturation Power
In order not have our TES saturated during observations due the the intrinsic background fluctuations, we set the saturation power requirements times the power
loading expected on the detectors. After accounting for available bandpass information, we calculated the power loading on the detectors as , and pW respectively for the , , GHz channels. The power load is evaluated by taking into account the emission of the optics, the bandwidth of the filters (), the atmospheric signal and the throughput.
The in each channel is: , and .
Those latter narrow bandpasses are chosen to best constraint the slope of the foregrounds spectrum, meeting at the same time the optical load on detector requirement.
With our setup we couple , and modes in the , and bands respectively with an efficiency of , and .
Modeling the weak thermal link to the heat bath with a temperature dependent conductivity, defined by the law , with for ,
we write , with the thermal conductivity exponent 2005cpd..book…63I .
The heat flow from the bolometer to the bath can be written as:
| (5) |
where and are relative to the particular bolometer and material configuration. Since the saturation power is the power dissipated to the bath at the superconducting temperature we can write:
| (6) |
where everything depends on the thermal conductance between the bolometer and the bath:
| (7) |
5 Thermal conductance vs critical temperature
The fridge base temperature is expected to be around . The required , taking into account unavoidable temperature gradients and non-uniformities will be at the level of . From what described in the previous sections, we can set three different constraints on the bolometer conductivity as a function of the TES critical temperature , with a loop gain and a that accounts for the chip geometry and the materials:
|
From Eq. (4): (8) |
From Eq. (6): (9) |
From Eq. (2): (10) |
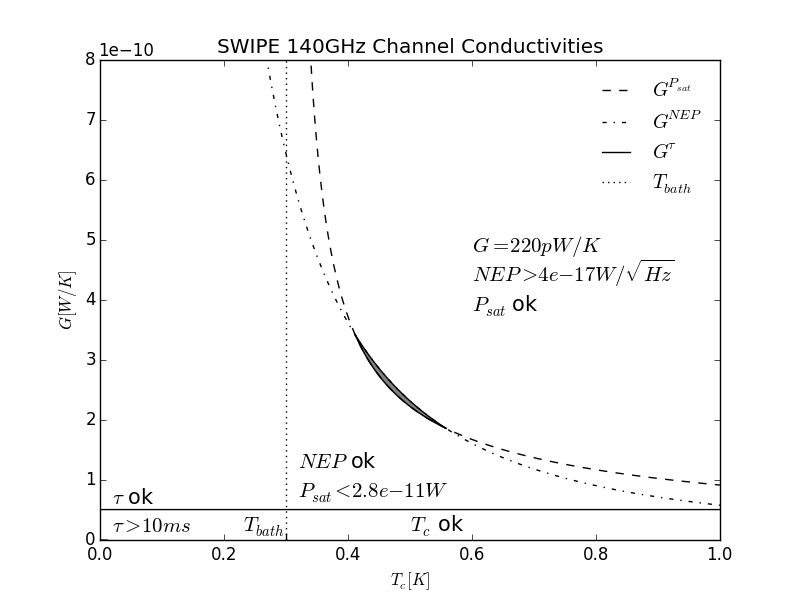
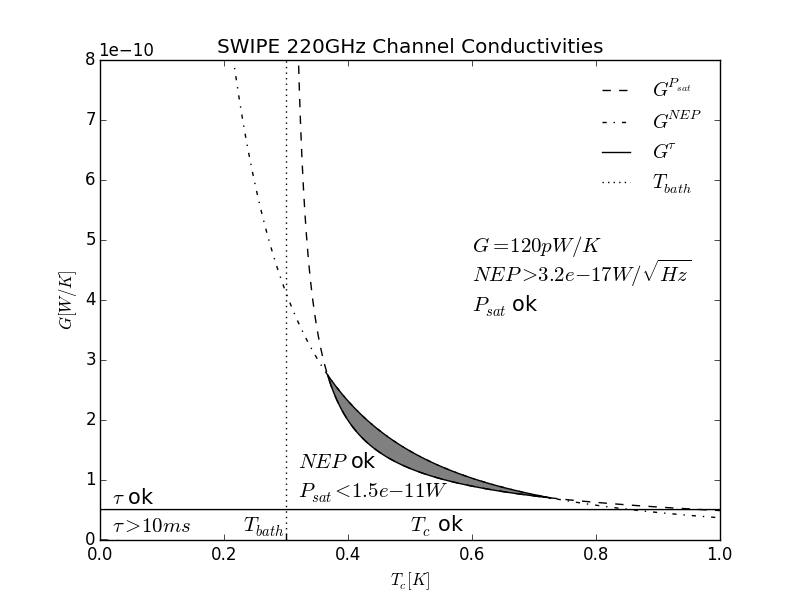
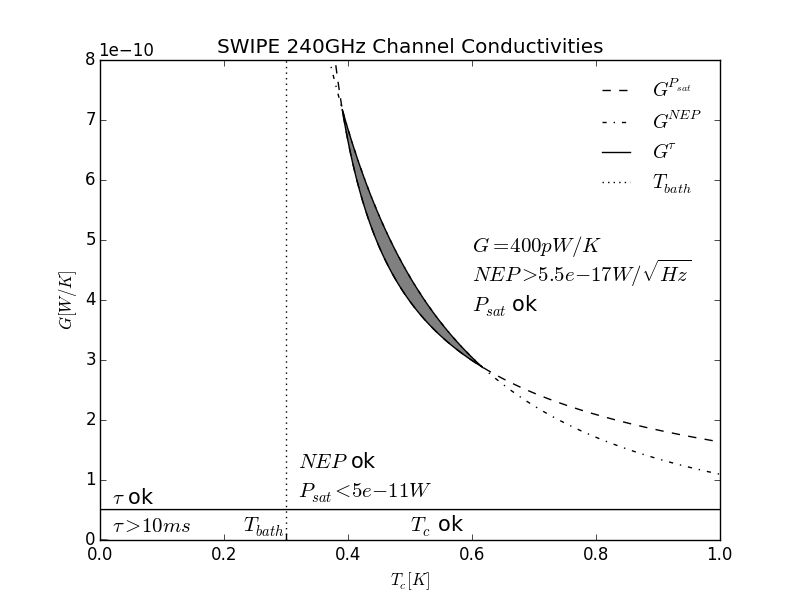
Each inequality defines the space parameters in which noise performance of the system are preserved (8), the experiment base temperature and power on the detectors is taken into account (9) as well as the detector’s time constant, constrained by the scanning strategy (10).


6 Results and Conclusions
The allowed parameters space for and is depicted as shaded regions in plots of Fig. 1 and the optimal values for the parameters are reported in Table 1.
For , the allowed regions are on the upper side of the curves and respectively. For the the allowed region is the lower side of the curve.
From fig.1 is evident that the acceptable size of the parameter space is small.
This means that the TES bolometers construction parameters need to be fine-tuned to the incident power load with even more care as for single mode TES.
Just as we adopt multimode optics to collect the radiation, the incident power is higher than single mode ones.
In the specific case of the multi-moded detectors of LSPE, we have demonstrated with this study that it is indeed possible to find a solution optimizing TES detectors performance, but this requires exquisite
control of fabrication parameters and a very careful model of the power load on the detectors in all the phases of detector use.
| Frequency [GHz] | |||
|---|---|---|---|
References
- (1) L. Lamagna et al.,in Proceedings of the 36th Antenna Workshop on Antennas and RF Systems for Space Science, 6-9 Oct 2015, ESTEC, Noordwijk, The Netherlands (2015), in press
- (2) The LSPE Collaboration, ArXiv e-prints, 1208.0281, (2012), http://adsabs.harvard.edu/abs/2012arXiv1208.0281T
- (3) P. de Bernardis et al., Society of Photo-Optical Instrumentation Engineers (SPIE) Conference Series 8452, (2012), DOI:10.1117/12.926569
- (4) Lamagna et al., International Conference on Electromagnetics in Advanced Applications (ICEAA), 1201-1204, (2013), DOI: 10.1109/ICEAA.2013.6632435
- (5) M. Biasotti et al., Society of Photo-Optical Instrumentation Engineers (SPIE) Conference Series 9153, (2014), DOI: 10.1117/12.2057071
- (6) S. Hanany et al., astro-ph/9801291 299, 653-660, (1998), DOI: 10.1046/j.1365-8711.1998.01705.x
- (7) M. Biasotti et al., J. Low Temp. Phys., This Special Issue (2015)
- (8) K. D. Irwin et al., Journal of Applied Physics, 8, 3978-3985, (1998), DOI: 10.1063/1.367153
- (9) M. Dobbs et al., Review of Scientific Instruments 83, 7, (2012), DOI: 10.1063/1.4737629
- (10) J. M. Lamarre, Applied Optics 25, 870-876, (1986), DOI: 10.1364/AO.25.000870
- (11) K. D. Irwin et al., Cryogenic Particle Detection, 63, (2005), DOI: 10.1007/10933596_3
- (12) W. B. Tiest et al., Proceedings of the 10th International Workshop on Low Temperature Detectors, 520, 1-3, 329-332, (2004), DOI: 10.1016/j.nima.2003.11.259