ALMA observations of the submillimetre hydrogen recombination line from the type 2 active nucleus of NGC 1068
Abstract
Hydrogen recombination lines at the submillimetre band (submm-RLs) can serve as probes of ionized gas without dust extinction. One therefore expects to probe the broad line region (BLR) of an obscured (type 2) active galactic nucleus (AGN) with those lines. However, admitting the large uncertainty in the continuum level, here we report on the non-detection of both broad and narrow H26 emission line (rest frequency = 353.62 GHz) towards the prototypical type 2 AGN of NGC 1068 with the Atacama Large Millimeter/submillimeter Array (ALMA). We also investigate the nature of BLR clouds that can potentially emit submm-RLs with model calculations. As a result, we suggest that clouds with an electron density () of 109 cm-3 can mainly contribute to broad submm-RLs in terms of the line flux. On the other hand, line flux from other density clouds would be insignificant considering their too large or too small line optical depths. However, even for the case of cm-3 clouds, we also suggest that the expected line flux is extremely low, which is impractical to detect even with ALMA.
keywords:
galaxies: active – galaxies: individual: NGC 1068 – radio lines: galaxies1 Introduction
Since the proposition of the unification scheme of an active galactic nucleus (AGN; Antonucci 1993), it has been supposed that a type 2 AGN contains a type 1 nucleus having a broad line region (BLR) of ionized material, which is obscured by a dusty torus at short wavelengths such as optical. The detection of the broad H i recombination line (RL, hereafter) in the polarized light from the prototypical type 2 Seyfert NGC 1068 (e.g., Antonucci & Miller 1985; Alexander et al. 1999) constitute the basis of this classical model. On the other hand, direct detection of the BLR components at the wavelengths least influenced by the dust attenuation will be another way to better understand the unification mechanism. Although some works succeeded in detecting relatively broad ( 1000–3000 km s-1) RLs (e.g., Goodrich et al. 1994; Veilleux et al. 1997, 1999; Lutz et al. 2002) in type 2 Seyfert galaxies at near-infrared (NIR), these detections seem to be biased towards less-obscured type 2 or intermediate type AGNs (e.g., Lutz et al. 2000; Lutz et al. 2002). Here, the ability of penetrating columns of 1023-24 cm-2 expected for the NIR band (e.g., Alonso-Herrero et al. 1997) would be insufficient to probe a sizeable fraction of Compton-thick AGNs ( 1024 cm-2). Indeed, previous studies failed to detect NIR broad RLs firmly from such Compton-thick objects (e.g., Goodrich et al. 1994; Lutz et al. 2000; Cai et al. 2010; Mason et al. 2015). This problem can be severer in probing extremely obscured nuclei whose energy sources are elusive ( 1025-26 cm-2, e.g., Sakamoto et al. 2013; Aalto et al. 2015). However, at least in the nearby universe, hard X-ray observations suggest that Compton-thick AGNs are comparable or even larger in number density than less obscured AGNs (e.g., Risaliti et al. 1999; Burlon et al. 2011; Lansbury et al. 2015). Therefore, longer wavelengths observations that directly probe those heavily obscured BLRs are highly desired to investigate its nature as well as to examine the applicability of the unified scheme to such an extreme population (e.g., Buchner et al. 2015; Davies et al. 2015).
From this perspective, we considered that submillimetre H i RLs (submm-RLs, hereafter) would provide a way as they do not suffer from dust extinction. As is not the case of centimetre RLs, submm-RLs would not be affected by potential maser amplification (Gordon & Walmsley 1990). Moreover, it is easy to achieve quite high-velocity resolution at submillimetre that enables us to study kinematics of the nuclear regions in detail. One critical issue has been the intrinsically very faint nature of the submm-RLs, but this would now be overcome thanks to the advent of The Atacama Large Millimeter/submillimeter Array (ALMA), which provides unprecedented sensitivity and resolution. Indeed, Scoville & Murchikova (2013, hereafter SM13) predicted that both thermal freefree continuum and submm-RL emissions from narrow line regions (NLRs) of luminous nearby galaxies are readily detectable with ALMA. It is therefore the time to test the detectability of submm-RLs of the BLR-origin with the actual ALMA data.
In this paper, we present our ALMA Cycle 2 observations of the submm-RL, H26 (rest frequency = 353.62 GHz), towards the centre of NGC 1068 ( = 14.4 Mpc; Tully 1988). This galaxy hosts a Compton-thick AGN ( 1025 cm-2; e.g., Marinucci et al. 2016), thus is one of the best targets to demonstrate the capability of submm-RLs to study heavily dust-obscured nuclei. Note that several attempts have been done so far towards this AGN to detect broad H i RLs: Lutz et al. (2000) observed Br 2.63 m and Pf 7.46 m emission but could not detect broad lines likely due to severe dust extinction. No significant emission of H40 ( = 99.02 GHz) and H53 ( = 42.95 GHz) lines were detected with single dish measurements as well at least partly due to insufficient sensitivity (Puxley et al. 1991).
2 Data analysis
We observed NGC 1068 with ALMA on 2015 June 15 with 37 antennas as a Cycle 2 science program (ID = 2013.1.00188.S, PI: M. Imanishi). The baseline length spans from 21.4 to 783.5 m, which corresponds to the range of 25.0 to 914.2 k at 350 GHz. The nuclear region of NGC 1068 was entirely covered with a single pointing with an 18 arcsec field of view. Throughout the work, the location of the AGN is set to (, = 02h42m40710, 00∘00′47938), which is defined by high-resolution interferometric observations at 6 cm (e.g., Gallimore et al. 2004). The receiver was tuned to cover the redshifted HNC( = 4–3) line ( = 362.63 GHz) in the upper side band (USB), and the redder side of H26 H i RL ( = 353.62 GHz) relative to the systemic velocity ( = 1137 km s-1; Huchra et al. 1999) in the lower side band (LSB). Each of four spectral windows (Spw 0, 1 = USB and Spw 2, 3 = LSB) has a bandwidth of 1.875 GHz, which yields 7.5 GHz width in total. Note that we could not cover the entire velocity range of the hypothesized broad H26 because the LSB has only 3180 km s-1 width in total for this line. In this paper, we focus on this H26 line and the underlying continuum emissions only.
The velocity spacing of the LSB was originally 0.42 km s-1 per channel, but 120 channels were binned to improve the signal-to-noise ratio, which resulted in the final velocity resolution of d 50 km s-1. This is high enough to resolve the hypothesized broad line component, which has a full width at zero intensity (FWZI) of 7500 km s-1 as seen in the polarized spectrum of H (Antonucci & Miller 1985). It is also enough to moderately resolve the typical width of NLR-lines of NGC 1068 ( 500 km s-1; Müller-Sánchez et al. 2011). The bandpass, phase, and flux were calibrated with J0224+0659, J0239+0416, and Ceres, respectively. The total on-source time was 35 min.
The reduction, calibration, and subsequent analysis were conducted with CASA
version 4.3.0 (McMullin et al. 2007) in standard manners.
All images were reconstructed by the CASA task CLEAN.
Continuum subtraction can be problematic in the LSB because all channels
would contain the BLR component due to the limited band width.
Therefore, we show the spectrum of the LSB without continuum subtraction in this work.
The information on the continuum emission is extracted from the USB instead (Section 3).
The full width at the half-maximum (FWHM) of the achieved synthesized beam was
= 0.37 arcsec 0.31 arcsec,
which corresponds to 26 pc 22 pc at the distance of NGC 1068.
The 1 sensitivity is 0.42 mJy beam-1
at d = 50 km s-1 for the LSB (estimated from the areas free from emission),
whereas 1 = 0.19 mJy beam-1 for the USB continuum emission,
which is surely free from the contamination of the broad H26 line.
3 Results
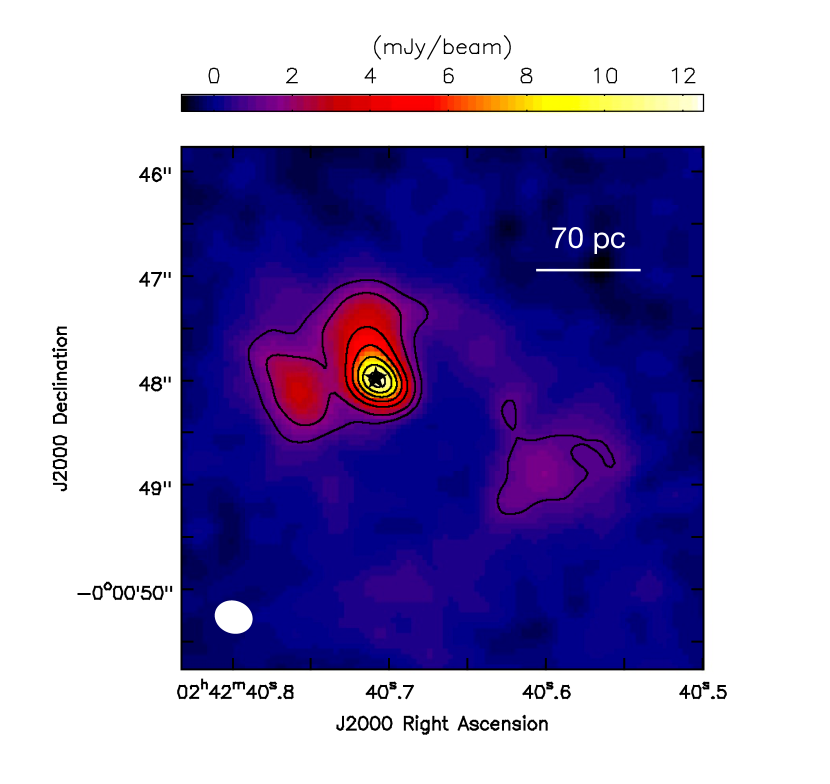
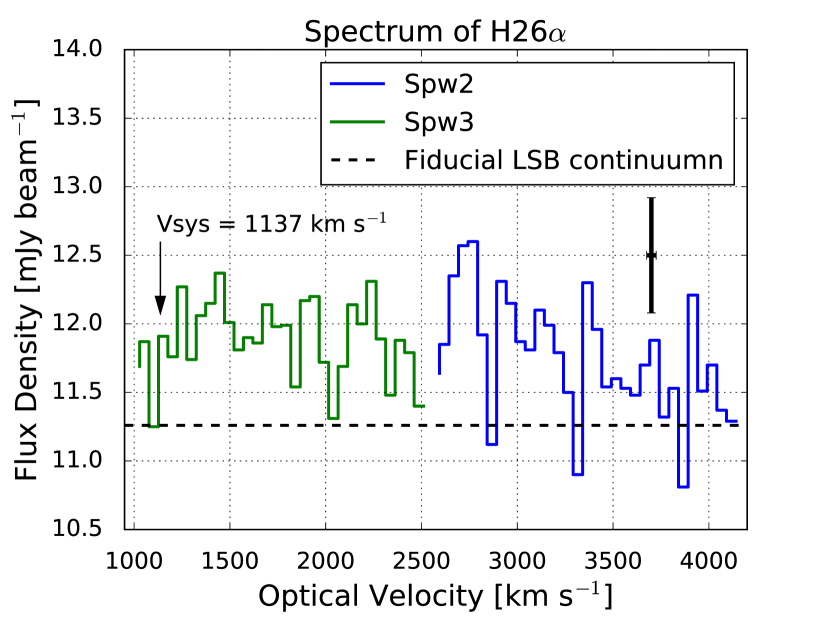
Fig. 1 shows the spatial distribution of the USB continuum emission centred at = 364 GHz towards the nuclear region of NGC 1068. This distribution is well consistent with that of the 349 GHz continuum emission (García-Burillo et al. 2014). The emission is clearly detected and peaks at the precise AGN position (11.72 mJy beam-1), which suggests this is of AGN origin. Fig. 2 displays the LSB spectrum extracted at the AGN position with a single aperture. The plotted range corresponds to almost the redder half of the FWZI of the polarized broad H (Antonucci & Miller 1985).
Next, we estimate the continuum level at the LSB using that at the USB. So far, three models have been mainly proposed to explain the centimetre to submillimetre nuclear spectral energy distribution (SED) of NGC 1068 (see Krips et al. 2011 and references therein): () pure synchrotron model, ( thermal freefree model111The origin of this freefree emission was modelled (Hönig et al. 2008) to have a modest electron density (8 105 cm-3) and a very high temperature (1.3 106 K). Hence, the dominant origin would not be the BLR clouds., and () electron-scattered synchrotron model. These models consider a significant contribution from thermal dust emission as well. Among them, previous studies supported the models () and () equally (e.g., Krips et al. 2011; García-Burillo et al. 2014), but disfavoured the model (). However, we find that even these preferred two models overestimate our USB continuum level by 2 times, judging from their proposed formulations. Indeed, the lack of high-resolution photometry at far-infrared, as well as different apertures used in previous works at centimetre to submillimetre, altogether make the accurate SED modelling quite difficult. A highly time variable nature of AGN-originated emission even at millimetre to submillimetre (e.g., Baldi et al. 2015) also hinders such a challenge.
We then simply give a crude estimate on the LSB continuum level by assuming that the USB continuum emission is composed of (1) thermal dust emission from both the dusty torus and the extended cold dust (50 per cent contribution to the total USB emission), (2) thermal freefree emission from both the BLR and the NLR (25 per cent), and (3) synchrotron emission from the jet (25 per cent). Indeed, García-Burillo et al. (2014) suggested that 50 per cent continuum at the ALMA Band 7 stems from non-dust components. Assuming typical slopes () of the flux scaling ( ) that are 3.5, 0.15, 1.0 for the above three components, respectively (e.g., Draine 2011), we estimate the LSB continuum level to be 11.26 mJy beam-1. Note that varying the freefree to synchrotron ratio only slightly modify this estimation, which does not influence the following discussion. Moreover, the free-free continuum levels at the USB and the LSB are almost identical irrespective of its contribution to the total continuum flux and its spectral index.
Back to Fig. 2 with keeping this fiducial continuum level in mind, one would see that there seems to be some excess in the flux over a wide velocity range, which can be the broad H26 emission line. However, this excess in each channel is still below the 3 limit of our observations (1.26 mJy beam-1). Moreover, the amount of the excess strongly depends on the actual continuum level, which is hard to determine at this moment. Considering this situation, we call this marginal excess at the LSB as non-detection. Although this view is not conclusive, we nevertheless summarize our current estimates in Table 1.
Although it is not detected convincingly, the potential existence of the broad submm-RL is an appealing topic to investigate. Therefore, in the following, we discuss the nature of the hydrogen clouds that can actually emit broad H26 line with invoking simple theoretical calculations, as well as the detectability of submm-RLs with future high-sensitivity observations. These predictions can be tested with future high-resolution, high-sensitivity, and quasi-synchronized observations over a velocity range enough to cover the entire (hypothesized) broad H26 line emission.
| Emission | Peak flux | Peak flux | |||
|---|---|---|---|---|---|
| (GHz) | (mJy beam-1) | (mK) | (Jy beam-1 km s-1) | (K km s-1) | |
| H26 (red side) | 353.62 | 1.26 | 107 | 4.02 | 342 |
| Continuum (USB) | 363.98 | 11.260.19 | 95615 |
Note. For H26, we list 3 upper limit on the peak values that are appropriate for both the broad and the narrow components at the velocity resolution of 50 km s-1. The integrated intensity was calculated by assuming the Gaussian profile with the FWHM of 3000 km s-1 (Alexander et al. 1999), having the peak flux of the above 3 value.
4 Discussion
Since the electron volume density () and line optical depths are extremely large in BLRs compared to those in typical H ii regions, the so-called Case-B approximation would not be appropriate in a strict sense. However, previous studies support the fairy good resemblance between the observed line flux ratios and the theoretical values under the Case-B condition (see Netzer 1990 and references therein). Therefore, we adopted the model-calculated parameters of H i RLs under the Case-B condition by Storey & Hummer (1995) as our best estimate at first. Their values were used in SM13 as well for the cases of 108 cm-3. Then, we expand the theoretical basis by SM13 towards higher in this work. We investigate several cases of a gas cloud with uniform density and temperature as BLRs likely to have clouds with various physical conditions. Note that we use to express the volume density to avoid confusion with the principal quantum number .
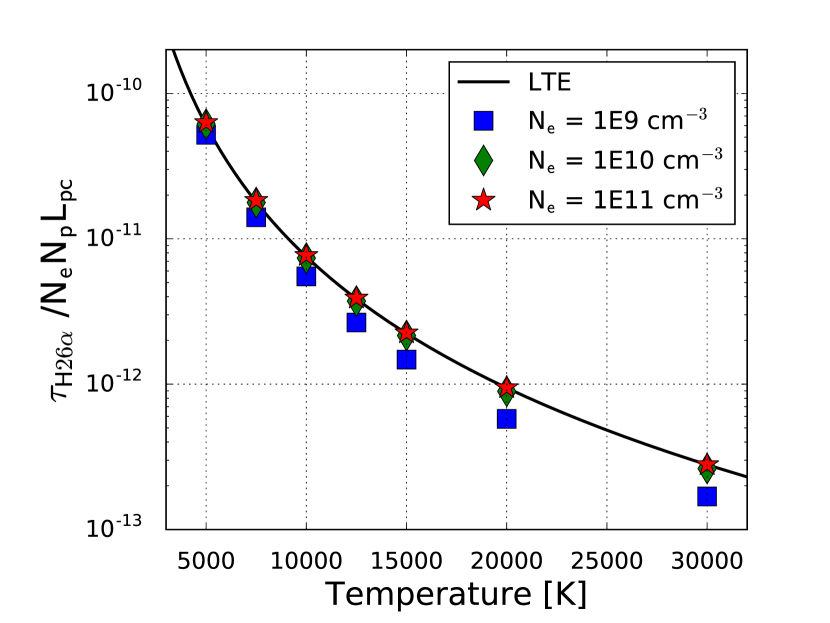
At the high densities suggested in BLRs ( 108 cm-3), one can expect level populations are in the local thermal equilibrium (LTE) especially for large . Indeed, the departure coefficient from the LTE () calculated by Storey & Hummer (1995) clearly shows 1 at 108 cm-3 for 20 (a range containing submm-RLs), i.e., no departure from the LTE. Fig. 3 shows the optical depth parameter of H26 calculated by Storey & Hummer (1995) as a function of and electron temperature (), which is related to the line centre optical depth as
| (1) |
where is the line-of-sight path length (Hummer & Storey 1987). Thus, the gives the optical depth per unit emission measure (EM), which is defined as
| (2) |
is the proton volume density. The thermal Doppler width ( 21.5 km s-1 at = 104 K for H i) is assumed in Fig. 3 as we primarily treat a single cloud existing in BLRs. Although this width shall be regarded as just the first-order approximation (e.g., Peterson 1997; Dietrich et al. 1999), we suppose that a line width up to a few 100 km s-1 would not alter our conclusions significantly. Note that is inversely proportional to the line width.
As is expected from the quasi-LTE condition, we can see from Fig. 3 that the line optical depth is approaching to the following LTE solution under the ionization equilibrium:
| (3) |
Hence, we will discuss under the LTE condition hereafter. Substituting typical values supposed for BLRs (e.g., Ferland et al. 1992; Peterson 1997; Dietrich et al. 1999; Osterbrock & Ferland 2006), namely, = = 109 cm-3, = 104 K, and = 20 r⊙ = 4.5 10-7 pc (the path length of a single cloud; radius = 10 r⊙ in this case), we obtain an optical depth of H26 as 3.4, i.e., the line emission is (moderately) optically thick in this case. This, reflecting the quite high EM in BLRs adopted here, is a striking difference from the cases in H ii regions, where the submm-RLs are always optically thin.
On the other hand, in the thermal plasma with 104 K, the thermally averaged gaunt factor (Lang 1980) is,
| (4) |
With this formula, an optical depth of the freefree emission is
| (5) |
Substituting the above-adopted parameters, we obtain 0.65 at 350 GHz for the BLR emission, i.e., thermal freefree emission is moderately optically thin. Therefore, we can expect a relatively high peak line flux to continuum ratio,
| (6) |
of 1.0 in this case. We used the formalism by, e.g., Bell & Seaquist (1978), for this estimation. A potential contamination due to stimulated emission caused by the background non-thermal radiation is neglected for simplicity. The high 0 seems to open a way to detect the broad submm-RL, if clouds with 109 cm-3 are the dominant contributor to the BLR flux at submillimetre. Moreover, as both and are functions of and EM, we can estimate one parameter when the other is known independently. However, that situation is disfavoured in an actual observational sense as discussed hereafter.
We then speculate upon the expected peak flux density of H26 line to the observer (). Under the conditions described above, the intrinsic peak brightness temperature of H26 line is 0.5 = 5000 K. Suppose that a single blackbody cloud (radius = 10 r⊙) at this temperature is radiating, an expected peak flux density from the cloud is 1.48 10-14 Jy for the case of NGC 1068. As we have assumed that a single cloud has the thermal width of 21.5 km s-1, an expected integrated intensity under the Gaussian line profile is then = 3.38 10-13 Jy km s-1. This value will be multiplied by a number of BLR clouds contributing to the observed flux to estimate .
To do so, we first estimate the effective source size of the line-emitting region in the BLR. Reverberation mapping observations towards type 1 AGNs revealed that the innermost radius of a dusty torus, , is proportional to the square root of the AGN luminosity (e.g., Suganuma et al. 2006). To estimate the of NGC 1068, we first employed [O iv] luminosity, which is considered to be an isotropic proxy of the AGN power (e.g., Diamond-Stanic et al. 2009), thus is more likely to be applicable to obscured AGNs. Using the compiled data in Diamond-Stanic et al. (2009), we find that of NGC 1068 would be 1.5 times larger than that of the type 1 Seyfert NGC 7469. Note that these AGNs have comparable (absorption corrected) X-ray luminosity as well (Liu et al. 2014; Marinucci et al. 2016), which supports the view that they have accretion discs with a similar condition. As the reverberation mapping by Koshida et al. (2014) revealed that of NGC 7469 is 100 light-days, we deduce that of NGC 1068 would be 150 light-days (0.13 pc). This is much larger than the expected blackbody radius of NGC 1068 for 104 K ( 0.005 pc), indicating net radiative excitation (absorption minus stimulated emission; SM13) is insignificant for this BLR.
For optically thick emission, an areal covering factor (), rather than a volume-filling factor, is important to estimate the effective source size. So far, simple speculation on the equivalent width of Ly yields 0.1 (Peterson 1997) in BLRs. Therefore, the total H26 flux expected for NGC 1068 can be,
| (7) |
which is indeed below the 3 detection limit of our observations (4.02 Jy km s-1 for the single beam; Table 1). Although readers would scale this value with their own parameters, with this estimation, we consider that our non-detection of the broad H26 line is primarily due to our limited sensitivity. Furthermore, it is virtually impossible to achieve a high sensitivity enough to detect the above flux significantly (e.g., 10 detection) even with ALMA, as the expected peak flux density is a few 10 Jy. On the other hand, we will achieve a 1 sensitivity222https://almascience.nrao.edu/proposing/sensitivity-calculator of only 5 Jy even with 100 days on-source integration at a velocity resolution of 100 km s-1.
When the electron density is high ( 1010 cm-3), the situation becomes essentially different since both the H26 line and the underlying freefree continuum emissions are now optically thick. In this case, 0 is realized, whereas the continuum emission is maximally emitted as the blackbody. Hence, again one can never detect the line component from these extremely high-density clouds. For clouds with the low-end expected for BLRs ( 108 cm-3), where both the H26 line and the freefree emissions are optically thin, we find that 5. However, the very low optical depth ( = 0.03) leads the emission to be totally transparent, which cannot be detected at all.
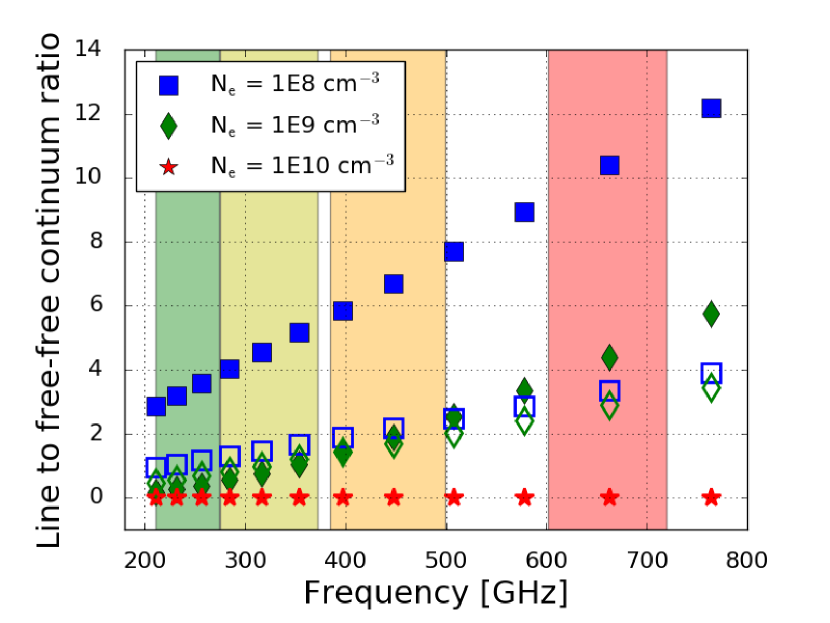
Under the LTE condition, we expand the above speculations to other submm-RLs that can be observed with ALMA (redshift = 0 is assumed here). The resultant of H31 to H20, as well as the frequency coverages of the ALMA Bands 6 to 9 are shown in Fig. 4. Lower frequency cases (e.g., H40) are not displayed since their approach to 0 for 109 cm-3 due to large optical depths. We varied and whereas is fixed to 20 r⊙. Thus, = 109 cm-3 corresponds to EM = 4.5 1011 cm-6 pc. As already explained, one can see that 0 for = 108 cm-3 and 109 cm-3 cases but 0 for = 1010 cm-3 (or higher) case. We note that submm-RLs from = 108 cm-3 clouds are totally optically thin and are hard to be detectable. Therefore, BLR clouds with 109 cm-3 would be the dominant contributor to the H flux. Even so, however, we again find that the line fluxes of any H are intrinsically as extremely faint as calculated above, for virtually all imaginable sets of physical parameters expected in BLRs. Hence, we suppose that it is very impractical to detect submm-RLs of the BLR-origin even with ALMA.
At centimetre wavelengths, on the other hand, one would expect to see BLR lines as absorption against bright synchrotron emission with 104 K, if a synchrotron source (e.g., jet core) is embedded in the BLR, which is an analogous to observations of H i absorption line at 21 cm (e.g., Momjian et al. 2003). This detection requires a quite high resolution (e.g., sub-pc scale) because otherwise the surrounding jet component would contaminate the continuum level. While Very Long Baseline Interferometry systems seem to have this capability ( 90 RLs shall be observed), their narrow bandwidths are eventually problematic in actual observations. Moreover, if the synchrotron emission in NGC 1068 has an electron-scattered nature as suggested by Krips et al. (2011), the absorption feature would be outshone by that scattered light. Therefore, it would be quite difficult to detect the BLR components at centimetre bands.
In the last of this article, we mention that a similar speculation in this work can be applied for the non-detection of H26 line of NLR-origin as well. Suppose that ionized gas with NLR-like parameters (e.g., = 104 K, = = 104 cm-3) is filling a spherical volume within our observing beam ( 24 pc in radius), Equations (11), (13), and (17) of SM13 yields an integrated H26 intensity to be 135 Jy km s-1. This is 200 times larger than our 3 detection limit of 0.67 Jy km s-1 (500 km s-1 FWHM is assumed; Müller-Sánchez et al. 2011). Considering that submm-RLs of NLR-origin are likely to be optically thin (SM13), this discrepancy can be largely attributed to a small volume-filling factor of ionizing clouds. From our observations, that factor is estimated to be 5 10-3, which is consistent with the canonical value for NLRs, 10-2 (Peterson 1997).
5 Summary and Conclusions
In this work, we tried to detect a submm-RL of H26 stemming from the heavily dust-obscured BLR of NGC 1068 with high-resolution ALMA Cycle 2 observations. Our key results are as follows.
-
•
Admitting the uncertainty in the continuum level due to the limited bandwidth to fully cover the hypothesized line width, we found the non-detection of both broad and narrow H26 emission line towards the nucleus of NGC 1068 at the 3 sensitivity of 1.26 mJy at d = 50 km s-1 (0.37 arcsec 0.31 arcsec = 26 pc 22 pc beam). Note that this non-detection is not conclusive when we adopt a lower continuum level, which is hard to determine accurately at this moment.
-
•
We investigated the nature of BLR clouds that can potentially emit broad submm-RLs under the LTE condition. As a result, we suggest 109 cm-3 components mostly contributes to line emission. From clouds with other densities, we will not see broad submm-RLs due to too large or too small optical depths. 109 cm-3 is typical for BLRs. However, an expected line flux even for this = 109 cm-3 case is extremely faint based on our calculation. Hence, our non-detection of broad H26 is due to the limited sensitivity. We note that one can virtually never achieve high enough sensitivity to detect such faint emission even with ALMA.
-
•
We predicted a line-to-continuum ratio of various H at submillimetre to investigate whether the line components can appear. As a result, although some combinations of parameters can yield the broad line component in principle, again we cannot detect them due to the limited sensitivity of currently available submillimetre instruments.
Considering the discussion in Section 4, as well as the limited column penetrating capability at NIR wavelength, one possible way to directly detect obscured BLR lines is to employ sensitive mid-IR observations. Such a chance will be provided with the Mid-infrared Instrument (MIRI)333http://jwst.nasa.gov/miri.html on board the James Webb Space Telescope (JWST)444http://www.jwst.nasa.gov. That instrument can cover = 5–8 H i RLs at redshift zero, with the 10 detection limit of 1 10-20 W m-2 for a point source (at 10 m, with 10 000 s). However, careful treatment on the departure from the LTE as well as the influence from both thermal (from an accretion disc and a dusty torus) and non-thermal continuum radiation is necessary to predict the detectability.
Acknowledgements
We thank the anonymous referee for his/her kind and encouraging suggestions to improve this article. This paper makes use of the following ALMA data: ADS/JAO.ALMA#2013.1.00188.S. ALMA is a partnership of ESO (representing its member states), NSF (USA), and NINS (Japan), together with NRC (Canada) and NSC and ASIAA (Taiwan), in cooperation with the Republic of Chile. The Joint ALMA Observatory is operated by ESO, AUI/NRAO, and NAOJ. The National Radio Astronomy Observatory is a facility of the National Science Foundation operated under cooperative agreement by Associated Universities, Inc. KN acknowledges support from JSPS KAKENHI Grant Number 15K05035. TI is thankful for the fellowship received from the Japan Society for the Promotion of Science (JSPS).
References
- Aalto et al. (2015) Aalto S., et al., 2015, A&A, 584, A42
- Alexander et al. (1999) Alexander D. M., Young S., Hough J. H., 1999, MNRAS, 304, L1
- Alonso-Herrero et al. (1997) Alonso-Herrero A., Ward M. J., Kotilainen J. K., 1997, MNRAS, 288, 977
- Antonucci (1993) Antonucci R., 1993, ARA&A, 31, 473
- Antonucci & Miller (1985) Antonucci R. R. J., Miller J. S., 1985, ApJ, 297, 621
- Baldi et al. (2015) Baldi R. D., Behar E., Laor A., Horesh A., 2015, MNRAS, 454, 4277
- Bell & Seaquist (1978) Bell M. B., Seaquist E. R., 1978, ApJ, 223, 378
- Buchner et al. (2015) Buchner J., et al., 2015, ApJ, 802, 89
- Burlon et al. (2011) Burlon D., Ajello M., Greiner J., Comastri A., Merloni A., Gehrels N., 2011, ApJ, 728, 58
- Cai et al. (2010) Cai H.-B., Shu X.-W., Zheng Z.-Y., Wang J.-X., 2010, Res. Astron. Astro-phys., 10, 427
- Davies et al. (2015) Davies R. I., et al., 2015, ApJ, 806, 127
- Diamond-Stanic et al. (2009) Diamond-Stanic A. M., Rieke G. H., Rigby J. R., 2009, ApJ, 698, 623
- Dietrich et al. (1999) Dietrich M., Wagner S. J., Courvoisier T. J.-L., Bock H., North P., 1999, A&A, 351, 31
- Draine (2011) Draine B. T., 2011, Physics of the Interstellar and Intergalactic Medium. Princeton Univ. Press, Princeton, NJ
- Ferland et al. (1992) Ferland G. J., Peterson B. M., Horne K., Welsh W. F., Nahar S. N., 1992, ApJ, 387, 95
- Gallimore et al. (2004) Gallimore J. F., Baum S. A., O’Dea C. P., 2004, ApJ, 613, 794
- García-Burillo et al. (2014) García-Burillo S., et al., 2014, A&A, 567, A125
- Goodrich et al. (1994) Goodrich R. W., Veilleux S., Hill G. J., 1994, ApJ, 422, 521
- Gordon & Walmsley (1990) Gordon M. A., Walmsley C. M., 1990, ApJ, 365, 606
- Heisler et al. (1997) Heisler C. A., Lumsden S. L., Bailey J. A., 1997, Nature, 385, 700
- Hönig et al. (2008) Hönig S. F., Prieto M. A., Beckert T., 2008, A&A, 485, 33
- Huchra et al. (1999) Huchra J. P., Vogeley M. S., Geller M. J., 1999, ApJS, 121, 287
- Hummer & Storey (1987) Hummer D. G., Storey P. J., 1987, MNRAS, 224, 801
- Koshida et al. (2014) Koshida S., et al., 2014, ApJ, 788, 159
- Krips et al. (2011) Krips M., et al., 2011, ApJ, 736, 37
- Lang (1980) Lang K. R., 1980, Astrophysical Formulae. A Compendium for the Physicist and Astrophysicist.. Springer-Verlag, Berlin
- Lansbury et al. (2015) Lansbury G. B., et al., 2015, ApJ, 809, 115
- Liu et al. (2014) Liu T., Wang J.-X., Yang H., Zhu F.-F., Zhou Y.-Y., 2014, ApJ, 783, 106
- Lutz et al. (2000) Lutz D., et al., 2000, ApJ, 530, 733
- Lutz et al. (2002) Lutz D., Maiolino R., Moorwood A. F. M., Netzer H., Wagner S. J., Sturm E., Genzel R., 2002, A&A, 396, 439
- Marinucci et al. (2016) Marinucci A., et al., 2016, MNRAS, 456, L94
- Mason et al. (2015) Mason R. E., et al., 2015, ApJS, 217, 13
- McMullin et al. (2007) McMullin J. P., Waters B., Schiebel D., Young W., Golap K., 2007, in Shaw R. A., Hill F., Bell D. J., eds, Astronomical Society of the Pacific Conference Series Vol. 376, Astronomical Data Analysis Software and Systems XVI. p. 127
- Momjian et al. (2003) Momjian E., Romney J. D., Carilli C. L., Troland T. H., 2003, ApJ, 597, 809
- Müller-Sánchez et al. (2011) Müller-Sánchez F., Prieto M. A., Hicks E. K. S., Vives-Arias H., Davies R. I., Malkan M., Tacconi L. J., Genzel R., 2011, ApJ, 739, 69
- Netzer (1990) Netzer H., 1990, in Blandford R. D., Netzer H., Woltjer L., Courvoisier T. J.-L., Mayor M., eds, Saas-Fee Advanced Course 20, Active Galactic Nuclei. Springer, Berlin, p. 57
- Osterbrock & Ferland (2006) Osterbrock D. E., Ferland G. J., 2006, Astrophysics of Gaseous Nebulae and Active Galactic Nuclei, 2nd edn. University Science Books, Mill Valley, CA
- Peterson (1997) Peterson B. M., 1997, An Introduction to Active Galactic Nuclei. Cambridge Univ. Press, Cambridge
- Puxley et al. (1991) Puxley P. J., Brand P. W. J. L., Moore T. J. T., Mountain C. M., Nakai N., 1991, MNRAS, 248, 585
- Risaliti et al. (1999) Risaliti G., Maiolino R., Salvati M., 1999, ApJ, 522, 157
- Sakamoto et al. (2013) Sakamoto K., Aalto S., Costagliola F., Martín S., Ohyama Y., Wiedner M. C., Wilner D. J., 2013, ApJ, 764, 42
- Scoville & Murchikova (2013) Scoville N., Murchikova L., 2013, ApJ, 779, 75
- Storey & Hummer (1995) Storey P. J., Hummer D. G., 1995, MNRAS, 272, 41
- Suganuma et al. (2006) Suganuma M., et al., 2006, ApJ, 639, 46
- Tully (1988) Tully R. B., 1988, Nearby Galaxies Catalog. Cambridge Univ. Press, Cambridge
- Veilleux et al. (1997) Veilleux S., Sanders D. B., Kim D.-C., 1997, ApJ, 484, 92
- Veilleux et al. (1999) Veilleux S., Kim D.-C., Sanders D. B., 1999, ApJ, 522, 113