Effects of confinement between attractive and repulsive walls on the thermodynamics of an anomalous fluid
Abstract
We study by molecular dynamics simulations the thermodynamics of an anomalous fluid confined in a slit pore with one wall structured and attractive and another unstructured and repulsive. We find that the phase diagram of the homogeneous part of the confined fluid is shifted to higher temperatures, densities and pressures with respect to the bulk, but it can be rescaled on the bulk case. We calculate a moderate increase of mobility of the homogeneous confined fluid that we interpret as a consequence of the layering due to confinement and the collective modes due to long-range correlations. We show that, as in bulk, the confined fluid has structural, diffusion and density anomalies, that order in the water-like hierarchy, and a liquid-liquid critical point (LLCP). The overall anomalous region moves to higher temperatures, densities and pressure and the LLCP displaces to higher temperature compared to bulk. Motivated by experiments, we calculate also the phase diagram not just for the homogeneous part of the confined fluid but for the entire fluid in the pore and show that it is shifted towards higher pressures but preserves the thermodynamics, including the LLCP. Because our model has water-like properties, we argue that in experiments with supercooled water confined in slit pores with a width of nm if hydrophilic, and of nm if hydrophobic, the existence of the LLCP could be easier to test than in bulk, where it is not directly accessible.
I Introduction
Many experiments and simulations have shown that fluids under geometrical nano-confinement present a different structural, dynamical and thermodynamic behavior with respect to the bulk case. The study of such systems is relevant for theirs technological, experimental, and theoretical implications Bellissent-Funel et al. (1995); Schoen and Diestler (1998); Mashl et al. (2003); Mittal et al. (2008); Cicero et al. (2008); De Virgiliis et al. (2008); Giovambattista et al. (2009); Castrillón et al. (2009a, b); Mancinelli et al. (2009); Rzysko et al. (2010); Han et al. (2010); de los Santos and Franzese (2011); Schnell et al. (2011a, b); Nair et al. (2012); Paul (2012); Ferguson et al. (2012); Stewart and Evans (2012); Krott and Barbosa (2013); Sun et al. (2015); Klein and Kumacheva (1995); Thompson et al. (1992); Cui et al. (2001); Jabbarzadeh et al. (2007); Ramin and Jabbarzadeh (2013); Lorenz et al. (2009). Despite these many experimental and computational studies, the effects of a specific nano-confinement on the properties of a fluid are still under debate. It has been shown that walls with different characteristics, but in the same confinement geometry, have drastically different effects on crystal nucleation and fluid dynamics. Because in some case experiments are difficult to interpret and atomistic simulations require elaborated approaches to exclude numerical artifacts, effective potentials have been employed to study nano-confined fluids. They have the advantage to be much less computationally expensive than atomistic simulations and, even though they can not give quantitative interpretation of experiments, they can allow us to understand the mechanism behind the effect of confinement on the fluid.
Here we consider a system of particles interacting through the Continuous Shouldered Well (CSW) effective potential Franzese (2007); de Oliveira et al. (2008); Vilaseca and Franzese (2010); Leoni and Franzese (2014) confined in a slit pore. The CSW is an isotropic pairwise core-softened potential with a repulsive shoulder and an attractive well Franzese (2007); de Oliveira et al. (2008); Vilaseca and Franzese (2010), similar to other used for colloids Ryltsev et al. (2015); Denton and Löwen (1998) and water-like liquids Yan et al. (2008); Agarwal et al. (2010); Krott et al. (2015); Sun et al. (2015). It is suitable for describing globular proteins in solution Vilaseca et al. (2013), methanol hydroxyl groups Huš and Urbic (2014); Huš et al. (2014), liquid metals Vilaseca and Franzese (2011), water-like liquids de Oliveira et al. (2008) and can properly describe the hydrophobic effect of water as a solvent Hus and Urbic (2013). In particular, the CSW model reproduces density, diffusion, and structure anomalies following the water hierarchy and displays a gas-liquid and a liquid-liquid phase transition (LLPT), both ending in critical points de Oliveira et al. (2008); Vilaseca and Franzese (2010).
We adopt a slit pore confinement with a separation between the two walls of the order of ten layers of the fluid Leoni and Franzese (2014). This pore size is particularly important in nanotribology and nanofluidics of thin water films, for which there are contradictory results from measurements of the dynamical and structural properties when nanoconfined in hydrophilic and hydrophobic slit pores Khan et al. (2010).
Our slit pore is composed by an attractive wall with atomistic structure and a smooth repulsive wall. This confinement allows us to investigate at the same time the effect of both surface interactions and structures. An asymmetric (semihydrophilic) slit pore, similar but opposite to ours, is adopted in experimental studies of water nano-confined between a smooth (hydrophilic) mica wall and a structured (hydrophobic) graphene sheet Severin et al. (2012). A similar confinement has been also considered in previous theoretical works, e.g., in relation with wetting phenomena Parry and Evans (1990); Albano and Binder (2012); Swift et al. (1991). Smooth repulsive walls have been used as coarse-grained models for hydrophobic surfaces Liu et al. (2004); Krott et al. (2015).
Our motivation follows from our previous work Leoni and Franzese (2014) in which we find layering of the CSW particles, as expected. In particular, we observe that the structured attractive wall has an effect on the fluid that is stronger than the smooth repulsive wall. At low temperature we observe heterogeneous crystallization starting at the attractive wall. The crystal propagates toward the repulsive wall as decreases and density increases. At low the large of the attractive wall induces a high-density, high-energy structure in the first layer (“templating” effect). In turn, the first layer induces a “molding” effect on the second layer determining a structure with reduced energy and density, closer to the average density of the system. This low-density, low-energy structure propagates further through the layers by templating effect and can involve the entire system at low . By increasing the crystal layers near the walls became amorphous and those in the center of the slit pore become liquid. Furthermore, at low and high we observe that the dynamics is largely heterogeneous “among” and “within” the layers, with the possible formation of superdiffusive liquid veins within the crystal.
We find that the homogeneous fluid at the center of the slit pore has a phase diagram with the same features as the bulk: a gas-liquid critical point (GLCP), a liquid-liquid critical point (LLCP), and a water-like cascade of anomalies, with the structural-anomaly region, the diffusion-anomaly region and the density-anomaly region including one the other in succession. However, we find that the confinement strongly enhances the structure and accelerates the dynamics with respect to the bulk, broadening the anomalous regions with a shift of the characteristic , and pressure towards values higher than those in bulk. Furthermore, we find that in confinement the LLCP shifts towards higher than in bulk and that the -increase is even stronger if we calculate the phase diagram averaging over the entire fluid inside the pore, including the heterogeneous part.
The paper is organized as follows. In Section II we describe the model and the simulation method. In Section III we show our results about the phase diagram and the anomalies of the homogeneous fluid, comparing the confined and the bulk case. In Section IV we calculate the phase diagram under confinement including the heterogeneous part of the fluid. In Section V we discuss our results and give our conclusions.
II Model and Method
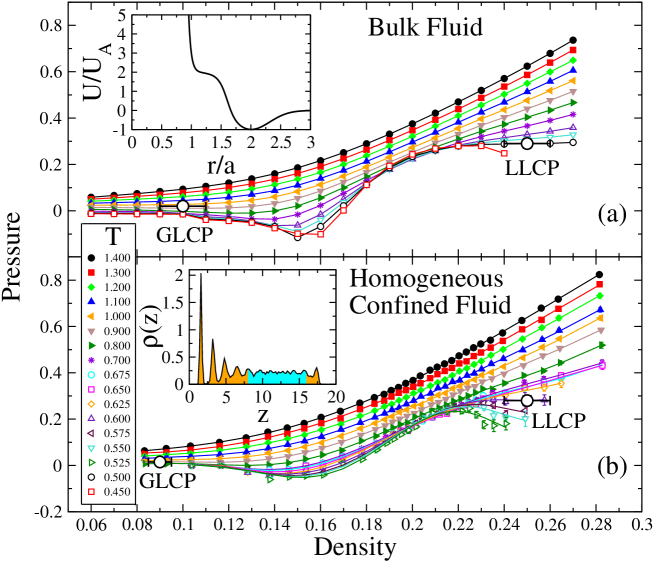
We consider the anomalous fluid described by the CSW effective potential (inset Fig. 1a) defined as Franzese (2007); de Oliveira et al. (2008); Vilaseca and Franzese (2010); Leoni and Franzese (2014)
| (1) |
where is the diameter of the particles, and are the distance of the attractive minimum and the repulsive radius, respectively, and are the energies of the attractive well and the repulsive shoulder, respectively, is the variance of the Gaussian centered in and is the parameter which controls the slope between the shoulder and the well at . We choose the parameters , , , , as in Ref.s de Oliveira et al. (2008); Franzese (2007); Vilaseca and Franzese (2010); Leoni and Franzese (2014), and to better emphasize the anomalies in density, diffusion and structure. In order to reduce the computational cost, we impose a cutoff for the interaction potential at a distance Leoni and Franzese (2014).
The particles are confined between two parallel walls separated along the axis by a distance . The distance is large enough to have homogeneous fluid inside the pore Leoni and Franzese (2014) for a range of and comparable to that investigated for the bulk case in previous works Franzese (2007); de Oliveira et al. (2008); Vilaseca and Franzese (2010). The attractive wall is made of CSW particles quenched in a triangular lattice with constant and centered at . The repulsive smooth wall has a repulsive interaction with the CSW particles at position Varnik et al. (2000); Leoni and Franzese (2014).
We perform molecular dynamics (MD) simulations in the ensemble, with CSW particles in a constant volume . We control with the Allen thermostat Allen and Tildesley (1989) and use the velocity Verlet method Allen and Tildesley (1989) with time-step to integrate the equations of motion.
Due to the chosen interactions with the walls, not all the volume is available to the CSW particles. Following Ref. Varnik et al. (2000), the effective volume accessible to particles is , where is the section of the simulation box and is the effective distance between the plates. The effective density is . To explore different densities we change and so that we can keep and constant to exclude finite-size effects when we compare results for different . We adopt periodic boundary conditions in the and directions parallel to the walls.
In slit pore geometries the isotropic bulk pressure is replaced by the pressure parallel to the walls edited by S. Klapp and Schoen (2007); Truskett et al. (2001), with , where and are the two diagonal components of the pressure tensor along the walls. The third diagonal component gives the normal pressure , while the non-diagonal components are zero (no shear forces are present in the fluid) Varnik et al. (2000). The normal pressure can be computed as the net force along the axis per unit area acting on one of the walls and at (mechanical) equilibrium we verify that does not depend on , with for all densities Leoni and Franzese (2014). We calculate using the virial expression for the and directions Allen and Tildesley (1989)
| (2) |
where is the Boltzmann constant, and represents the thermodynamic average.
For the bulk case, after verifying that there are no relevant size effects changing the value of from to , we simulate . This value is closer to the typical number of particles in the homogeneous confined fluid (inset in Fig. 1b) minimizing the relative size effect when we compare confined and bulk systems. The bulk case with has been extensively studied in Ref.Vilaseca and Franzese (2010).
We average the thermodynamic quantities over the homogeneous confined fluid, after checking the stability of the system. The homogeneous fluid region is defined as the part of the fluid for which the following conditions are fulfilled (see Ref.Leoni and Franzese (2014)): (i) The density profile is constant (apart from fluctuations consistent with the equilibrium compressibility) with no sign of layering (absence of local maxima and minima in the density profile). (ii) In any plane parallel to the slit pore the homogeneous fluid has a structurless radial distribution function, resembling a two-dimensions section of a regular fluid. (iii) The characteristic decay time of the survival probability (SP) of a particle in a finite section parallel to the slit pore does not depend on the position of the section within the homogeneous fluid. (iv) The mean square displacement (MSD) of a particle within a finite-width section parallel to the slit pore has a diffusive regime independent on the position of the section within the homogeneous fluid.
We equilibrate the system by annealing from (although we show results only for ), where is the temperature expressed in internal units (see below). For each temperature, the system is equilibrated during time steps. We observe equilibrium (no drift in average energy and pressure) after time steps for the range of and considered here Leoni and Franzese (2014).
All our results are averaged over 10 independent samples for the confined fluid, and over 4 independent samples for the bulk. Pressure, temperature, density, diffusion constant and time are all expressed in internal units: , , , , and respectively, with unit of mass. For sake of simplicity, in the following we drop the ∗ and use the symbols and for the pressure and density, respectively, of both bulk and confined fluids, dropping the labels and “eff” if not necessary, especially when we refer to both systems at the same time.
III Results
III.1 Comparison of the confined and bulk phase diagrams: liquid-liquid critical point and density anomaly.
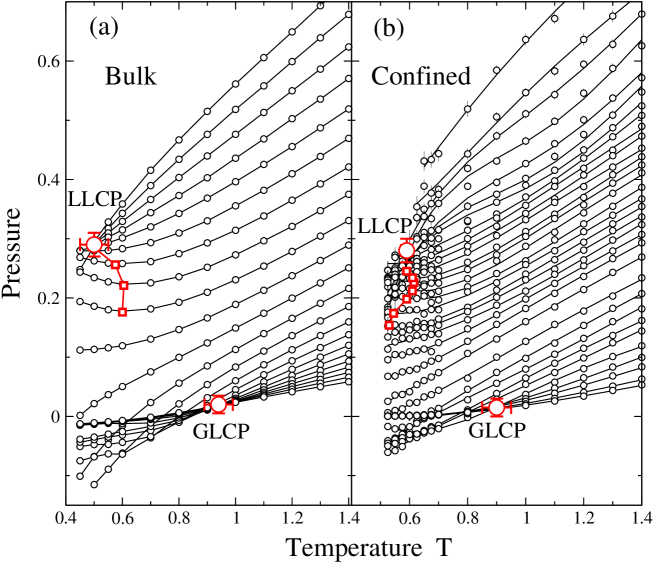
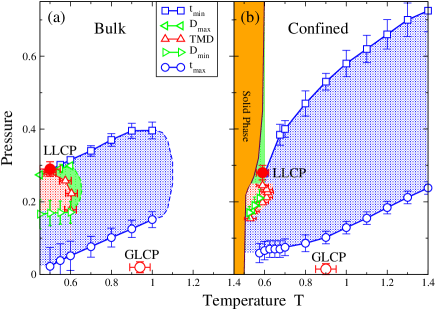
We calculate the phase diagram for the homogeneous confined fluid and for the bulk fluid finding in both cases the GLCP and the LLCP (Figs. 1 and 2). Following the standard definition, we estimate the critical point parameters (Table 1) by calculating and at high and low densities (for GLCP) or high densities (for LLCP) de Oliveira et al. (2008); Vilaseca and Franzese (2010)111We observe (Fig. 1) that the fluid phase for both bulk and confined cases corresponds to a density range smaller with respect to that of a normal fluid, as for example the Lennard-Jones (LJ). Indeed, one of the common features of the potentials for anomalous-liquids is the very low density of the liquid phase, due to the characteristic soft-core interaction. For example, the LJ potential has its minimum at interparticle distance , while the CSW has its minimum at , where is the particle diameter. Hence, for typical liquid configurations of the two systems it is , or equivalently .222By definition, the -derivative of the critical isotherm is zero. From the other hand, the point where minimia and maxima showen by isotherms meet (corresponding to ), identify the critical point..
The comparison of the critical values for the confined fluid and for the bulk fluid (Table 1) reveals that the confinement changes the critical temperature of LLCP. In particular, for the confined case is % larger than the bulk value.
For both bulk and confined fluid we find minima along isochores and we identify the line of temperatures of maxima density (TMD) by calculating numerically and (Fig. 2). As seen for the bulk de Oliveira et al. (2008); Vilaseca and Franzese (2010), we observe that the TMD line converges toward the LLCP in the - plane.
| CP | Density GL | Pressure GL | Temp. GL | Density LL | Pressure LL | Temp. LL |
|---|---|---|---|---|---|---|
| Bulk | 0.1000.010 | 0.0200.015 | 0.940.05 | 0.250.01 | 0.290.02 | 0.500.05 |
| Confined | 0.0900.005 | 0.0150.015 | 0.900.05 | 0.250.01 | 0.280.02 | 0.590.02 |
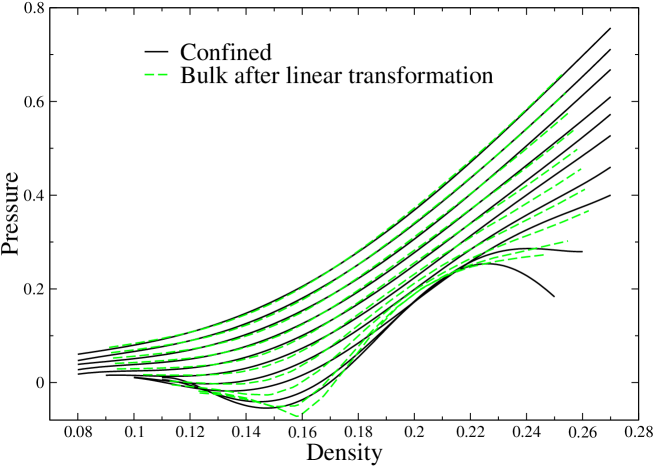
It is interesting to ask if the knowledge of the phase diagram of the confined fluid can give us information about the bulk system. To this goal we look for a simple global transformation that could fairly rescale the entire set of bulk on the confined isotherms. In particular, we test if such a rescale is possible by applying a transformations and to the bulk quantities, where the coefficients , , and depend linearly on the temperature as with and constant and so on for , and . To optimize the rescaling we minimize the cumulative deviation
| (3) |
where refers to the temperature of the -th isotherm and is the density range of comparison.
We find (Fig. 3) that there is a linear transformation that fairly superimposes the two set of isotherms at high temperatures, while at low we observe deviations. In particular, for the two set of isotherms are qualitatively and quantitatively closely related, while for the deviations are strong at high densities but there is still a qualitative agreement at intermediate densities corresponding to the low density liquid phase.
III.2 Structural anomaly
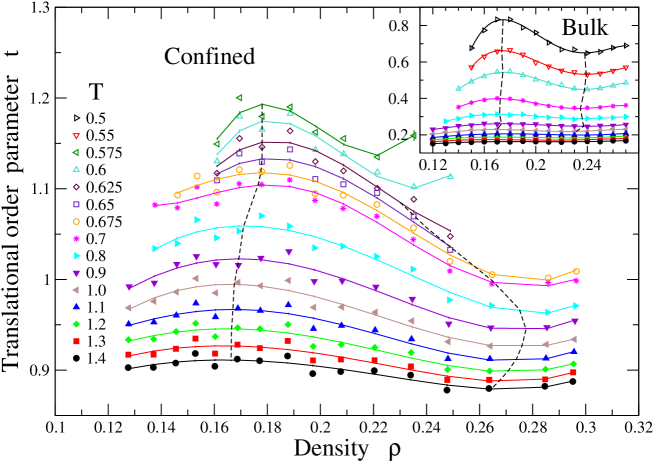
The translational order in a fluid can be estimated by the quantity Shell et al. (2002a); Errington and Debenedetti (2001); Errington et al. (2003)
| (4) |
where is the distance in units of the mean interparticle separation and is the radial distribution function. For an ideal gas at any distance, hence corresponding to the absence of translational order. For a normal fluid at constant and increasing , the deviation of from 1 increases monotonically, implying a monotonic increase of .
For the CSW bulk fluid at low enough there is a range of within which the order parameter decreases for increasing along isotherms de Oliveira et al. (2008); Vilaseca and Franzese (2010). This anomalous behavior indicates that the translational order is progressively reduced for increasing . At high enough , the CSW bulk fluid recovers the normal behavior with increasing for increasing Vilaseca and Franzese (2011); Errington and Debenedetti (2001).
Here we investigate how the confinement affects this property. For the homogeneous fluid sub-region in the confined system we calculate as in Eq. (4) integrated up to a cutoff distance , where is the thickness of the homogeneous sub-region, because we observe that for .
We find that has maxima and minima for , delimiting an anomalous region (Fig. 4). We observe that for the confined CSW fluid the anomaly in extends at and that are larger than for the bulk CSW fluid (Fig. 4, inset).
A striking difference is that in confinement is much larger than in bulk. We find that the difference increases for increasing and increasing . For example, at for the confined case is % larger than for the bulk at low and % larger at high , while at is % larger at low and % larger at high . Therefore, the confinement largely increases the translational order of the fluid and the change is stronger at higher and .
III.3 Diffusion anomaly
In normal fluids, the diffusion coefficient monotonically decreases for increasing density along isotherms. The CSW bulk fluid is anomalous also in its diffusion behavior. At low enough there is a density interval within which the diffusion coefficient increases for increasing density de Oliveira et al. (2008); Vilaseca and Franzese (2010).
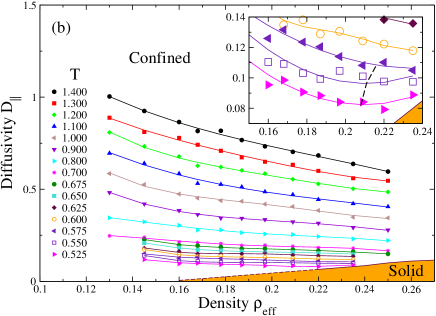
To study the diffusion properties of the confined CSW fluid and compare with the bulk, we make the following observations. To correctly define the diffusion constant in the confined case it is necessary (i) to reach the diffusion regime for the mean square displacement (MSD) and (ii) to be sure that the particles explore an environment that is homogeneous over the diffusion time-scale, otherwise the heterogeneities that survive over large time-scales could lead to apparent superdiffusive or subdiffusive regimes Leoni and Franzese (2014). Condition (i) can be satisfied thanks to our set-up with periodic boundary conditions parallel to the walls, while to guarantee condition (ii) we focus on those particles that moves only within the region of the slit pore where the liquid phase is homogeneous (Inset Fig. 1b).
For the particles in the homogeneous fluid we define the MSD parallel to the walls as Leoni and Franzese (2014)
| (5) |
where and is the time spent in the homogeneous region of the pore by a particle that stays or enters in this region at time . The diffusion coefficient in the direction parallel to the walls is by definition
| (6) |
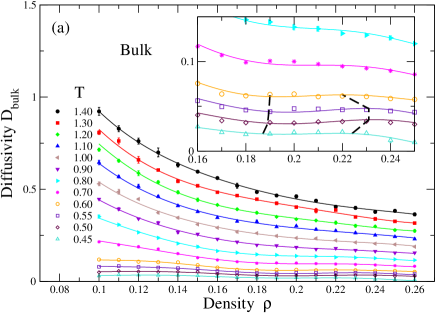
Comparing the calculations for and (Fig. 5) we observe that the diffusion anomaly in the confined system starts at higher densities with respect to the bulk case. In particular, for the bulk we find a normal behavior at high and the diffusion anomaly at low marked by a density of minimum diffusion at and a density of maximum diffusion at along isotherms with .
On the other hand, for the confined fluid we find anomalous diffusion at low in a range of density that starts at the density of minimum diffusion at along isotherms with . However, due the heterogeneous crystallization under confinement occurring at higher Leoni and Franzese (2014), we cannot observe the high-density limit of the anomalous diffusion region (Fig. 5).
We find that under confinement is much larger than and that the difference increases for decreasing and increasing . For example, at is at low and at high , while at is at low and at high . Therefore, the confinement largely enhances the translational dynamics of the homogeneous fluid with respect to the bulk and the change is stronger at low and high .
III.4 Hierarchy of anomalies
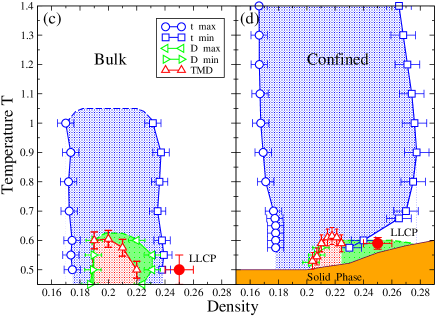
The CSW particles in bulk display a water-like hierarchy of anomalies de Oliveira et al. (2008); Vilaseca and Franzese (2010). Here we find the same hierarchy also for the confined CSW fluid (Fig. 6). In particular, for both systems we find that the structural-anomaly region, between the loci of and , includes the diffusion-anomaly region. The latter, in turn, encloses the density-anomaly region delimited by the TMD line. This hierarchy of anomalies is similar to that observed in other models with water-like properties Vilaseca and Franzese (2010) and differs from the one characteristic of silica-like fluids. In silica the diffusion-anomaly region encloses the region of structural anomalies, which contains the TMD line, marking the region of thermodynamic anomalies Shell et al. (2002b). The hierarchy also differs from those seen in other isotropic model potentials with water-like anomalies Xu et al. (2006); Fomin et al. (2011).
Despite the hierarchy is unchanged, our calculations reveal that the confinement has a strong effect on the regions of the anomalies when compared with the results for the bulk fluid (Fig. 6). The more evident difference between the bulk and the confined case is the extension of the structural-anomaly region. In bulk we observe the structural anomaly only for , while for the confined fluid we find the anomaly for all the temperatures we investigate, . Furthermore, the translational order for the confined fluid is anomalous at densities (and pressures) larger than those for the bulk case. It is interesting to observe that the high-density limit of the structural anomaly for the confined case seems to be strongly correlated at low to the filling up of the pore with the solid phase (Fig. 6). This observation suggests that the anomalous reduction of the translational order for increasing density could be the leading cause for the suppression of the crystal phase in confinement. Once the translational order recovers a normal behavior, at density higher than the locus of , the fluid starts to crystallize.
Another difference between the bulk and the confined system is the possibility to explore the entire region of diffusion anomaly. While in bulk we observe both loci and , under confinement we can find only the first, marking the onset of the diffusion-anomaly region, but not the second, marking the high-density (high-pressure) limit of the same region. This is because at high density and high pressure the slit pore is filled with heterogeneous fluid coexisting with the crystal phase, leaving no space for the homogeneous fluid. Hence the diffusion-anomaly region for the confined fluid, although extending over a wider range of densities (and pressures) with respect to the bulk case, is limited by the crystal phase.
Regarding the thermodynamic anomaly we observe that the TMD line in the confined fluid starts at higher density with respect to the bulk. The TMD extends on a smaller range of densities with no relevant change in compared with the bulk.
IV Discussion
IV.1 Confinement effects on structural and thermodynamic anomalies
Our results show that the confinement induces a shift of the anomalous regions and in particular of the largest, i.e. the structural anomaly region, towards larger densities, pressures and temperatures with respect to the bulk. This effect is commonly observed in confined fluids regardless the strength of attraction of the wall and its structure Krott et al. (2015); Sun et al. (2015). It can be understood as a result of the large local increase of density, due to the layering parallel to the walls, and of the consequent increase of particle-particle repulsion and overall pressure.
On the other hand, the effect of the confinement on the maximum temperature of the anomalies is less intuitive. Previous studies about core-softened fluids under confinement have shown that density and diffusion anomalies shift towards lower regardless of the surface structure Krott et al. (2015) or, for the TMD, regardless of the surface attraction Sun et al. (2015). Here we observe that the TMD is not affected in , while the diffusion-anomaly region has a small decrease in , consistent with Ref. Krott et al. (2015). On the contrary, the effect of confinement on the structural-anomaly region, for which there are no data in Ref.s Krott et al. (2015); Sun et al. (2015), is a large increase in . We interpret this result as a consequence of the presence of the attractive wall. The attractive interaction with the structured wall induces an order that propagates through the layers Leoni and Franzese (2014) largely increasing the translational order parameter . This effect is stronger at high and extending the anomalous structural region toward high and .
IV.2 Confinement effects on dynamics
We observe that also the dynamics of the fluid is strongly affected by the confinement. As reported in Ref. Leoni and Franzese (2014), layering starting near the attractive wall induces dynamics heterogeneities that disappear only within the central homogeneous part of the confined fluid. Here we find a large enhancement of the diffusion constant of the homogeneous fluid with respect to the bulk.
This effect poses questions when we compare our results to other water-like models, atomistic water simulations and experiments in hydrophobic (e.g., carbon-based) and hydrophilic (e.g., silica-based) confinements. In particular, the enhancement is at variance with simulation results for water in hard-core repulsive smooth slit pores with size layers (we use the fact that each water layer is on average 0.3 nm wide) Liu et al. (2004), coarse-grained water in slit pores of width 3–7 layers Eslami et al. (2013), water in disordered carbon slit pores with a size distribution 1–3 layers range Nguyen and Bhatia (2012), water in cylindrical hydrophobic and hydrophilic pores of sizes layers Allen et al. (1999). Furthermore, the structured attractive wall should decrease the fluid mobility with respect to the smooth wall for isotropic potentials Krekelberg et al. (2011); Krott et al. (2015). Also, some experiments show a dramatic increase of the mechanical relaxation times of water compressed between hydrophilic surfaces to less than 3–4 molecular layers Khan et al. (2010), or a mild increase, within a factor of three of the bulk value, of the effective viscosity of water confined between curved mica surfaces even when it is confined to a number of layers layers Raviv et al. (2001).
Nevertheless, the slowdown of the dynamics under confinement is quite controversial. For example, simulations of water confined between parallel slabs of quartz with a separation of 3 to 8 water layers indicate a lateral diffusion coefficient comparable to the bulk Zangi (2004). Other simulations show that water in carbon nanotubes with layers diameter undergoes normal diffusion, instead of subdiffusion, as a consequence of strong correlations due to hydrogen bonding between neighboring water molecules Mukherjee et al. (2007), or has an enhanced diffusion when anisotropy in the C-H and C-O interactions are considered Perez-Hernandez and Schmidt (2013). Also simulations in silica nanopores show that the first statistical water monolayer is immobile and the rest of the water is free and behaves like bulk water as far as cooperative properties, such as diffusion coefficient, are concerned for pores of 5 layers Gallo et al. (2010) and of 3 to 13 layers diameters Bourg and Steefel (2012). In other cylindrical hydrophilic pores, simulations show that confined water has translational mobility enhanced relative to bulk water in the core region of amorphous silica with diameters ranging from 9 to 13 layers Milischuk and Ladanyi (2011) and in TiO2-rutile pores of diameter layers Solveyra et al. (2013).
Several experiments with carbon nanotubes reported a water flow exceeding values calculated from continuum hydrodynamics models by more than 3 orders of magnitude for pore diameter layers Holt et al. (2006) or from 4 to 5 orders of magnitude for layers pore diameter Majumder et al. (2005, 2011). Ultrafast water flow was observed also in experiments and simulations of layered structures of graphene-based membranes separated by a typical distance of layers Nair et al. (2012). However, other experiments showed that the water flow rate through individual (1 mm) ultralong carbon nanotubes with diameters of 3–6 layers has an enhancement below 3 orders of magnitude Qin et al. (2011).
The experimental superfast water flow in carbon nanotubes has been tested in simulations with contradictory results. For example, first principle molecular dynamics simulations for water confined in single-wall carbon nanotubes and graphene sheets 3–8 layers apart showed Cicero et al. (2008) only a moderate increase in the liquid self-diffusion coefficient not consistent with the enhancement by orders of magnitude found in Ref. Holt et al. (2006). Also, it was found that transport enhancement rates depend on the nanotube’s length and are only 2 orders of magnitude over the continuum predictions for tubes with inner diameter of layers Walther et al. (2013). Nevertheless, more recent hybrid molecular-continuum simulations showed that it could be possible to reconcile all the simulations and experimental results by taking into account all the assumptions made during both the calculations and the experiments and the frictional properties for long nanotubes Ritos et al. (2015).
Other simulations showed a non-monotonic behavior of diffusion coefficient as function of the confinement size. For example, it has been found a slight enhancement in the diffusion coefficient of water confined in carbon nanotubes of diameter layers compared to bulk water with a sharp decrease and a minimum at layers and an increase at smaller diameters Ye et al. (2011); Barati Farimani and Aluru (2011), consistent with a non-monotonic flow enhancement observed in experiments for ultralong tubes with diameter around layers Qin et al. (2011). Non-monotonicity in the diffusion has been reported also for a core-softened fluid confined in nanotubes of different radiuses, with a minimum diffusion for a radius approximately between 2 and 4 layers Bordin et al. (2012), and for confined films of spherical particles when the separation between the attractive plates is around 4 and 5 layers Gao et al. (1997).
In our case, the confinement induces a diffusion coefficient that is at most twice as large as in bulk, hence inconsistent with ultrafast water flow, but consistent with the moderate increase of mobility found in several of the works cited above. For the range of densities studied here, we have between 3 and 8 layers of homogeneous fluid confined within heterogeneous layers of amorphous solid near the walls of the slit pore. This range of number of layers corresponds, as mentioned above, to the pore sizes for which there are experiments and simulations showing a moderate mobility increase or a non-monotonic behavior of the dynamics. In particular, the largest increase of the diffusion occurs at low and high , i.e. when there are only a few (3 or 4) layers of homogeneous fluid confined within the slit pore.
Our interpretation is that the observed layering induces collective diffusion modes and a related higher mobility. A similar mechanism due to packing and layering has been proposed for room-temperature ionic liquids in nanoporous media Huber (2015). Also in confined water clustering, due to hydrogen-bond correlation, has been considered as the cause for increased mobility Perez-Hernandez and Schmidt (2013). In our case layering Leoni and Franzese (2014) and long-range correlations and structural changes Vilaseca and Franzese (2010) can be the origin of correlated aggregates and collective modes responsible for the moderate increase of mobility.
IV.3 Confinement effects on the LLCP
While the slit pore does not change significantly the critical density and pressure of the LLCP, it lifts the critical temperature to higher values with respect to the bulk. A similar effect was observed for water under hydrophilic, i.e. attractive, confinement Brovchenko and Oleinikova (2007). However, a number of isotropic models with water-like properties in nano-confinement have shown that the LLCP shifts towards lower independently of the surface structure Krott et al. (2015) or the surface interaction Sun et al. (2015)333These results somehow recall those for the case of wetting in a slit-pore confinement with competitive surface field, studied by means of the Ising model, for which theory Parry and Evans (1990) and simulation Albano and Binder (2012) show that the critical temperature in confinement is lower than in bulk. However, two-states models, such as the Ising model, do not allow for the range of density fluctuations that are important in our study.
Nevertheless, we understand the shift of the LLCP to high as a consequence of the strength of the interaction between the fluid and the attractive wall irrespective of the structured, smooth or amorphous nature of the confinement Truskett et al. (2001). Our result is consistent with Ref. Brovchenko and Oleinikova (2007) where the fluid-wall interaction is strong enough to induce a high-density layer near the wall. Further support to our interpretation comes from the observation that in those cases in which the walls are repulsive Krott et al. (2015) or not enough attractive to form a high-density layer near the wall Sun et al. (2015), the shift of the LLCP towards low decreases for increasing density of the layer near the wall.
We observe that both in bulk and under confinement the LLCP occurs just above the high-density (high-pressure) limit of the anomalous regions. We understand this as due to the necessity for the fluid to first recover the normal (increasing) behavior of for increasing and then reach the value of large enough for the liquid-liquid phase transition. Under confinement further increase of induces the long-range translational order characteristic of the crystal phase and the consequent crystallization. This interpretation is consistent with the fact that the anomalous behavior of correlates with the limit of stability of the liquid with respect to the crystal under confinement (Fig. 6d).
The fact that the LLCP occurs near the high-pressure, high-density limit of the anomalous regions suggests that the knowledge of the limits of these regions could give an indication about where the LLCP is located. This finding together with the result that the LLCP for the confined fluid is lifted up in temperature, above the limit of the solid-like phase, gives support to the idea that the observation in an appropriately defined confinement could be a way to make a LLCP more accessible to the experiments. In thie light of these observations, in the following we discuss the possible implications of our results for experiments.
IV.4 Phase diagram of the entire fluid
In the range of temperatures and densities we consider here, fluid particles in the confined system distribute heterogeneously close to the walls and homogeneously in the middle of the pore Leoni and Franzese (2014). Therefore, a reasonable way to compare the thermodynamics under confinement with the bulk is to consider only the contribution coming from the homogeneous confined fluid, as we do in Section III.
However, in experiments is not easy to separate this contribution from the signal coming from the overall confined system. Therefore, it makes sense to ask how the thermodynamic properties would change if we include in the calculation the contribution coming from the heterogeneous part, and how they would compare with those of the well defined homogeneous fluid.
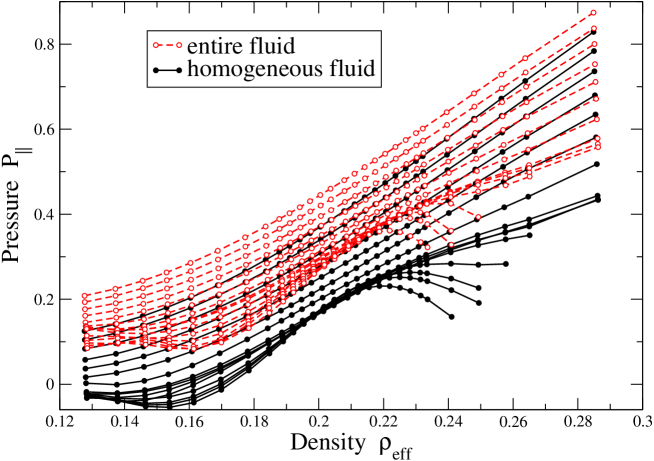
We find that isotherms of the entire fluid are shifted towards higher pressures with respect to those of the homogeneous fluid, especially at low densities (Fig. 7). We understand this effect as a consequence of the density heterogeneities in the system due to the layering. As seen in Fig. 1 of Ref. Leoni and Franzese (2014), the density profile has large variations near the walls, especially close to the attractive wall, reaching values that are also ten times larger than the average density. Hence, within this heterogeneous region the inter-particles distance can be largely reduced with respect to the homogeneous fluid, inducing large repulsive contributions to the average , defined by the Eq. (2).
V Conclusions
We study by MD simulations how the slit pore nano-confinement made of a structured attractive wall parallel to a smooth repulsive wall affects the phase diagram and the anomalies of the CSW fluid and its water-like properties. In a previous work Leoni and Franzese (2014) we found that the slit pore has a drastic effect on the structural and dynamical properties of this system. Particles arrange in layers parallel to the walls, especially near the attractive surface, and for a large range of temperatures and densities they distribute homogeneously in a central region of the pore. At low and high the fluid becomes heterogeneous (amorphous) and crystallizes near the structured attractive wall. Interestingly similar results were found in all-atoms simulations of water under hydrophobic and hydrophilic slit-pore confinement, with inhomogeneities and ordering near the hydrophilic surface Srivastava et al. (2011).
Here we compare thermodynamic properties of the confined fluid with the bulk. We consider the homogeneous fluid in the pore and we find that its isotherms can be rescaled to that of the bulk. This result implies that the knowledge of the thermodynamics of the confined fluid can give us a direct insight into the properties of the bulk system. In particular, we find that in confinement, as well as in bulk, the fluid undergoes a liquid-liquid phase transition ending in a LLCP.
We study also how the confinement affects the anomalous properties and, in particular, the TMD line, the diffusion constant and the structural (translational) order. We find that the confinement does not change the water-like hierarchy of anomalies, with the TMD line within the anomalous-diffusion region and the latter inside the anomalous-structure region, in a cascade of nested domes.
However the confinement induces a shift of the external dome towards larger densities, pressures and temperatures with respect to the bulk. We interpret this results as a consequence of the enhancement of structure due to fluid-wall interaction.
We find also a moderate increase of mobility of the homogeneous central part of the confined fluid. We consider this effect due to the layering and collective modes of the fluid that are consequence of the long-range correlations that have been calculated for the CSW potential. This mechanisms could be relevant also for water under similar confinement, where layering and hydrogen-bond long-range correlation could be the origin of collective modes.
We observe that our slit-pore confinement promotes the LLCP to temperatures higher than in bulk. This result could be relevant for those systems, e.g., water, where the spontaneous crystallization prevents a direct observation of the LLCP and for which there have been recent attempts to measure the LLCP in confinement Liu et al. (2005); Nagoe and Oguni (2013); Mallamace et al. (2014). As discussed, we consider that this result is a consequence of the interaction energy of the fluid with the wall, independent of our specific choice with competitive surface interactions at the two parallel walls. In particular, we expect that for a slit pore with both walls attractive or both repulsive the homogeneous fluid sub-region would narrow or would broaden, respectively, but for strong-enough fluid-wall interaction the LLCP temperature would increase with respect to the bulk case. Further calculations, beyond the scope of the present work, would be necessary to elucidate this point.
Motivated by understanding if the interpretation of the experiments with anomalous fluids under confinement could be affected by the presence of the amorphous (heterogeneous liquid) coexisting with the homogeneous liquid, we calculate the thermodynamic properties for the entire pore in absence of the crystal. This comparison is useful in those experimental cases in which it is difficult to separate the signals associated to the homogeneous and the heterogeneous liquids. We find that the isotherms describing the entire fluid with respect to the homogeneous liquid are shifted towards higher pressures, especially at low densities. Yet the physics of the two systems, homogeneous fluid and homogeneous plus heterogeneous fluid, is the same, both displaying a GLCP and a LLCP.
Our observations could help in interpreting experiments with confined anomalous fluids, and especially water, in which it is unclear if the fluid retains the thermodynamic properties of the bulk Soper (2008); Ricci et al. (2008). However, a limitation to the similarities between confined and bulk fluid could come from the pore size. Extrapolating the results in Ref. Leoni and Franzese (2014) and the present estimates, we argue that the LLCP would be observable in a slit pore with a width fluid layer, i.e. nm for water, if the walls are strongly hydrophobic, or layers, i.e. nm for water, if the walls are hydrophilic. This requirement is satisfied, e.g., by the hydrophilic Vycor brand porous glass No. 7930 (with average pore size of 5 nm) used in the experiment of Ref. Zanotti et al. (2005) to study the LLCP for hydration water, although in that experiment the hydration level was only 25%.
Nevertheless, our conclusions do not exclude that the LLCP could be accessible also in strong hydrophilic confinement, such as in Ref.s Liu et al. (2005); Mallamace et al. (2007); Zhang et al. (2011); Cupane et al. (2014a, b), because our study does not consider the effect of curvature of the confining walls on the crystallization rate. It is reasonable to hypothesize that the curvature would diminish the crystallization rate, making the critical region near the LLCP accessible also in strongly confined water. Further theoretical study is necessary to clarify this point.
Acknowledgments
We thank Marco Bernabei, Valentino Bianco, Carles Calero, David Reguera and Oriol Vilanova for useful discussions. We acknowledge the support of Spanish MINECO grant FIS2012-31025.
References
- Bellissent-Funel et al. (1995) M.-C. Bellissent-Funel, S. H. Chen, and J.-M. Zanotti, Phys. Rev. E 51, 4558 (1995).
- Schoen and Diestler (1998) M. Schoen and D. J. Diestler, J. Chem. Phys. 109, 5596 (1998).
- Mashl et al. (2003) R. J. Mashl, S. Joseph, N. R. Aluru, and E. Jakobsson, Nano Lett. 3, 589 (2003).
- Mittal et al. (2008) J. Mittal, T. M. Truskett, J. R. Errington, and G. Hummer, Phys. Rev. Lett. 100, 145901 (2008).
- Cicero et al. (2008) G. Cicero, J. C. Grossman, E. Schwegler, F. Gygi, and G. Galli, J. Am. Chem. Soc. 130, 1871 (2008).
- De Virgiliis et al. (2008) A. De Virgiliis, R. L. C. Vink, J. Horbach, and K. Binder, Phys. Rev. E 78, 041604 (2008).
- Giovambattista et al. (2009) N. Giovambattista, P. J. Rossky, and P. G. Debenedetti, J. Phys. Chem. B 113, 13723 (2009).
- Castrillón et al. (2009a) S. R.-V. Castrillón, N. Giovambattista, I. A. Aksay, and P. G. Debenedetti, J. Phys. Chem. B 113, 7973 (2009a).
- Castrillón et al. (2009b) S. R.-V. Castrillón, N. Giovambattista, I. A. Aksay, and P. G. Debenedetti, J. Phys. Chem. B 113, 1438 (2009b).
- Mancinelli et al. (2009) R. Mancinelli, S. Imberti, A. K. Soper, K. H. Liu, C. Y. Mou, F. Bruni, and M. A. Ricci, J. Phys. Chem. B 113, 16169 (2009).
- Rzysko et al. (2010) W. Rzysko, A. Patrykiejew, S. Sokolowski, and O. Pizio, J. Chem. Phys. 132, 164702 (2010).
- Han et al. (2010) S. Han, M. Y. Choi, P. Kumar, and H. E. Stanley, Nature Phys. 6, 685 (2010).
- de los Santos and Franzese (2011) F. de los Santos and G. Franzese, J. Phys. Chem. B 115, 14311 (2011).
- Schnell et al. (2011a) S. K. Schnell, T. J. H. Vlugt, J.-M. Simon, D. Bedeaux, and S. Kjelstrup, Chem. Phys. Lett. 504, 199 (2011a).
- Schnell et al. (2011b) S. K. Schnell, T. J. H. Vlugt, J.-M. Simon, D. Bedeaux, and S. Kjelstrup, Mol. Phys. 110, 1069 (2011b).
- Nair et al. (2012) R. R. Nair, H. A. Wu, P. N. Jayaram, I. V. Grigorieva, and A. K. Geim, Science 335, 442 (2012).
- Paul (2012) D. R. Paul, Science 335, 413 (2012).
- Ferguson et al. (2012) A. L. Ferguson, N. Giovambattista, P. J. Rossky, A. Z. Panagiotopoulos, and P. G. Debenedetti, J. Chem. Phys. 137, 144501 (2012).
- Stewart and Evans (2012) M. C. Stewart and R. Evans, Phys. Rev. E 86, 031601 (2012).
- Krott and Barbosa (2013) L. B. Krott and M. C. Barbosa, J. Chem. Phys. 138, 084505 (2013).
- Sun et al. (2015) G. Sun, N. Giovambattista, and L. Xu, J. Chem. Phys. 143, 244503 (2015).
- Klein and Kumacheva (1995) J. Klein and E. Kumacheva, Science 269, 816 (1995).
- Thompson et al. (1992) P. A. Thompson, G. S. Grest, and M. O. Robbins, Phys. Rev. Lett. 68, 3448 (1992).
- Cui et al. (2001) S. T. Cui, P. T. Cummings, and H. D. Cochran, J. Chem. Phys. 114, 7189 (2001).
- Jabbarzadeh et al. (2007) A. Jabbarzadeh, P. Harrowell, and R. I. Tanner, J. Chem. Phys. B 111, 11354 (2007).
- Ramin and Jabbarzadeh (2013) L. Ramin and A. Jabbarzadeh, Langmuir 29, 13367 (2013).
- Lorenz et al. (2009) C. Lorenz, J. M. D. Lane, M. Chandross, M. J. Stevens, and G. S. Grest, Langmuir 25, 4535 (2009).
- Franzese (2007) G. Franzese, J. Mol. Liq. 136, 267 (2007).
- de Oliveira et al. (2008) A. B. de Oliveira, G. Franzese, P. A. Netz, and M. C. Barbosa, J. Chem. Phys. 128, 064901 (2008).
- Vilaseca and Franzese (2010) P. Vilaseca and G. Franzese, J. Chem. Phys. 133, 084507 (2010).
- Leoni and Franzese (2014) F. Leoni and G. Franzese, J. Chem. Phys. 141, 174501 (2014).
- Ryltsev et al. (2015) R. Ryltsev, B. Klumov, and N. Chtchelkatchev, Soft Matter 11, 6991 (2015).
- Denton and Löwen (1998) A. R. Denton and H. Löwen, Phys. Rev. Lett. 81, 469 (1998).
- Yan et al. (2008) Z. Yan, S. V. Buldyrev, P. Kumar, N. Giovambattista, and H. E. Stanley, Phys. Rev. E 77, 042201 (2008).
- Agarwal et al. (2010) M. Agarwal, M. Singh, R. Sharma, M. Parvez Alam, and C. Chakravarty, J. Phys. Chem. B 114, 6995 (2010).
- Krott et al. (2015) L. B. Krott, J. R. Bordin, N. M. Barraz, and M. C. Barbosa, J. Chem. Phys. 142, 134502 (2015).
- Vilaseca et al. (2013) P. Vilaseca, K. A. Dawson, and G. Franzese, Soft Matter 9, 6978 (2013).
- Huš and Urbic (2014) M. Huš and T. Urbic, Phys. Rev. E 90, 062306 (2014).
- Huš et al. (2014) M. Huš, G. Munaò, and T. Urbic, J. Chem. Phys. 141, 164505 (2014).
- Vilaseca and Franzese (2011) P. Vilaseca and G. Franzese, J. Non-Cryst. Solids 357, 419 (2011).
- Hus and Urbic (2013) M. Hus and T. Urbic, J. Chem. Phys. 139, 114504 (2013).
- Khan et al. (2010) S. H. Khan, G. Matei, S. Patil, and P. M. Hoffmann, Phys. Rev. Lett. 105, 106101 (2010).
- Severin et al. (2012) N. Severin, P. Lange, I. M. Sokolov, and J. P. Rabe, Nano Lett. 12, 774 (2012).
- Parry and Evans (1990) A. O. Parry and R. Evans, Phys. Rev. Lett. 64, 439 (1990).
- Albano and Binder (2012) E. V. Albano and K. Binder, Phys. Rev. Lett. 109, 036101 (2012).
- Swift et al. (1991) M. R. Swift, A. L. Owczarek, and J. O. Indekeu, Europhys. Lett. 14, 475 (1991).
- Liu et al. (2004) Y. Liu, Q. Wang, and L. Lu, Langmuir 20, 6921 (2004).
- Varnik et al. (2000) F. Varnik, J. Baschnagel, and K. Binder, J. Chem. Phys. 113, 4444 (2000).
- Allen and Tildesley (1989) M. P. Allen and D. J. Tildesley, Computer simulation of liquids (Oxford university press, 1989).
- edited by S. Klapp and Schoen (2007) edited by S. Klapp and M. Schoen, eds., Reviews in Computational Chemistry (John Wiley & Sons, 2007).
- Truskett et al. (2001) T. M. Truskett, P. G. Debenedetti, and S. Torquato, J. Chem. Phys. 114, 2401 (2001).
- Note (1) We observe (Fig. 1) that the fluid phase for both bulk and confined cases corresponds to a density range smaller with respect to that of a normal fluid, as for example the Lennard-Jones (LJ). Indeed, one of the common features of the potentials for anomalous-liquids is the very low density of the liquid phase, due to the characteristic soft-core interaction. For example, the LJ potential has its minimum at interparticle distance , while the CSW has its minimum at , where is the particle diameter. Hence, for typical liquid configurations of the two systems it is , or equivalently .
- Note (2) By definition, the -derivative of the critical isotherm is zero. From the other hand, the point where minimia and maxima showen by isotherms meet (corresponding to ), identify the critical point.
- Shell et al. (2002a) M. S. Shell, P. G. Debenedetti, and A. Z. Panagiotopoulos, Phys. Rev. E 66, 011202 (2002a).
- Errington and Debenedetti (2001) J. R. Errington and P. D. Debenedetti, Nature 409, 318 (2001).
- Errington et al. (2003) J. E. Errington, P. G. Debenedetti, and S. Torquato, J. Chem. Phys. 118, 2256 (2003).
- Shell et al. (2002b) M. S. Shell, P. G. Debenedetti, and A. Z. Panagiotopoulos, Phys. Rev. E 66, 011202 (2002b).
- Xu et al. (2006) L. Xu, S. Buldyrev, C. A. Angell, and H. E. Stanley, Phys. Rev. E 74, 031108 (2006).
- Fomin et al. (2011) Y. D. Fomin, E. N. Tsiok, and V. N. Ryzhov, J. Chem. Phys. 135, 234502 (2011).
- Eslami et al. (2013) H. Eslami, B. Jaafari, and N. Mehdipour, ChemPhysChem 14, 1063 (2013).
- Nguyen and Bhatia (2012) T. X. Nguyen and S. K. Bhatia, J. Phys. Chem. C 116, 3667 (2012).
- Allen et al. (1999) T. W. Allen, S. Kuyucak, and S.-H. Chung, J. Chem. Phys. 111, 7985 (1999).
- Krekelberg et al. (2011) W. P. Krekelberg, V. K. Shen, J. R. Errington, and T. M. Truskett, J. Chem. Phys. 135, 154502 (2011).
- Raviv et al. (2001) U. Raviv, P. Laurat, and J. Klein, Nature 413, 51 (2001).
- Zangi (2004) R. Zangi, J. Phys.: Condens. Matter 16, S5371 (2004).
- Mukherjee et al. (2007) B. Mukherjee, P. K. Maiti, C. Dasgupta, and A. K. Sood, J. Chem. Phys. 126, 124704 (2007).
- Perez-Hernandez and Schmidt (2013) G. Perez-Hernandez and B. Schmidt, Phys. Chem. Chem. Phys. 15, 4995 (2013).
- Gallo et al. (2010) P. Gallo, M. Rovere, and S.-H. Chen, J. Phys.: Condens. Matter 22, 284102 (2010).
- Bourg and Steefel (2012) I. C. Bourg and C. I. Steefel, J. Phys. Chem. C 116, 11556 (2012).
- Milischuk and Ladanyi (2011) A. A. Milischuk and B. M. Ladanyi, J. Chem. Phys. 135, 174709 (2011).
- Solveyra et al. (2013) E. G. Solveyra, E. d. l. Llave, V. Molinero, G. J. A. A. Soler-Illia, and D. A. Scherlis, J. Phys. Chem. C 117, 3330 (2013).
- Holt et al. (2006) J. K. Holt, H. G. Park, Y. Wang, M. Stadermann, A. B. Artyukhin, C. P. Grigoropoulos, A. Noy, and O. Bakajin, Science 312, 1034 (2006).
- Majumder et al. (2005) M. Majumder, N. Chopra, R. Andrews, and B. J. Hinds, Nature 438, 44 (2005).
- Majumder et al. (2011) M. Majumder, N. Chopra, and B. J. Hinds, ACS Nano 5, 3867 (2011).
- Qin et al. (2011) X. Qin, Q. Yuan, Y. Zhao, S. Xie, and Z. Liu, Nano Letters 11, 2173 (2011).
- Walther et al. (2013) J. H. Walther, K. Ritos, E. R. Cruz-Chu, C. M. Megaridis, and P. Koumoutsakos, Nano Lett. 13, 1910 (2013).
- Ritos et al. (2015) K. Ritos, M. K. Borg, D. A. Lockerby, D. R. Emerson, and J. M. Reese, Microfluid Nanofluid 19, 997 (2015).
- Ye et al. (2011) H. Ye, H. Zhang, Y. Zheng, and Z. Zhang, Microfluid Nanofluid 10, 1359 (2011).
- Barati Farimani and Aluru (2011) A. Barati Farimani and N. R. Aluru, J. Phys. Chem. B 115, 12145 (2011).
- Bordin et al. (2012) J. R. Bordin, A. B. de Oliveira, A. Diehl, and M. C. Barbosa, J. Chem. Phys. 137, 084504 (2012).
- Gao et al. (1997) J. Gao, W. D. Luedtke, and U. Landman, Phys. Rev. Lett. 79, 705 (1997).
- Huber (2015) P. Huber, J. Phys.: Condens. Matter 27, 103102 (2015).
- Brovchenko and Oleinikova (2007) I. Brovchenko and A. Oleinikova, J. Chem. Phys. 126, 214701 (2007).
- Note (3) These results somehow recall those for the case of wetting in a slit-pore confinement with competitive surface field, studied by means of the Ising model, for which theory Parry and Evans (1990) and simulation Albano and Binder (2012) show that the critical temperature in confinement is lower than in bulk. However, two-states models, such as the Ising model, do not allow for the range of density fluctuations that are important in our study.
- Srivastava et al. (2011) R. Srivastava, H. Docherty, J. K. Singh, and P. T. Cummings, J. Phys. Chem. C 115, 12448 (2011).
- Liu et al. (2005) L. Liu, S.-H. Chen, A. Faraone, C.-W. Yen, and C.-Y. Mou, Phys. Rev. Lett. 95, 117802 (2005).
- Nagoe and Oguni (2013) A. Nagoe and M. Oguni, J. Phys. Soc. Jpn. 82, 124606 (2013).
- Mallamace et al. (2014) F. Mallamace, C. Corsaro, D. Mallamace, S. Vasi, C. Vasi, and H. E. Stanley, The Journal of Chemical Physics 141, 18C504 (2014).
- Soper (2008) A. K. Soper, Mol. Phys. 106, 2053 (2008).
- Ricci et al. (2008) M. A. Ricci, F. Bruni, and A. Giuliani, Faraday Discuss. 141, 347 (2008).
- Zanotti et al. (2005) J. M. Zanotti, M. C. Bellissent-Funel, and S. H. Chen, Europhys. Lett.) 71, 91 (2005).
- Mallamace et al. (2007) F. Mallamace, M. Broccio, C. Corsaro, A. Faraone, D. Majolino, V. Venuti, L. Liu, C.-Y. Mou, and S.-H. Chen, Proc. Natl. Acad. Sci. USA 104, 424 (2007).
- Zhang et al. (2011) Y. Zhang, A. Faraone, W. A. Kamitakahara, K.-H. Liu, C.-Y. Mou, J. B. Leão, S. Chang, and S.-H. Chen, Proc. Natl. Acad. Sci. USA 108, 12206 (2011).
- Cupane et al. (2014a) A. Cupane, M. Fomina, and G. Schirò, J. Chem. Phys. 141, 18C510 (2014a).
- Cupane et al. (2014b) A. Cupane, M. Fomina, I. Piazza, J. Peters, and G. Schirò, Phys. Rev. Lett. 113, 215701 (2014b).