[cor1]Corresponding author
Tsallis statistics in the income distribution of Brazil
Abstract
This paper discusses the empirical evidence of Tsallis statistical functions in the personal income distribution of Brazil. Yearly samples from 1978 to 2014 were linearized by the -logarithm and straight lines were fitted to the entire range of the income data in all samples, producing a two-parameters-only single function representation of the whole distribution in every year. The results showed that the time evolution of the parameters is periodic and plotting one in terms of the other reveals a cycle mostly clockwise. It was also found that the empirical data oscillate periodically around the fitted straight lines with the amplitude growing as the income values increase. Since the entire income data range can be fitted by a single function, this raises questions on previous results claiming that the income distribution is constituted by a well defined two-classes-base income structure, since such a division in two very distinct income classes might not be an intrinsic property of societies, but a consequence of an a priori fitting-choice procedure that may leave aside possibly important income dynamics at the intermediate levels.
keywords:
Income distribution; Brazil’s income data; Tsallis statistics; -logarithm; -exponentialsort&compress
1 Introduction
The functional characterization of the income distribution in a population is an old problem in economics. Vilfredo Pareto (1848-1923), widely acknowledged as the first to have studied this problem systematically, concluded that the richest individuals in a society have their complementary cumulative income distribution function (see definition below) behaving as a power-law pareto , a result that so far has not been disputed by different studies made across a wide variety of samples obtained at different times for different populations and in different countries or groups of countries (k80, ; nm09, ; fnm10, ; dy01, ; ferrero2, ; s05, ; yr09, ; crbh08, ; by10, ; nm13, ; cyc05, ; c5, , and references therein). Nevertheless, it has also been known for quite some time that for the vast majority of the population, that is, for those who do not belong to the very rich, this Pareto power-law does not hold.
Several studies can be found in the literature, especially in the recent econophysical literature, with proposals regarding the behavior of the income distribution of the whole population. Most of these studies leave the Pareto power-law as the standard way of describing the income data segment formed by the very rich, but model the income data segment formed by the less rich by means of functions like the exponential, the log-normal, the gamma function, the Gompertz curve, as well as other functions dy01 ; cyc05 ; s05 ; nm09 ; fnm10 ; c5 . Such approaches have been successful in terms of describing the entire data range, but on the negative side they require fitting the whole distribution with at least three parameters. In some cases the number of parameters can go as high as five. In addition, by dividing the income distribution in two segments one is in fact assuming that societies are fundamentally divided in two very distinct income classes, one formed by the rich, encompassing about 1% of the population whose income is fitted by the Pareto power-law, and another formed by the vast majority of people, the remaining 99%, whose income is distributed according to other functions such as the ones mentioned above. This methodology raises the question of whether or not such a class division is really an intrinsic feature of societies or just a result of fitting choices.
A different approach for describing the income distribution was made by Borges and Ferrero, who fitted income data using the Tsallis functions instead of the ones mentioned above and described the personal income distribution in terms of Tsallis’ parameter. Borges borges fitted the income data to two power-law regimes in two slopes, where one parameter controls the slope of the first, intermediate, power-law regime and the second parameter describes the tail of the distribution. In this way he was able to describe almost the whole spectrum of the county distribution of the USA from 1970 to 2000, Brazil from 1970 to 1996, Germany from 1992 to 1998 and United Kingdom from 1993 to 1998, concluding that in the case of the USA and Brazil an increase in along the time indicates increasing inequality, since greater values of imply greater probability of finding counties much richer than others.
Ferrero’s ferrero1 ; ferrero3 use of the Tsallis functions to the income distribution problem showed to be possible to employ only one parameter for the whole income distribution range of a country. He fitted income data from the UK, Japan, New Zealand and USA, although the samples were limited to specific years only: 1996 for New Zealand, 1998 for UK and Japan, and 2001 for the USA. So, differently from Ref. borges , his analysis did not provide indications about the time evolution of the parameter, although he concluded that for the first three countries is close to 1.1 whereas it produces for the USA, a result which seems to support Borges’ conclusion that grows in parallel with inequality, since among these countries the USA has the highest Gini coefficient.
In this paper we deal with this old problem from the perspective of Tsallis functions in an approach that combines and expands the analysis of both authors above and reinforces them on the empirical side. We propose using Tsallis statistics to represent the income distribution of the entire income data range, from the very poor to the super rich, by a single function, that is, without assuming a class division. We applied the Tsallis -logarithm to the entire income data of the Brazilian individual income distribution yearly samples from 1978 to 2014 using the same data reducing techniques previously applied in other studies made with the personal income data of Brazil nm09 ; fnm10 ; nm13 . This allowed us to study the time evolution of a single parameter along a time span of almost four decades for the entire income distribution of a whole country, providing then new evidence of Tsallis functions’ ability to adequately represent personal income of a whole country.
Our results show that Brazil’s complementary cumulative income distribution can be linearized by the -logarithm and fitted by using only two parameters. For Brazil ranges from 1.19 to 1.54 and fluctuates with a period of approximately 3.5 years. Both fitted parameters also present a cycling behavior in terms of one another similar to the cycles obtained in Ref. nm13 through a substantially different analysis where the method of describing the income data range with two functions was applied. In addition, we noted a second order effect, not previously reported in the study of any other income samples, comprised of a periodic oscillation along the fitted straight line whose amplitude grows with increasing income values. Although such an effect can indeed be noted after a careful observation of other income distribution studies made in different samples of different countries using the method of dividing the income data in two domains dy01 ; s05 ; nm09 ; by10 , it seems that it has not been previously reported because this effect only becomes clearly visible when one fits the entire income distribution range and reaches data values belonging to the very rich. So, dividing the data in two functionally distinct domains seems to obscure this periodic oscillation.
Considering that the entire income distribution range can be fitted by just one function using only two parameters, a well-defined two-classes-base income structure implicitly assumed when the income range is described by two distinct functions may be open to questioning. The point here is that such income-class division could possibly be only a result of fitting choices and not of an intrinsic property of societies. Although the Tsallis distribution is known to become a pure power-law for large values of its independent variable , and exponential when tends to zero, this is not the same as assuming from the start a two-classes approach to the income distribution problem because the Tsallis distribution will only have power-law and exponential like behaviors as limiting cases. Thus, a possible complex behavior at the intermediate level might not be described by neither of these functions. Hence, the Tsallis distribution does not necessarily imply in two very distinct classes based on well-defined income domain ranges, but possibly having an intermediate income range of unknown size which might behave as neither of them. Although there may be sociological evidences for this two-classes approach, from an econophysical viewpoint, that is, from a modeling perspective, this is an a priori division because there is not yet a clear dynamical justification based on any known econophysical mechanism for doing that. So, from a dynamical viewpoint such a class-based analytical approach might be a result of a purely fitting procedure. It seems that this situation can only be clarified once we have a full dynamical theory for the income distribution, theory which is still lacking.
This paper is organized as follows. Sect. 2 presents the Tsallis functions and some results based on them required in our analysis. Sect. 3 presents and discusses our fitting results with several graphs. Sect. 4 presents our conclusions.
2 Tsallis functions
The Tsallis statistics is based on the -logarithm and -exponential functions, defined as follows tsallis1 ; tsallis2 ,
| (1) |
| (2) |
For both functions become the usual logarithm and exponential, that is, and . Hence, Tsallis -functions are in fact the usual exponential and logarithmic functions deformed in such a way as to be useful in Tsallis’ theory of nonextensive statistical mechanics tsallis2 . Nevertheless, they are not the only way of deforming these two common functions in order to suit specific applications, which include, among others, the personal income distribution. Another way of doing this is by employing the -generalized exponential, which was in fact advanced as a single function capable of fitting the whole income data range as, similarly to the Tsallis -functions, it has the exponential and power-law as a limiting cases cgk07 . Since it has been extensively studied elsewhere in the context of income and wealth distributions cmgk08 ; cgk09 ; cgk12 we shall not deal with it in this paper.
From their very definitions, it is clear that,
| (3) |
In addition, for any . So, if there exists a value such that then . Two other properties of the -exponential useful in the present context are written below yamano ,
| (4) |
| (5) |
3 Income distribution
Let be the cumulative distribution function (CDF) of individual income, which gives the probability that an individual receives an income less than or equal to . Hence, the complementary cumulative distribution function (CCDF) of individual income gives the probability that an individual receives an income equal to or greater than . From this it is clear that , where the maximum probability is normalized as 100% instead of the usual unity value. These functions have the following approximate boundary conditions nm09 ; fnm10 , and . Besides, and , where is the probability density function (PDF).
The connection of the Tsallis functions with income distribution comes from the realization that when is plotted in a log-log scale, its functional behavior of decreasing values as the income increases is very similar to the behavior of for also plotted in a log-log scale (see Fig. 3.4 of Ref. tsallis2 ). In addition, the Tsallis functions behave as a power-law for high income values, that is, at the tail of the distribution ferrero1 . So, this suggests that we can describe the income distribution by means of the following expression,
| (6) |
where and are positive parameters. Considering the boundary condition one can straightforwardly conclude that . Hence, substituting this result into the expression above and taking the -logarithm we obtain,
| (7) |
Considering Eqs. (4) and (5), the corresponding PDF yields,
| (8) |
Eq. (7) clearly goes through the coordinate’s origin if we remember the properties of the -logarithm outlined above. So, the data fitting problem is then reduced to finding only two parameters, and . This has been done for all Brazilian samples constituted by a time span of almost fours decades, as explained in what follows.
To calculate the optimal parameter, it is important to bear in mind that every yearly sample from 1978 to 2014 produced an empirical set of observed income values and their correspondent CCDF . To find the optimal parameter for a specific yearly dataset , we assumed that in each annual sample the optimal lies in the interval and then ranged it with steps of . Hence, we generated another set of values , fitted a straight line to the specific dataset under study for each to obtain the correspondent fitted parameter . In this way each year produced another set of quantities . For each pair of values we defined the following residue,
| (9) |
In view of Eq. (7) the ideal implies in an ideal and in turn they both produce zero residue. So the pair of parameters that produces the minimum residue value are the optimal and of the sample. Finding the optimal pair of parameters is an extremum problem, which means that the optimal pair , produces the minimum and that corresponds to the maximum value of the second derivative . By following this procedure computationally we were able to find the best fit for both and in each year for all our samples. The step interval gave us a rough indication of the uncertainty in the optimal and the error in had been previously obtained from the usual linear fit.
Figs. 1–6 show graphs of Brazil’s CCDF linearized, straight line fitted according to Eq. (7) and plotted against the income . The fitted parameters are summarized in Table 1. It is clear that the -functions are very successful in fitting the whole distribution, and it is also clear that there is another, second order, effect consisting of a periodic oscillation of the data along the fitted straight line. This effect has not been reported before in income distribution studies, perhaps because it only becomes clearly visible when one fits the whole data range as the amplitude of the oscillation grows with the income. It becomes more prominent at the tail of the distribution, that is, where it behaves more as a power-law. Actually, this oscillatory behavior can indeed be observed once one takes a careful look at previous studies of income distribution made with different samples at different time periods and using different methodologies, since even low amplitude oscillations are also present at very low income data. This can be verified, e.g., in Figs. 8 and 9 of Ref. nm09 , at insets of Figs. 1 and 2 of Ref. dy01 , and in Fig. 27 of Ref. s05 , although none of these studies have actually reported the presence of this periodic oscillation in their data.
Fig. 7 shows the time evolution of both and along the time span of this study. There is a clear periodicity in their temporal variation, with maxima appearing from 2 to 5 years, actually at about 3.5 years on average. Such periodicity in both parameters is not a novelty as far as Brazilian income data are concerned, since it has also appeared in other treatments even when different methodologies were applied nm09 ; fnm10 ; nm13 . Hence, it is conceivable that those different methodologies could be unified with the present one by means of possible relationships of the parameters used in those different studies.
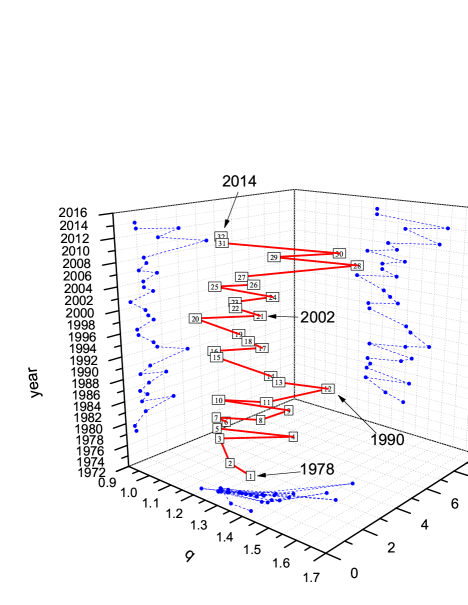
Fig. 8 shows both parameters plotted in terms of one another. Although the points present some dispersion, there is a tendency for to grow linearly with , although this pattern is unrelated to time. This tendency can be better seen by a straight line weighted fit to the data, shown as a dashed line in the figure, which indeed indicates a growing pattern. However, a time related pattern does appear in Fig. 9, where the data were divided in three time intervals, 1978–1989, 1990–2001 and 2002–2014, so that this pattern becomes more clearly visible. By following the points chronologically along the dashed lines a cycle appears, mostly clockwise, but with a few anti-clockwise turns. What is striking about these plots is their similarities with the ones discussed by Moura Jr. and Ribeiro nm13 where a clockwise cycle is also present in their study, although this was a result of an analysis employing an entirely different methodology (see Fig. 3 of Ref. nm13 ). Fig. 10 shows the same results but in three dimensions where the fitted parameters evolve along a helix like line.
These results taken together do seem to indicate a nontrivial dynamics in the income distribution evolution whose origins are still basically unknown, although Ref. nm13 provided some possible indications of its origin. More studies are necessary in order to better understand the dynamical significance of the periodic oscillation along the fitted -logarithm (Figs. 1–6), their periodicity (Fig. 7), time unrelated growth pattern (Fig. 8), temporal cycling features (Fig. 9) and helical like evolution (Fig. 10). Nevertheless, since some of these features can be observed in different samples of different countries whose data were fitted by different functions by means of different methodologies, this indicates that these effects are real and deserve further investigation.
| year | ||
|---|---|---|
| 1978 | ||
| 1979 | ||
| 1981 | ||
| 1982 | ||
| 1983 | ||
| 1984 | ||
| 1985 | ||
| 1986 | ||
| 1987 | ||
| 1988 | ||
| 1989 | ||
| 1990 | ||
| 1992 | ||
| 1993 | ||
| 1995 | ||
| 1996 | ||
| 1997 | ||
| 1998 | ||
| 1999 | ||
| 2001 | ||
| 2002 | ||
| 2003 | ||
| 2004 | ||
| 2005 | ||
| 2006 | ||
| 2007 | ||
| 2008 | ||
| 2009 | ||
| 2011 | ||
| 2012 | ||
| 2013 | ||
| 2014 |
4 Conclusions
In this paper we have used the Tsallis functions -exponential and -logarithm to describe the personal income data of Brazil. Yearly samples from 1978 to 2014 were linearized using the -logarithm and fitted to a straight line, providing then a single function representation of the whole distribution using only two parameters. A second order effect not previously reported was clearly noticed in the form of a periodic oscillation of the data around the fitted straight line, whose amplitude steadily grows with increasing income values to finally become clearly visible at the tail of the distribution. In addition, the fitted parameters tend to grow in terms of one another, growth which is unrelated to time, but they do present a time related feature since they cycle chronologically in terms of one another in a general clockwise pattern with a few anti-clockwise turns.
As mentioned in Sect. 1, the Tsallis functions have been previously used by Borges borges and Ferrero ferrero1 ; ferrero3 to describe the personal income distribution, although the former applied them only to the intermediate and tail portions of the distribution of county income data, whereas the latter was applied to samples derived from the income of whole countries, but limited to some specific years only. Here we applied the Tsallis functions to the entire population of Brazil for a time span of almost four decades and fitted the functions to the whole distribution, without subdivisions. However, some of the conclusions reached here are similar to the ones reached by these authors, particularly the suitability of the Tsallis functions to adequately describe the income distribution of a population and that an increase of the parameter seems to imply greater inequality. Indeed, since Brazil has in general higher values for both the Gini coefficient and the parameter as compared to the ones produced by the countries studied by these authors, USA, New Zealand, UK, Japan and Germany, these two coefficients seem to behave similarly: higher values of appear to imply greater income distribution inequality.
Notwithstanding, the observed oscillatory behavior in the linearized complementary cumulative data distribution is a new effect which ought to be considered in future studies of income distribution. It is known that power-law like distributions, which behave as pure power distribution for large values of the independent variable and exponential for , can be identified with the Tsallis distribution as given by Eq. (6). The nontrivial aspect of this distribution is that in different parts of the space defined by the variable one finds the dominance of different dynamical factors. In addition, as discussed by Wilk and Włodarczyk wilk , there are experimental results and empirical observations that can be described by a Tsallis distribution and which exhibit log-periodic oscillations, such as earthquakes huang and stock markets near financial crashes sornette ; vande1 ; vande2 ; wosnitza to name just two of these observed structures (see Ref. wilk, , and references therein). The point is that such oscillating factors are visible in these processes, but are somehow hidden in the distribution given by Eq. (6). When taken into account, such oscillations usually “decorate” the PDF (8) by multiplying it with some log-periodic oscillating factor. What is interesting in the approach of Ref. wilk is that such oscillations are introduced into Tsallis distributions by allowing the parameter to become complex. This happens at the cost of introducing further parameters in the description, but that seems inevitable since such weak, but persistent, oscillating structures in the data indicate that the system under study has scale-invariant behavior and their presence imply into the existence of important dynamical features hidden in the fully scale-invariant description. The consequences for considering these oscillating features into the income distribution problem are still unknown, but if the work of Ref. wilk could be taken as a possible template on how to look at this problem they may imply in important constraints on the underlying income distribution dynamics. Moreover, considering that periodicities do not appear only along the distribution, but are also present in the fitted parameters themselves once they are related to one another, as shown by their chronological cycling behavior along their time evolution, all these features taken together clearly indicate the existence of a nontrivial income distribution dynamics whose origins are unclear and, therefore, deserve further investigation.
Finally, these results bring further questions about the traditional way of representing personal income data by splitting them in two segments, one for the very rich, described by the Pareto power-law, and another for the rest of the population, described by other functions. Such a segmentation forms the basis of the claims that societies are fundamentally structured in a two-classes-income system. The point is that if only one function is able to describe the whole distribution, albeit this function tends to the exponential at low income values and power-law at large ones, such a very well defined class based structure might not be the single most essential feature of societies, but might have its prominence as just a result of a fitting methodology. Hence, there might be an intermediary income range of unknown size whose dynamics may be crucial in the understanding of income dynamics. The point here is that although there may be sociological evidence for a two-classes approach, it might be argued that societies usually have a third, intermediate, middle income segment, known generically as “middle class”, whose dynamics, that is, whose income structure evolution, possibly oscillates between two extremes and be responsible for such oscillatory behaviors. These points may only be clarified once one has a full dynamical theory of income distribution, theory which is still lacking.

Our thanks go to C. Tsallis for the initial suggestions which led to this paper. We are also grateful to two referees for pointing out relevant literature on the log-periodic oscillations and useful comments and suggestions. One of us (M.B.R.) acknowledges partial financial support from FAPERJ.
References
- (1) V. Pareto, “Cours d’Économie Politique”, Lausanne, 1897
- (2) N.C. Kakwani, “Income Inequality and Poverty”, Oxford University Press, 1980
- (3) N.J. Moura Jr., M.B. Ribeiro, “Evidence for the Gompertz Curve in the Income Distribution of Brazil 1978-2005”, Eur. Phys. J. B, 67 (2009) 101-120, arXiv:0812.2664v1
- (4) F. Chami Figueira, N.J. Moura Jr., M.B. Ribeiro, “The Gompertz-Pareto Income Distribution”, Physica A, 390 (2011) 689-698, arXiv:1010.1994v1
- (5) A. Drăgulescu, V.M. Yakovenko, “Evidence for the Exponential Distribution of Income in the USA”, Eur. Phys. J. B, 20 (2001) 585, arXiv:cond-mat/0008305v2
- (6) J.C. Ferrero, “The Statistical Distribution of Money and the Rate of Money Transference”, Physica A, 341 (2004) 575-585
- (7) A. Christian Silva, “Applications of Physics to Finance and Economics: Returns, Trading Activity and Income”, PhD thesis, University of Maryland, 2005, arXiv:physics/0507022v1
- (8) V.M. Yakovenko, J.B. Rosser, “Colloquium: Statistical Mechanics of Money, Wealth, and Income”, Rev. Mod. Phys., 81 (2009) 1703-1725, arXiv:0905.1518v2
- (9) R. Coelho, P. Richmond, J. Barry, S. Hutzler, “Double Power Laws in Income and Wealth Distributions”, Physica A, 387 (2008) 3847-3851, arXiv:0710.0917v1
- (10) A. Banerjee, V.M. Yakovenko, “Universal Patterns of Inequality”, New J. Phys., 12 (2010) 075032, arXiv:0912.4898v4
- (11) N.J. Moura Jr., M.B. Ribeiro, “Testing the Goodwin Growth-Cycle Macroeconomic Dynamics in Brazil”, Physica A, 392 (2013) 2088-2103, arXiv:1301.1090
- (12) Econophys-Kolkata I Workshop, “Econophysics of Wealth Distributions”, A. Chatterjee, S. Yarlagadda, B.K. Chakrabarti (Eds.), Springer, 2005
- (13) B.K. Chakrabarti, A. Chakraborti, S.R. Chakravarty, A. Chatterjee, “Econophysics of Income and Wealth Distributions”, Cambridge University Press, 2013
- (14) E.P. Borges, “Empirical nonextensive laws for the county distribution of total personal income and gross domestic product”, Physica A, 334 (2004) 255-266
- (15) J.C. Ferrero, “The Monomodal, Polymodal, Equilibrium and Nonequilibrium Distribution of Money”, In cyc05 , pp. 159-167, (2005)
- (16) J.C. Ferrero, “An Statistical Analysis of Stratification and Inequality in the Income Distribution”, Eur. Phys. J. B 80 (2011) 255-261
- (17) C. Tsallis, “What are the Numbers that Experiments Provide?”, Química Nova, 17 (1994) 468-471
- (18) C. Tsallis, “Introduction to Nonextensive Statistical Mechanics”, Springer, 2009
- (19) F. Clementi, M. Gallegati, G. Kaniadakis, “-Generalised Statistics in Personal Income Distribution” Eur. Phys. J. B, 57 (2007) 187-193, arXiv:physics/0607293v2
- (20) F. Clementi, T. Di Matteo, M. Gallegati, G. Kaniadakis, “The -Generalised Distribution: a New Descriptive Model for the Size Distribution of Incomes”, Physica A, 387 (2008) 3201-3208, arXiv:0710.3645v4
- (21) F. Clementi, M. Gallegati, G. Kaniadakis, “A -Generalized Statistical Mechanics Approach to Income Analysis”, J. Stat. Mech., February (2009) P02037, arXiv:0902.0075v2
- (22) F. Clementi, M. Gallegati, G. Kaniadakis, “A generalized statistical model for the size distribution of wealth”, J. Stat. Mech., December (2012) P12006, arXiv:1209.4787v2
- (23) T. Yamano, “Some properties of -logarithm and -exponential functions in Tsallis statistics”, Physica A 305 (2002) 486-496
- (24) G. Wilk, Z. Włodarczyk, “Tsallis Distribution Decorated with Log-Periodic Oscillation”, Entropy 17 (2015) 384-400, arXiv:1501.02608v1
- (25) Y. Huang, H. Saleur, C. Sammis, D. Sornette, “Precursors, aftershocks, criticality and self-organized criticality”, Europhys. Lett. 41 (1998) 43-48
- (26) D. Sornette, A. Johansen, J.-P. Bouchaud, “Stock market crashes, precursors and replicas”, J. Phys. I France 6 (1996) 167-175, arXiv:cond-mat/9510036v1
- (27) N. Vandewalle, Ph. Boveroux, A. Minguet, M. Ausloos, “The crash of October 1987 seen as a phase transition: amplitude and universality”, Physica A 255 (1998) 201-210
- (28) N. Vandewalle, M. Ausloos, Ph. Boveroux, A. Minguet, “How the financial crash of October 1987 could have been predicted”, Eur. Phys. J. B 4 (1998) 139-141
- (29) J.H. Wosnitza, J. Leker, “Can log-periodic power-law structures arise from random fluctuations?”, Physica A 401 (2014) 228-250