The acceptance of the HiSPARC experiment
Abstract
Cosmic ray primary particles initiate extended air showers (EAS) in the atmosphere. The directions of these cosmic rays approximate a homogeneous isotropic distribution. The HiSPARC experiment, consisting of a growing number of measurement stations scattered over the Netherlands, Denmark and the United Kingdom, detects EAS particles using scintillators. These detections facilitate reconstructions of the direction of cosmic ray primaries.
The acceptance of the HiSPARC experiment, limited due to the generating mechanism of EASs in the atmosphere and the location of the measurement stations, has been analysed.
keywords:
Cosmic rays, acceptance, HiSPARC.1 Introduction
A high energy primary cosmic ray particle (nucleus, proton, electron, gamma) arrives from a point defined by the celestial bound right ascension/declination -frame. The primary particle generates an EAS (extended air shower) in the atmosphere. HiSPARC stations detect particles in this EAS using two or four scintillators. The location of this station is defined by its longitude and latitude in an Earth bound -frame.
The acceptance of each scintillator is expressed as a distribution of the number of detected EAS per direction [1, p. 78], [2]. This direction is described using the local zenith/azimuth -frame. An east/west effect for high energy charged particles due to the Earth’s magnetic field is negligible. So the distribution is assumed to be independent of the azimuth .
Because the Earth rotates with respect to the celestial sphere, the transformation of the -frame via the -frame into the -frame is time dependant.
2 The distribution of HiSPARC-stations
HiSPARC measurement stations are maintained by participating schools and universities scattered over the Netherlands, Denmark and the United Kingdom, approximately at sea level. As a result longitudes and latitudes are not evenly distributed. The moment in time and the longitude define the mean right ascension of the measured EASs. The latitude defines the mean declination of measured EASs.
A point in the sky above a hypothetical station located on the Equator is visible during a maximum of 12 sidereal hours in a sidereal day because of the rotation of the Earth. The detection time decreases considerably due to the extinction of EASs for larger zenith angles.
A hypothetical station located on the North Pole also detects EASs arriving from the sky above the horizon. Here detections are possible during the entire sidereal day. This increases the detection time dramatically. As a result higher latitudes lead to a longer time window for detections of EASs, and there corresponding cosmic rays, arriving from a smaller part of the sky.

The longitudinal distribution of HiSPARC stations is shown in fig. 2.2. This distribution defines the center of the time window for detectable EASs. Longitudes are between and E. The Earth turns /hour. A station at E detects cosmic rays arriving from a celestial area about 54 minutes before a station at E111A cosmic ray source is in transition, moving from the local eastern celestial hemisphere to the western hemisphere..

3 Zenith angle
Fig. 3.1 shows the zenith angle between the traveling direction of the cosmic ray primary and the zenith of the detection station located at . The location of the detection station on a given time is expressed in the ECEF222Earth Centre Earth Fixed, the equatorial plane is defined by and . The -axis points towards the Greenwich meridian. TheEarth axis, pointing to Polaris, defines the -axis.-frame using the longitude and latitude as:
| (3.1) |
The direction of the cosmic ray induced air shower can be expressed on a given time in the ECEF-frame using the right ascension and the declination .
| (3.2) |

Using these expressions the zenith angle is the angle between the direction of the cosmic ray and the location of the scintillator:
| (3.3) |
A detection station, located on the Earths surface, turns around the -axis in a sidereal day. The Right Ascension is the only time dependent variable. Using the local hour angle333The local hour angle of an area is defined as the angle between the area and the zenith, both projected on the equatorial plane. One hour is equal to an angle of . instead of the right ascension, the local longitude of the scintillator is set to :
| (3.4) |
Leading to:
| (3.5) |
The flux444It must be noted that the geometry of the detector leads to a dependency of the distribution of . The extinction of the shower on sea level is thus defined by . The exponent , defining the extinction, is energy and height dependent. in an area at with a width of and a height is defined as [2]:
| (3.6) |
| (3.7) |
The local right ascension is the time dependent variable.
4 The longitudinal dependency of a detected celestial area
Using eq. 3.7 the flux of cosmic rays is calculated as a function of the local hour angle and the location. The time window for an celestial area passing through the zenith of the detection station is calculated.

In this case latitude and declination are equal, . Eq. 3.7 is written as:
| (4.1) |
The location of a celestial area is defined in the -frame, and moves along a circle of latitude () as show in fig. 4.1. The calculated EAS-flux from this area is plotted in fig. 4.2 as a function of the hour angle. EAS coming from this direction can roughly be measured between 5 hours before and after the transition.

The measured time window per station increases slightly when comparing a northern with a southern stations within HiSPARC555The circumference of circles where latitude and declination are equal, decreases when the declination increases.. As shown in fig. 2.1 the difference in latitudes is much smaller than the field of view of a scintillator.
5 Amsterdam Science Park


EAS emerging from areas with higher or lower declinations then the latitude are detected too. The time windows of these distributions are analysed using the Amsterdam Science Park cluster at the center of the HiPARC experiment.
The Amsterdam Science Park cluster, located around , contains 11 stations, each using 4 scintillators, scattered over an area of . One of the stations is located in the lobby of the Nikhef building. All other stations are located on roof tops.
As shown in fig. 5.2 the distribution is flat for . Moving down in steps from to the width of the time window decreases considerably.
6 The latitudinal dependency of a detected celestial area
As shown in fig. 5.2 the longitudinal distribution of a station with a fixed latitude largely depends on the declination .
The location of a possible cosmic ray hot spot can be defined in the right ascension/declination -frame. The daily number of detected particles in EASs, initiated by these cosmic rays, is proportional to the integral of the acceptance (eq. 3.7) over a sidereal day as long as , or .

The integral depends on the parameters and . The resulting distributions, found by integration of eq. 3.7 over , are shown as a function of the declination for different values of the lattitude in fig. 6.1. During an entire day the HiSPARC experiment detects cosmic rays arriving from around Polaris ().
7 Experimental verification
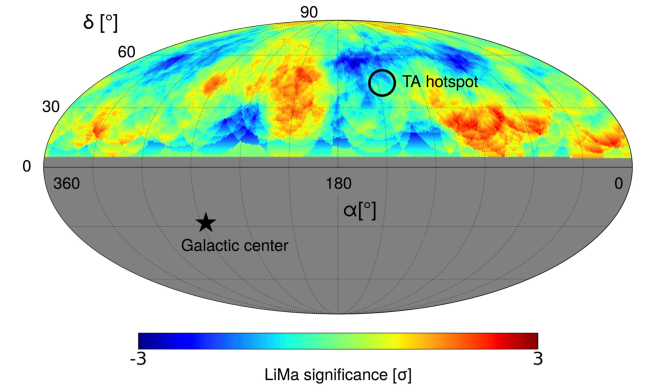
The distribution of fig. 6.1 has been used in a HiSPARC survey of cosmic ray hotspots [3] with . In fig. 7.1666’TA hotspot’ indicates the location of the hotspot as measured by Telescope Array [4] for . the flux, as measured by the Amsterdam Science Park, is scaled using the acceptance. A significance of can be interpreted as maximum difference of .3%. So the flux measured by HiSPARC and the acceptance of fig. 6.1 are in close agreement.
8 Conclusion
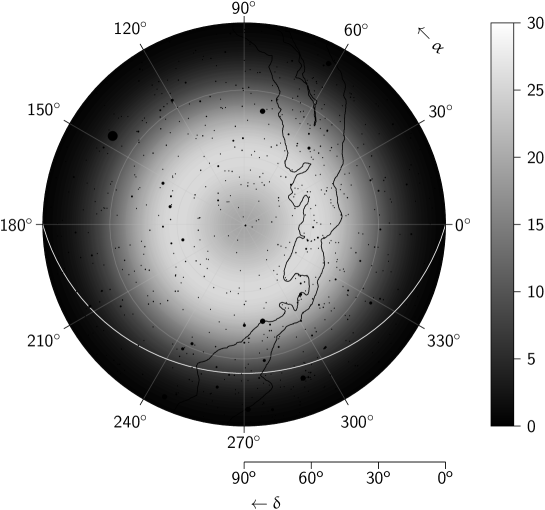
The HiSPARC experiment has a symmetric field of view around Polaris. In fig. 8.1 the Suns trajectory / ecliptic is shown as a white curve. The acceptance is shown in grey-scales from 0% (black) to 30% (white) for the Science Park cluster. Both the borders of the Milky Way and the stars are shown in black. Ursa major is on the left side.
The solar magnetic field influences the trajectory of the charged cosmic ray primaries in a high degree within an angle of measured from the direction of the Sun, a point on the ecliptica. The geometry of the HiSPARC experiment, with distances between detection stations of up to 1000km, facilitates the detection of the Gerasimova-Zatsepin effect.
The magnetic field of the Sun effects the distance between the resulting simultaneous parallel EAS caused by a spallation [5]. During winter the Sun is always outside the view of the HiSPARC experiment. During a part of the day in summer the magnetic field of the Sun causes distances between simultaneous parallel EAS larger then the area covered by the HiSPARC experiment.
References
- [1] K. Greisen “The extensive air showers in J. G. Wilson (ed.)” In Progr. Cosmic. Ray. Phys. 3, 1956
- [2] N.. Schultheiss “The field of view of a scintillator pair for cosmic rays” In ArXiv e-prints, 2016 arXiv:1601.00849 [astro-ph.IM]
- [3] S.. Beijen Private communication
- [4] R.. Abbasi “Indications of Intermediate-Scale Anisotropy of Cosmic Rays with Energy Greater Than 57 EeV in the Northern Sky Measured with the Surface Detector of the Telescope Array Experiment” In Astrophys. J. 790, 2014, pp. L21 DOI: 10.1088/2041-8205/790/2/L21
- [5] Gustavo A. Medina-Tanco and Alan A. Watson “The Photodisintegration of cosmic ray nuclei by solar photons: The Gerasimova-Zatsepin effect revisited” In Astropart. Phys. 10, 1999, pp. 157–164 DOI: 10.1016/S0927-6505(98)00056-5