Thick Disks, and an Outflow, of Dense Gas in the Nuclei of Nearby Seyfert Galaxies
Abstract
We discuss the dense molecular gas in central regions of nearby Seyfert galaxies, and report new arcsec resolution observations of HCN (1-0) and HCO+ (1-0) for 3 objects. In NGC 3079 the lines show complex profiles as a result of self-absorption and saturated continuum absorption. H13CN reveals the continuum absorption profile, with a peak close to the galaxy’s systemic velocity that traces disk rotation, and a second feature with a blue wing extending to km s-1 that most likely traces a nuclear outflow. The morphological and spectral properties of the emission lines allow us to constrain the dense gas dynamics. We combine our kinematic analysis for these 3 objects, as well as another with archival data, with a previous comparable analysis of 4 other objects, to create a sample of 8 Seyferts. In 7 of these, the emission line kinematics imply thick disk structures on radial scales of 100 pc, suggesting such structures are a common occurrence. We find a relation between the circumnuclear LHCN and Mdyn that can be explained by a gas fraction of 10% and a conversion factor between gas mass and HCN luminosity. Finally, adopting a different perspective to probe the physical properties of the gas around AGN, we report on an analysis of molecular line ratios which indicates that the clouds in this region are not self-gravitating.
keywords:
Galaxies: nuclei – galaxies: active – galaxies: ISM – galaxies: Seyfert – submillimetre: galaxies1 Introduction
The standard unification scheme for active galactic nuclei (AGN) proposes that the intrinsic properties of AGN are similar, and the disparity of observational properties arises from the different viewing angles with respect to an obscuring medium, resulting in type 1 and type 2 AGNs (Antonucci, 1993; Urry & Padovani, 1995). The reality may be more complex than this simple picture suggests (Netzer, 2015) although there is general agreement that the obscuring medium of gas and dust is a geometrically and optically thick toroidal structure (perhaps including an outflowing wind, e.g. Elitzur & Shlosman 2006) surrounding the AGN accretion disk, with its inner edge at the dust sublimation radius. Numerous observations confirm that there is dust at temperatures in the range 1000–1500 K (e.g. see Burtscher et al. 2015 and references therein). And a variety of models for smooth (Pier & Krolik, 1992; Granato & Danese, 1994; Granato et al., 1997; Schartmann et al., 2005; Fritz et al., 2006) and clumpy (Krolik & Begelman, 1988; Nenkova et al., 2002; Hönig et al., 2006; Schartmann et al., 2008, 2014) media have been constructed to reproduce the spectral energy distribution (SED) at infrared wavelengths as well as the silicate feature at µm (Schweitzer et al., 2008). However, a number of difficulties remain when applying these models to observations. Feltre et al. (2012) point out that in addition to the parameters describing the physical geometry, the assumptions built into the models can have a major impact on the resulting SED. And in the best studied cases where interferometry can spatially resolve some of the structure, a component that is aligned along a direction consistent with an outflow appears to be responsible for much of the mid-infrared continuum (Tristram et al., 2014). Finally, in the context of the observations we present here, the outer edge of the torus is poorly defined for the majority of these models, because beyond a few tens of parsecs it contributes relatively little to the warm dust continuum against which the models are tested.
On radial scales of tens to a hundred parsecs, it is not clear whether one should still refer to the gas and dust structure as a torus or a (circum-)nuclear molecular disk. There have been claims that even on these scales the molecular disk is thick enough to have an impact on obscuration towards the AGN and so contributes to the observed difference between type 1 and type 2 AGN (Hicks et al., 2009; Sani et al., 2012); and hydrodynamical simulations suggest that turbulence injected via supernova from recent or on-going star formation can puff up the disk to heights of pc (Wada et al., 2009; Wada, 2012). Spatially resolving molecular tracers on these scales in nearby AGN has become possible during the last decade, through the use of adaptive optics systems operating at near-infrared wavelengths and interferometers working in the millimetre regime.
Hicks et al. (2009) observed the K H2 via the 2.12 1-0 S(1) line. In most cases the velocity dispersion () of this line exceeded its rotational velocity () on radial scales of pc. Their conclusion was that the disk is relatively thick. The 2.12 line traces a small excited fraction of the H2 mass that might have peculiar kinematics, so that kinematics from a tracer of the bulk of the molecular gas is desirable. Using the 3 mm HCN (1-0) line, Sani et al. (2012) modeled the emission as a rotating disk, and also found that a large intrinsic velocity dispersion () was required to match the observations. Intriguingly, these results together, –100 km s-1 and –40 km s-1, suggest that the molecular gas is stratified with the warmest gas being the most turbulent and reaching to larger scale heights while the denser clouds remain closer to the disk plane. Although several observations (e.g. Hicks et al. 2009 and Müller-Sánchez et al. 2013) have confirmed the presence of thick disks with on radial scales of pc in some objects, it is not clear how the kinetic energy is continuously supplied in order to maintain the vertical structure of a rotating disk. One plausible explanation is that nuclear star formation can provide the necessary energy. Stellar radiation pressure (Thompson et al., 2005) is one option if there are sufficient OB stars and the ISM is optically thick. However, while some observations are consistent with on-going star formation (Esquej et al., 2014; Riffel et al., 2009), others point more towards post-starburst populations (Cid Fernandes et al., 2004; Davies et al., 2007), and in some cases there is clear evidence that there cannot be on-going star formation in the central tens of parsecs (Hicks et al., 2013). Alternatively, supernova explosions, associated even with a very modest star formation rate, are able to generate sufficient turbulence in the disk to yield km s-1 to radii of 25 pc (Wada & Norman, 2002; Wada et al., 2009). A third possibility is that the gas flows induced by disk instabilities toward inner radii can also maintain a thick disk (Hopkins et al., 2012). Vollmer et al. (2008) also argued that the energy from inflowing gas could in principle be used to thicken the central disk.
The main purpose of this work is to model the intrinsic geometry (i.e. radial and height scales) of the molecular disk in the central pc around AGN, by using high resolution HCN (1-0) and HCO+ (1-0) observations. In addition, we use Large Velocity Gradient (LVG) calculations for molecular line ratios to constrain the cloud properties in one of the objects, NGC 6951.
The HCN and HCO+ molecules are ideal indicators of dense gas, since the higher dipole moments of their 1-0 rotational transitions can trace –500 times denser gas than the same rotational transitions of the CO molecule, and are sensitive to gas at cm-3 (Papadopoulos, 2007). These molecules have been successfully observed not only in dense star-forming regions but also in a number of Seyfert galaxies (Krips et al., 2008; Kohno, 2005; Kohno et al., 2008; Sani et al., 2012), although typically at resolutions of 5–20 arcsec. In the nuclear region of Seyfert galaxies, HCN (1-0) and HCO+ (1-0) can be excited either by UV light from the accretion disk or X-ray radiation from the corona (Sternberg & Dalgarno, 1995; Maloney et al., 1996; Lepp & Dalgarno, 1996; Meijerink & Spaans, 2005; Boger & Sternberg, 2005; Meijerink et al., 2007, and the references therein).
This paper is organized as follows. The HCN (1-0) and HCO+ (1-0) observations of NGC 3079, NGC 6764, and NGC 5033 are described in Section 2. We present the observed molecular gas distribution and kinematics for each galaxy in Section 3. We apply a simple dynamical model to the emission lines in Section 4, and in section 5 use the H13CN (1-0) absorption to estimate the column density of the disk in NGC 3079. Section 6 brings in data from the literature to explore the relation between HCN luminosity and dynamical mass for a sample of 8 objects with high spatial resolution HCN observations. Finally, Section 7 looks more closely at the cloud properties for one specific object NGC 6951 where data for suitable transitions are available. We summarize our conclusions in Section 8.
(1) Source name; (2) Beam size; (3) Beam position angle; (4) Channel width; (5) noise per beam; (6) Distance; (7) Physical scale of 1″.
| Source | Beam size | P.A. | Channel resolution | Noise | Distance | scale |
|---|---|---|---|---|---|---|
| (degree) | (km s-1) | (mJy beam-1 ch-1) | (Mpc) | (pc/″) | ||
| NGC 3079 | 1.17 0.94 | 167 | 17.1 | 0.37 | 20 | 85 |
| NGC 6764 | 1.16 0.78 | 13 | 34.4 | 0.29 | 32 | 150 |
| NGC 5033 | 1.13 0.83 | 38 | 34.2 | 0.31 | 19 | 73 |
2 Observations
We used the six 15-m antennas of the IRAM Plateau de Bure interferometer (PdBI) to observe NGC 3079, NGC 6764, and NGC 5033 at 88 GHz (3 mm) with the WideX correlator in the extended A configuration. The basic calibration steps of three galaxies were done with the CLIC software. The observations for the individual galaxies are described below and summarised in Table 1.
Observations of NGC 3079 (systemic velocity 1147 km s-1 and inclination 77, Koda et al. 2002) were carried out on 19 January 2011 for programme UD8A. The receiver band was centered at 87.55 GHz with its 3.6 GHz bandwidth covered all features from HCO+ (1-0) at 89.2 GHz to H13CN (1-0) at 86.3 GHz (rest frequencies). During the 5.5 hr track the average antenna efficiency was 22.6 Jy/K, and the precipitable water vapour (pwv) improved during the track from 2–4 mm to mm. The calibrators include 3C273, 0923+392, 0954+556, and MWC349. After data reduction, the synthesised beam at 89 GHz was at position angle (PA) . The data were binned to a spectral resolution of 5 MHz corresponding to a channel width of 17 km s-1, yielding a root mean square uncertainty of 0.37 mJy/beam. This was chosen in order to balance signal-to-noise with high spectral resolution since some of the absorption features are much narrower than the emission lines. Images of the channels were reconstructed with a pixel size of 0.2″. We adopt a distance to NGC 3079 of 19.7 Mpc, for which 1 corresponds to 85 pc.
NGC 6764 was also observed on 19 January 2011, after NGC 3079, with the receiver band centered at 87.15 GHz. This setting was based on the systemic velocity of 2416 km s-1 used by Hota & Saikia (2006), who found deep H I absorption on the location of the nucleus at a velocity of 2426 km s-1 consistent with that velocity. However, the profiles of both the HCN (1-0) and HCO+ (1-0) lines in our data are centered at 2468 km s-1 (each differing by only 10 km s-1 from that mean). This implies that the H I may be outflowing, a phenomenon that has been observed in a number of galaxies (see Morganti 2012 for a review), for example in the Seyfert IC 5063 the H I absorption is blue-shifted with respect to the H I emission with velocities comparable to a blue wing in the CO (2-1) line (Morganti et al., 2007, 2015). In our analysis we use 2468 km s-1 as the systemic velocity for NGC 6764. We also adopt an inclination of 62 based on CO (1-0) kinematics (Leon et al., 2007). During the 4.9 hr track the average antenna efficiency was 22.9 Jy/K, and the pwv was mm. The calibrators include MWC349, 1954+513, 1739+522, 1749+096, and 1823+568. The synthesised beam at 89 GHz in the processed data was at a PA of . The data were spectrally binned to 10 MHz, corresponding to a channel width of 34 km s-1 and a root mean square uncertainty of 0.29 mJy/beam. The channel binning is coarser than for NGC 3079 but sufficient to sample the velocity width of the emission lines. In order to fit disk models, the data were converted to an image plane with a pixel size of 0.3″. We adopt a distance to NGC 6764 of 31.7 Mpc, for which 1 corresponds to 150 pc.
Observations of NGC 5033 (systemic velocity 875 km s-1, Huchra et al. 1995; inclination 68, Thean et al. 1997 and Kohno et al. 2003) were conducted over two nights on 26 and 28 January 2011, with tracks of 3.1 hrs and 3.9 hrs respectively. The receiver band was centered at 87.60 GHz. The average antenna efficiency of 22.7 Jy/K, with pwv mm on the first night and mm on the second night except near the end when it increased slightly. The calibrators include 3C273, MWC349, 1308+326, and 0355+508. After data reduction, the synthesised beam size at 89 GHz was at a PA of . The reconstructed data for NGC 5033 share the same spectral binning and pixel size as NGC 6764, and have a root mean square uncertainty of 0.31 mJy/beam. We adopt a distance to NGC 5033 of 18.7 Mpc, for which 1 corresponds to 73 pc.
We also make use of HCN (1-0) data for NGC 7469 presented in Davies et al. (2004), which have a beam size of . We adopt a distance of 58 Mpc and an inclination of 45.
(1) Source name; (2) Flux density; (3) The observed FWHM of the major and minor axes; (4) Position angle (east of north).
| Source | Flux density | Major Minor axis | P.A. |
|---|---|---|---|
| (mJy) | (arcsec2) | () | |
| NGC 3079 | 27.8 0.15 | 1.19 0.01 1.06 0.01 | 176 1 |
| NGC 6764 | 0.6 0.06 | 1.04 0.05 0.82 0.04 | 8 2 |
| NGC 5033 | 0.7 0.08 | 1.01 0.04 0.79 0.03 | 41 2 |
(1) Source name; (2) Molecule; (3) Fluxa; (4) Observed FWHM of major and minor axes; (5) Position angle (east of north); (6) Separation between centers of red and blue channel maps; (7) Position angle between centers of the red and blue channel maps; (8) Spectral FWHM of line (3″ aperture).
| Source | Line | Flux | Major minor axis | PA | b/r sep. | PAb/r | Line width |
| (Jy km s-1) | (arcsec2) | () | (arcsec) | () | (km s-1) | ||
| NGC 3079 | HCN | 8.20b | (2.94 0.14) (1.44 0.06) | 167 2 | 1.51 0.02 | -21 2 | 360c |
| HCO+ | 4.78b | strong absorption | strong absorption | 1.70 0.04 | -20 2 | - | |
| NGC 7469 | HCN | 5.30 0.10 | (3.43 0.10) (2.73 0.08) | 78 15 | 1.14 0.04 | 118 2 | 236 9 |
| NGC 6764 | HCN | 1.92 0.11 | (1.71 0.14) (1.31 0.09) | -54 25 | 0.82 0.11 | -87 7 | 214 17 |
| HCO+ | 2.28 0.09 | (1.69 0.11) (1.21 0.06) | -66 7 | 1.04 0.11 | -85 8 | 203 16 | |
| NGC 5033 | HCN | 1.16 0.14 | (1.97 0.30) (1.09 0.13) | -17 10 | 1.06 0.15 | 158 19 | 181 32 |
| HCO+ | 0.71 0.14 | (1.76 0.40) (1.22 0.20) | 52 67 | 0.99 0.56 | 184 51 | 185 71 |
a These are given in a 3″ aperture, except for NGC 3079 where we have used a 5″ aperture.
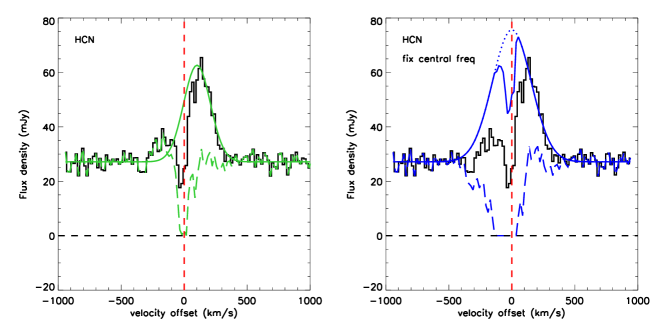
b Fluxes are integrated across the observed line profile above the continuum level. Applying corrections in a simple way as illustrated by the blue line in the right panel of Figure 4 yields fluxes for HCN (1-0) of 16.1 Jy km s-1 when accounting for only the continuum absorption, and 18.7 Jy km s-1 when also accounting for the self-absorption. The equivalent corrected fluxes for the HCO+ (1-0) line are 13.3 and 19.5 Jy km s-1.
c Estimated intrinsic line width after correcting for continuum absorption and self-absorption (i.e. it corresponds to the blue Gaussian line profile in the right panel of Fig 4). We have adopted an uncertainty of 20 km s-1 typical of the other linewidth measurements.
3 Gas distribution and kinematics
We begin this section by describing the general properties of the three galaxies, and then present the details for each individual source in the following subsections. HCN (1-0) at 88.63 GHz, and HCO+ (1-0) at 89.19 GHz were detected in all galaxies.
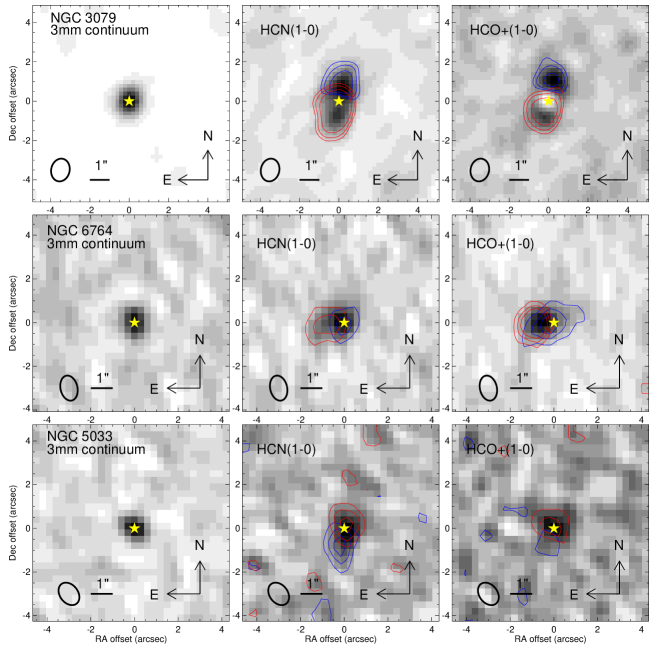
In every case, the 3 mm continuum (spectrally integrated over channels that are free from molecular transitions) is seen as a single compact source. Since the major and minor axes, and the position angle, are very close to those of the beam, the continuum appears to be spatially unresolved. The flux density and morphology of the continuum sources are derived from line-free regions of the spectrum, and are given in Table 2.
In contrast, the HCN (1-0) and HCO+ (1-0) emission line morphologies are spatially extended, although by not more than a few arcsec. We define the centre from the continuum image, and extract an integrated spectrum in a 3″ diameter aperture around that. The flux density of the emission lines is derived from this by summing over all channels across the spectral line profile. It is important to note that for NGC 3079, HCN (1-0) and HCO+ (1-0) both show a clear P-Cygni shape, with absorption cutting through the emission line profile. For both NGC 6764 and NGC 5033, the lines are seen in emission only. As for the continuum, the morphology of the molecular lines is quantified by fitting a two-dimensional Gaussian function to the line map. In addition, we have measured the centers of the emission summed over red channels and blue channels separately (the velocity ranges are from line centre to –480 km s-1 depending on the line and object; specific ranges are given in the following subsections), in order to derive their relative separation and position angle. The observed properties of the molecular emission lines are summarized in Table 3.
3.1 NGC 3079
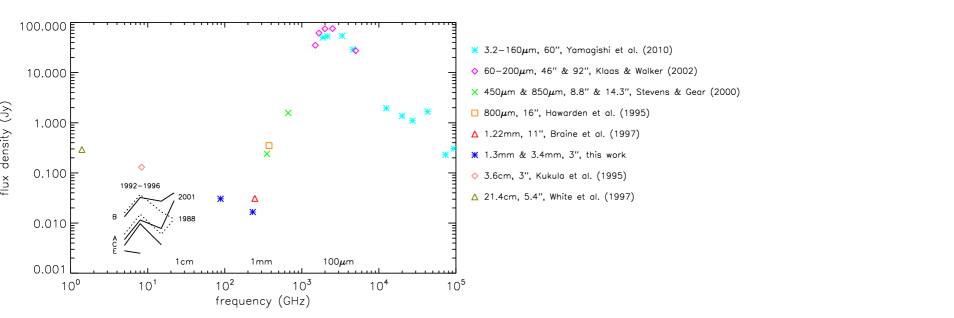
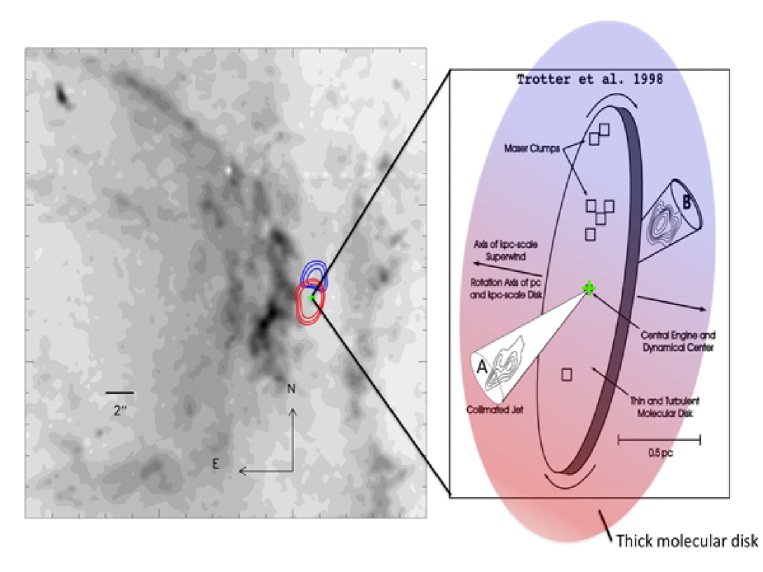
The 3 mm continuum is displayed in the left panel of Figure 1. A Gaussian fit indicates FWHM of at a PA of 176. These are comparable to the beam size, indicating that the source is not spatially resolved, and has an intrinsic size ″. Because of the absorption features we have observed, the origin of the 3 mm continuum is an important issue. Maps of the radio continuum at 5–22 GHz and at resolutions to mas (Trotter et al., 1998; Kondratko et al., 2005; Middelberg et al., 2007) demonstrate that it is dominated by regions that are 1–3 pc from the dynamical centre as defined by Trotter et al. (1998). Figure 2 shows the radio to infrared SED for NGC 3079 and indicates that the two radio lobes A and B are likely to dominate also the 3 mm continuum. In 2001, the sum of the flux densities of these two components (68 mJy) at 22 GHz was equal to the total radio continuum integrated over arcsec scales; and there is some evidence that they have continued to brighten at 22 GHz in subsequent years (Middelberg et al., 2007). The discussion below is based on the conclusion that the 3 mm continuum, which is clearly non-thermal, is dominated by the radio components A and B, rather than by any emission from the dynamical centre.
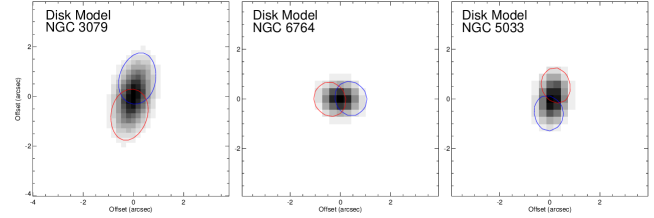
The maps of HCN (1-0) and HCO+ (1-0) are presented in the middle and right panels of Figure 1. The grey scale image indicates the full line distribution, while the red and blue contours represent the distribution of integrated red channels and blue channels of the emission lines. For NGC 3079, the ranges for both lines extend from line centre to approximately km s-1 and km s-1. The spatial separation and PA of the centroids of these two channels are and 21. The absorption is clearly visible in the central region for both molecules. In particular, HCO+ has stronger absorption than HCN. While this means we cannot reliably fit a Gaussian to the HCO+ emission, it is still possible to do so on the HCN map. The resulting FWHM is and PA is 167 (Table 3).
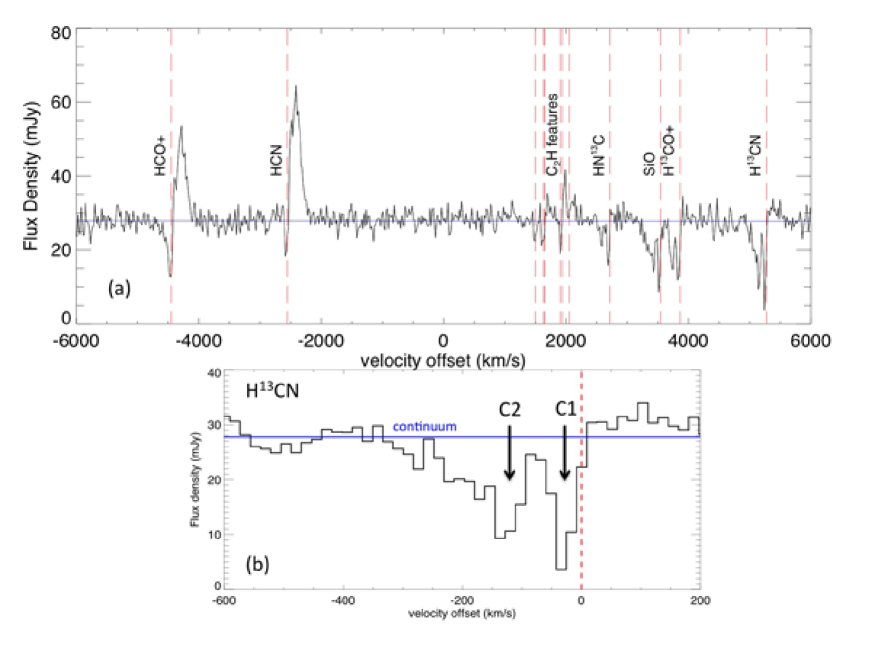
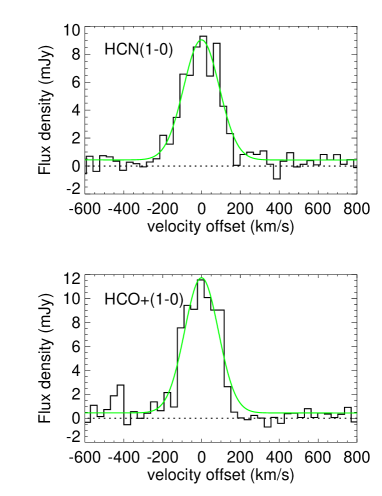
Panel (a) of Figure 3 shows the integrated spectrum of NGC 3079. Although a clear P-Cygni line profile is apparent for the HCN (1-0) and HCO+ (1-0) line due to the strong emission of these lines, blue-shifted absorption with two or more components dominates the profile of other lines where an emission component is weak or absent. These include H13CN (1-0) at 86.34 GHz, H13CO+ (1-0) at 86.75 GHz, SiO (2-1) at 86.85 GHz, and HN13C (1-0) at 87.09 GHz (rest frequencies). The narrow absorption peak closest to systemic velocity is strongly absorbed, reaching maximum depths of 87%, 56%, 71%, and 42% of the continuum level respectively. The absorption profiles show a second narrow peak with a blue-shifted tail (that may itself contain several sub-components) that reaches to -350 km s-1. The absorption that we have identified as C2H at 87.3–87.4 GHz is at relatively low signal-to-noise and is likely to include features from several of the hyperfine transitions (Gottlieb et al., 1983; Schöier et al., 2005). We therefore exclude this from our analysis.
Panel (b) of Figure 3 shows the double peaked absorption of H13CN (1-0). While there may be substructure within the full velocity extent of the absorption, for our analysis, and discussion of the implications, in Section 5 we consider this as only two features. The reason is that we prefer to interpret the absorption in the context of its physical origin, and we argue in Section 5 that the narrow peak closer to systemic is due to absorption by the nuclear disk, while the more blue-shifted component, as well as its high velocity tail, originates in absorption by outflowing gas clouds. We note also that the absorption profile of the H13CN (1-0) line is very different to that of HCN (1-0). This is for two reasons: it is not saturated while, as discussed below, the HCN (1-0) absorption is strongly saturated (and as a result one cannot use the H13CN (1-0) profile to correct for the HCN (1-0) absorption); and because any associated line emission is very weak, the absorption profile is not partially filled, as is the case for the HCN (1-0) line. These issues are discussed in detail below in Section 3.1.1.
There are few reports of HCN (1-0) or HCO+ (1-0) absorption in the literature. This could be because most mm spectra of galaxies are still from single dish rather than interferometric observations and, as we discuss below in Section 3.1.2, extended low intensity emission will tend to fill in any absorption of a weak continuum. The two cases of which we are aware, blue-shifted HCO+ (4-3) absorption in Arp 220 (Sakamoto et al., 2009) and red-shifted HCN (3-2) and HCO+ (3-2) absorption in IC 860 (Aalto et al., 2015), were both obtained with sub-arsec resolution interferometric observations.
3.1.1 Correction for absorption
The observed (i.e. without correcting for the absorption) flux of HCN (1-0) is 8.20 Jy km s-1 and of HCO+ (1-0) is 4.78 Jy km s-1, both in 5″ apertures to cover the full extent of the observed emission. In order to estimate a correction for the absorption, we fit a Gaussian function to the emission profile, including an additional constraint that the intrinsic absorption as measured from the continuum level cannot go below zero. This approach is motivated under the assumption that the absorption and emission are effectively independent: the absorption at any given velocity occurs over a very small area (defined by the size and location of continuum sources) while the emission is integrated over the full extent of that isovelocity contour across the molecular disk (note that we did not require that the centre of the symmetric emission should be exactly at the systemic velocity of molecular line because the line emission may not be symmetric about the centre of the rotating disk), and partially fills the absorption. The best fitting profile is shown as a solid green line in the left panel of Figure 4, where the black solid line traces the observed HCN (1-0) profile. The difference between these is represented by the dashed green line, which traces the intrinsic absorption profile from the continuum level. Its truncated shape indicates that the HCN (1-0) line is strongly saturated. The strong red wing of the observed emission profile, and the constraint on the depth of the intrinsic absorption, result in a fit whose peak is offset by km s-1 from systemic and which under-estimates the blue wing of the emission line profile. In addition, the continuum absorption lacks the blue wing seen in the H13CN profile. To avoid these discrepancies we have made a second reconstruction, which is shown in the right panel of Figure 4. For this, we have added the requirement that the intrinsic Gaussian line profile (dotted blue line) should be centered at the systemic velocity. We find that, because the continuum absorption (dashed blue line) cannot go below zero, the reconstructed line profile (solid blue line) cannot be Gaussian – noting that the sum of these two must match the observed profile. Instead, in comparison to the Gaussian, it shows absorption that is roughly symmetric and centered approximately at the systemic velocity. We interpret this to mean that the HCN (1-0) line is self-absorbed. Self-absorption in an HCN (1-0) line has been reported in IC 860 and Arp 220 W by Aalto et al. (2015) in the context of the compact obscured nuclei of luminous and ultraluminous infrared galaxies. It has also been reported in the CO 2-1 and CO 6-5 lines in Arp 220 by Engel et al. (2011) and Rangwala et al. (2015) respectively. In the case of NGC 3079 we suggest that it is occuring because the galaxy is inclined so close to edge on. As such, there is plenty of cool gas in the disk of the galaxy along the line of sight, that could absorb the line emission. From the depth of the self-absorption we estimate that a total column of cm-2 is needed to produce it, corresponding to cm-2 if we adopt the same abundance as in Section 5 or as much as a few cm-2 for a more typical lower HCN abundance. The absorption is at the systemic velocity because the disk motion along the line of sight to the nucleus is across the plane of the sky.
Based on our reconstruction, the flux of the self-absorbed HCN (1-0) line is 16.1 Jy km s-1 (nearly a factor 2 greater than the observed flux) while the total flux of the intrinsic Gaussian is 18.7 Jy km s-1. A similar analysis of the HCO+ (1-0) line confirms that it does suffer more from absorption: our estimate of the self-absorbed flux is 13.3 Jy km s-1 (nearly a factor 3 greater than that measured directly) and the intrinsic flux in the Gaussian is 19.5 Jy km s-1. The FWHM of the intrinsic Gaussian profile is 360 km s-1, which we have included in Table 3.
3.1.2 Comparison with single dish measurements
A spectrum of NGC 3079 including the lines discussed above was presented previously by Costagliola et al. (2011). This was based on data from the IRAM 30 m telescope, with a beam size of 29″ at 88 GHz. While the HCN (1-0) and HCO+ (1-0) lines both show a double-peaked profile – which can be generally interpreted as disk rotation or be indicative of either continuum absorption or self-absorption in the centre – their fluxes of 24.6 and 27.7 Jy km s-1 are several times greater than observed with our interferometric beam, and the line widths of 500 km s-1 FWHM are significantly broader. They also detect a strong blend of C2H emission at about 87 GHz which we detect only weakly. The difference in line fluxes suggests that there is significant, but low intensity, emission from these lines on scales greater than a few arcsec. As is apparent from our data, as one integrates the flux within larger apertures, the absorption below the continuum level is filled in by the additional line emission included in the aperture, and so the line appears broader. It is likely that in the single dish measurement, continuum absorption has only a minor impact, and the double peaked profile is likely to be due to self-absorption (we note that the dip between the peaks is to a similar depth as our reconstructed self-absorbed profile). If one does not correct for this, the line width will be overestimated. For the interferometric spectrum in Figure 4, we can estimate the effective FWHM of the self-absorped profile by fitting a single Gaussian to the double-peak profile. Approximating the profile in this way yields a FWHM of 450–470 km s-1, similar to the 500 km s-1 width reported by Costagliola et al. (2011) but significantly more than the intrinsic FWHM of 360 km s-1. Similarly, once one corrects for the continuum absorption, the ratio of the HCN (1-0) and HCO+ (1-0) line fluxes is similar to that reported by Costagliola et al. (2011). We conclude that while our spectrum looks rather different from the single dish spectrum, all the differences can be understood as a result of extended low intensity emission and the aperture dependent impact of continuum absorption on the observed profile.
3.2 NGC 6764
The 3 mm continuum map is shown in the bottom left panel of Figure 1. Its FWHM of and PA of indicate it is spatially unresolved. Within a 3″aperture, the continuum flux density is 0.6 mJy.
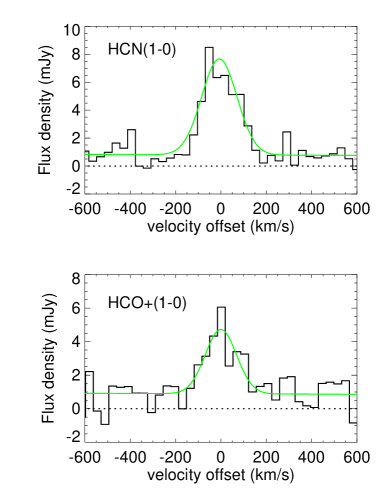
Figure 1 also shows the integrated HCN (1-0) and HCO+ (1-0) maps in the bottom middle and right panels, and the measurements and the line fluxes are summarised in Table 3. The HCN (1-0) emission has an extent of at PA , similar to the at PA of the HCO+ (1-0) line. The red and blue channels of emission (from line centre to km s-1 and km s-1 for HCN; to km s-1 and km s-1 for HCO+) also have the same separation of 0.82″ at PA . Figure 5 shows integrated spectra covering the two line profiles including a constant continuum level. Their FHWMs are 214 km s-1 and 203 km s-1 respectively. Taken together, these measurements indicate that the distributions and kinematics of the two lines are very similar, and hence that they originate in the same region. This means that when constructing a simple dynamical model, as discussed in Sec. 4, we can constrain it using both lines, which provides an additional robustness against limitations of signal-to-noise or line specific peculiarities.
3.3 NGC 5033
The 3 mm continuum for NGC 5033 is presented in the top left panel of Figure 1, and has a flux density within a 3″ aperture of 0.7 mJy. A Gaussian fit gives a size of at PA 41. As for the other 2 galaxies, this is consistent with the continuum being spatially unresolved.
The HCN (1-0) and HCO+ (1-0) maps are shown in the top middle and right panels of Figure 1 respectively. The measured sizes are at PA and at PA respectively. We note that the latter case, HCO+ (1-0) has a large uncertainty which we attribute to the weaker HCO+ (1-0) line flux. As before, the blue and red contours represent the line emission from blue and red channels (from line centre to km s-1 and km s-1 for HCN; to km s-1 and km s-1 for HCO+). Their separations are and respectively. The PA for HCN (1-0) is ; the PA for HCO+ (1-0) differs from this but has a large uncertainty because of the low signal-to-noise in the blue channels, and is still consistent with the HCN (1-0). Figure 6 shows spectra extracted within a aperture. The flux of HCN (1-0) is 1.2 Jy km s-1 and of HCO+ (1-0) is 0.71 Jy km s-1. The two lines have similar width, with a mean FWHM of 183 km s-1. Again, we find that the distributions and kinematics of the two lines are similar, and hence conclude that they originate from the same region.
4 Modelling the kinematics
The description above of the observed characteristics shows the FWHM of the line is typically 200 km s-1. Comparable line widths for the HCN (1-0) line were reported previously for the central hundred parsecs of several AGN by Sani et al. (2012). Our aim in this Section is to understand whether the line widths can be accounted for by a thin rotating disk, or whether it implies there is a significant intrinsic dispersion associated with the molecular disk of dense gas. To do so we create a simple dynamical model that can match the observed characteristics of the molecular line emission, using the same methodology as Sani et al. (2012).
To constrain our model we use four of the observed molecular gas properties listed in Table 3: (1) major axis FWHM, (2) minor axis FWHM, (3) separation between the centers of the blue and red channel maps, and (4) spectral FWHM of the spatially integrated line. The inclination and PA of the disk are fixed input parameters, as described below. We assume that the line traces a rotating disk and model the observed properties by applying the IDL code DYSMAL (Dynamical Simulation and Modelling Algorithm, described in Davies et al. 2011). The main purpose of this code is to quantify the impact of spectral and spatial beam smearing on an axisymmetric rotating disk. In doing so it allows us to infer the intrinsic kinematics of the disk from the observed properties. On the other hand, we include NGC 7469 using data presented in Davies et al. (2004). While the HCN (1-0) observations for that object have not been modelled in this way, the 0.7″ resolution 1 mm CO (2-1) and 0.09″ resolution 2.12 m H2 1-0 S(1) data enabled those authors to derive a detailed mass distribution based on the combined dynamics at their different resolutions. This object therefore allows us to directly test whether our simple dynamical model based on a single Gaussian mass distribution can be considered a working approximation in the context of disk size scale, dynamical mass, and ability to distinguish between thin and thick geometries.
4.1 Kinematic Modelling Procedure
The kinematic modelling procedure we use is the same as described in Sani et al. (2012). However, in addition, we explore the impact of the initial conditions on the convergence of the minimisation routine to ensure that we have reached the global rather than local minimum. To do so we generate a set of random values within broad but restricted ranges for the disk size, disk thickness, and a mass scaling (, which is simply a way to set the amplitude of the rotation curve, and represents the mass supported by ordered circular orbits in the disk plane). We then run a minimisation starting from these values. At each iteration, it uses DYSMAL to simulate how a disk model with the given properties would appear when convolved with the spatial beam and spectral resolution of our data. The model is based on a Gaussian distribution, the FWHM of which is equal to the given disk size ( is half of this FWHM). The shape and amplitude of the rotation curve is derived from this in combination with the mass scaling . Finally, the vertical profile of the disk is defined by a Gaussian distribution, the FWHM of which is equal to the given disk thickness ( is half of this FWHM). The thickness has an observational impact both on the spatial distribution if the disk is inclined, and also on the velocity dispersion which we calculate as and assume is isotropic. The line of sight velocity distribution is derived for each point through the inclined disk model; and, after applying appropriate beam smearing, used to generate an output cube with 2 spatial axes and 1 velocity axis. The output data cube is analysed in the same way as the real data, extracting the four properties listed above and comparing them with those extracted from the observations. The minimisation routine iteratively converges on a set of disk parameters that lead to a best match of the observed properties. After repeating this process 100 times with different initial parameters, we obtain 100 sets of the best-fit model output parameters and their corresponding . We select the 50 sets with the lowest and use these to estimate the mean for each model parameter (note that we use the statistical mean rather than the set of parameters from any single minimisation), and list them in Table 4. In a final step, we input the mean values back into DYSMAL one more time and retrieve the simulated output ‘observable’ properties, which are also listed in Table 4. Together with these output parameters of the model, we list the input parameters (disk size, disk thickness, and scaling Mscale). To constrain the input parameter uncertainties, we estimate the input parameter distribution (either side of the best-fit values) that can satisfy the output observable properties within their uncertainties. This is similar in principle to the Markov chain Monte Carlo method, but simplified since we do not require to know the full probability distributions for the input parameters. We list the 1 uncertainties for input parameters in Table 4. We summarise the associated kinematics of the best-fit rotating disk at a radius in Table 5, together with the enclosed dynamical mass which we estimate as (as discussed in Davies et al. 2007 and Sani et al. 2012).
(1) Source name; (2) Molecule; (3) Note; (4) Disk FWHM size in the disk plane; (5) Disk FWHM thickness (height); (6) Scaling (which sets the amplitude of the rotation curve, and represents the mass supported by ordered circular orbits in the disk plane); (7)-(10) are measured with the same method as columns (4), (5), (7), and (9) of Table 3; (11) reduced of the fit.
| Source | Molecule | Note(a) | Mean value of best-fit | 4 simulated properties | |||||
|---|---|---|---|---|---|---|---|---|---|
| model parameters | from DYSMAL | ||||||||
| size | thickness | log(Mscale) | Maj. min. | b/r sep. | Line width | ||||
| (arcsec) | (arcsec) | (M☉) | axis (arcsec2) | (arcsec) | (km s-1) | ||||
| NGC 7469 | HCN | Complex | 2.41 | 0.43 | 9.95(b) | 3.15 2.69 | 1.22 | 242 | 6.3 |
| HCN | Simple | 2.56 | 0.62 | 9.42 | 3.27 2.84 | 1.15 | 235 | 4.5 | |
| NGC 6764 | HCN | - | 1.35 | 0.25 | 8.66 | 1.71 1.21 | 0.74 | 203 | 2.2 |
| HCO+ | - | 1.43 | 0.26 | 8.75 | 1.77 1.23 | 0.79 | 217 | 6.6 | |
| NGC 5033 | HCN | - | 1.70 | 0.01 | 8.47 | 1.94 1.17 | 0.98 | 182 | 0.7 |
| HCO+ | - | 1.54 | 0.19 | 8.37 | 1.85 1.18 | 0.88 | 190 | 0.1 | |
| NGC 3079 | HCN | - | 2.66 | 0.45 | 9.30 | 2.92 1.43 | 1.51 | 378 | 0.9 |
Note: the uncertainties given are derived as joint uncertainties and hence implicitly take into account possible partial correlations between parameters.
(a)For NGC 7469 ’complex’ refers to the multi-component dynamical model from Davies et al. (2004), ’simple’ to the single Gaussian representation for the mass distribution.
(b) Fixed to M⊙ as given by Davies et al. (2004).
(1) Source name; (2) Molecule; (3) Radius (half of the FWHM given in Table 4); (4) Rotational velocity at ; (5) Velocity dispersion at ; (6) Enclosed dynamical mass estimated as .
| Source | molecule | R | v | log(Mdyn) | |
|---|---|---|---|---|---|
| (pc) | (km s-1) | (km s-1) | (M☉) | ||
| NGC 7469 | HCN(a) | 356 | 131 | 47 | 9.30 |
| HCN(b) | 377 | 128 | 62 | 9.39 | |
| NGC 6764 | HCN | 101 | 102 | 38 | 8.54 |
| HCO+ | 108 | 110 | 40 | 8.63 | |
| NGC 5033 | HCN | 62 | 104 | 1.4 | 8.20 |
| HCO+ | 56 | 98 | 25 | 8.18 | |
| NGC 3079 | HCN | 112 | 204 | 69 | 9.16 |
(a)Complex model with multiple components; (b) Simple model with 1 component.
4.2 NGC 7469
Although the interferometric beam size at 3 mm is only ″, this is still relatively large compared to the scale of the nuclear structures. As a result, models are necessarily very simple and we have used a single Gaussian mass distribution to define the rotation curve and emission distribution. Since we are limited to using a very simple model, we use NGC 7469, which has been already successfully modeled with a complex mass distribution, to assess whether our approach is applicable. Davies et al. (2004) constructed a single axisymmetric mass model for NGC 7469 comprising a broad disk, a ring and an extended nucleus to interpret the observations of CO (2-1) and the K-band H2 1-0 S(1) line at different resolutions. The details of this mass model are summarized in their Table 2, and we adopt it for our analysis, calling it the ‘complex model’. While the mass distribution represented by these 3 components is fixed, we represent the HCN (1-0) line emission distribution by a single independent component (i.e. the kinematics of the line are defined by the fixed mass distribution, but the distribution of the line emission does not necessarily follow that of the mass). One additional assumption we make is that all the components share the same thickness. This is a free parameter in the model, as is the size scale of the luminosity distribution, while the mass scale (as before, this represents only the mass supported by ordered circular orbits in the disk plane) is fixed to M⊙ as derived by Davies et al. (2004). When applying our kinematics modelling procedure as described above, the best-fit values for the disk size and disk thickness are 2.41 and 0.43 respectively. And, as summarised in Table 5, accounting for rotation and dispersion, we estimate the dynamical mass to be . In comparison, when using a single Gaussian profile to define the mass distribution (hereafter called the ‘simple model’), we leave the disk size, disk thickness, and mass scale as three free parameters. We then derive best-fit mean values for disk size and thickness to be 2.56 and 0.62, and estimate . There are two key results here. The first is that the disk size and thickness are consistent between the two models, as is . The second is that the model implies the disk is thick, with an intrinsic . While the dispersion we derive of 50–60 km s -1 is larger than the 30 km s-1 seen directly in the higher spatial resolution CO (2-1) data by Davies et al. (2004), both would lead to the same conclusion in the context of distinguishing between a thick disk and a thin disk: that a significant intrinsic dispersion is required, and a thin disk is ruled out.
Thus we can estimate the intrinsic kinematics, and in particular the dispersion (thickening), for the disk using a simple approximation to the mass distribution. In the rest of this Section, we make use of the simple model to derive the intrinsic kinematics also for NGC 6764 and NGC 5033.
4.3 NGC 6764
When modelling NGC 6764, we assume that the nuclear disk and galactic disk have the same inclination, which we set to (Leon et al., 2007). And we note that the PA of the line emission, as well as its velocity gradient, are approximately perpendicular to the parsec-scale core-jet structure (PA , Kharb et al. 2010). We caution that, while the velocity gradient we see at radii up to 1″ is consistent with that of the CO (2-1) line up to radii of 5″ (Leon et al., 2007), our model focusses on the smaller scale and may not represent the properties of the rotating disk at 200 pc, which might be perturbed by streaming motions associated with the bar.
We perform the kinematics modelling separately on each of the two lines, which independently yield essentially the same solution: a disk with a size of and a thickness of . We conclude that the observational constraints require a thick disk model to explain the line emission distribution and kinematics, and in particular the large velocity width of the molecular lines. In our assumption of hydrostatic equilibrium, the disk thickness of the model corresponds to an intrinsic .
4.4 NGC 5033
For NGC 5033, based on the kinematical parameters derived from the CO (1-0) velocity field (Kohno et al., 2003), we fix the inclination to . We note also that the PA on those larger scales matches what we have measured on 1″ scales for the HCN (1-0) and HCO+ (1-0) lines, and is approximately perpendicular to the synchrotron radiation from the core-jet structure, which is oriented east-west (Pérez-Torres & Alberdi, 2007).
Our modelling results differ for the two lines. The characteristics of the HCN (1-0) line are well matched by a very thin disk with a size of . In contrast, the HCO+ (1-0) emission is better matched by a thicker disk with a size of and a thickness of . However, due to the low signal-to-noise of the HCO+ (1-0) line emission, the observable properties have large uncertainties and so the model is poorly constrained, as reflected in the very small for this fit. For this object there is no convincing evidence for a thick disk. We conclude that our kinematic analysis favours the thin disk solution, for which the corresponding intrinsic ratio is .
4.5 NGC 3079
Despite the absorption in the molecular emission lines, we still apply the kinematics modelling to HCN (1-0); however, we exclude HCO+ (1-0) since the effect of the absorption is too severe. According to the kinematical parameters derived from the CO (1-0) velocity field (Koda et al., 2002), we fix the nuclear disk inclination to and PA to . In addition, to reduce any bias caused by the impact of the absorption in setting the amplitude of the rotation curve, we also fix M⊙ (at 3″) based on the value derived by these authors from their kinematical modelling of the CO (2-1) line of their ‘core’ component, which we identify as the component traced by the HCN (1-0) and HCO+ (1-0) lines. The best-fit mean values for the disk size and thickness are and . The associated dispersion is just under 70 km s-1, consistent with the 60 km s-1 of Koda et al. (2002), and confirms that the dense clouds exhibit significant intrinsic random motions. The observed line emission distributions and kinematics need the thick disk geometrical structure, the corresponding intrinsic ratio is .
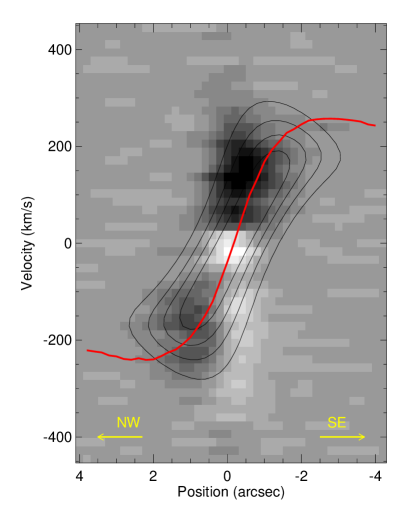
Since the emission lines are better spatially resolved in NGC 3079 than the other targets, we plot a position-velocity (PV) diagram in Figure 8 extracted along the major axis. The greyscale image shows that emission as darker colours and the absorption in lighter colours. Superimposed are contours tracing our axisymmetric dynamical model. Given the simplicity of this model, it traces the emission very well, although the line emission does shows deviations from axisymmetry (in particular, the south eastern side shows indications for red-shifted emission at km s-1 at a radial offset of ). We have used the iteration method (Takamiya & Sofue, 2002; Sofue & Rubin, 2001) to derive the central rotation curve from the beam-convolved model, and overplotted this on the figure. The model compares well with Figure 15 of Koda et al. (2002), where the spatial resolution was slightly poorer than ours, but which was not hampered by absorption.
(1) Source name; (2) HCN (1-0) Luminosity (3) Radius; (4) Rotational velocity at ; (5) Velocity dispersion at ; (6) Enclosed dynamical mass.
| Source | LHCN | R | v | Mdyn | |
|---|---|---|---|---|---|
| (pc) | (km s-1) | (km s-1) | (M⊙) | ||
| NGC 7469a | 7.87 | 356 | 131 | 47 | 9.30 |
| NGC 6764b | 6.90 | 101 | 102 | 38 | 8.54 |
| NGC 5033b | 6.36 | 62 | 104 | 1 | 8.20 |
| NGC 3079 | 7.49 | 112 | 204 | 69 | 9.16 |
| NGC 2273 | 6.86 | 97 | 83 | 33 | 8.36 |
| NGC 3227 | 6.52 | 23 | 105 | 42 | 7.98 |
| NGC 4051 | 5.88 | 22 | 47 | 19 | 7.23 |
| NGC 6951 | 6.36 | 45 | 84 | 34 | 8.04 |
(a)From the complex model.
(b)We have adopted the model based on the HCN (1-0) line: for NGC 6764 it provides a better fit; for NGC 5033 it provides a better constrained fit.
4.6 Kinematics Summary
For three of the four galaxies we have modelled, the nuclear emission line characteristics require a thick disk with . The validity of our results is demonstrated for 2 objects. For NGC 7469, matching the kinematics of higher resolution CO (2-1) and H2 1-0 S(1) data to a detailed mass model, Davies et al. (2004) noted that the dispersion of the CO (2-1) line had to be a relatively high 30 km s-1. For NGC 3079, focussing on the ‘core’ component seen in CO (2-1) data, Koda et al. (2002) required a dispersion of 60 km s-1 to model the kinematics.
Sani et al. (2012) performed a similar kinematic analysis of the HCN (1-0) line for four other nearby Seyfert galaxies, finding in the range 0.3–0.5 for all of them. We combine these with our kinematic analysis above and summarize the combined modelling results in Table 6. We find that in 7 out of 8 nearby Seyferts, . Only for NGC 5033 do we find evidence that the disk is thin, with . We conclude that thick molecular disks are a common occurrence in the central pc of Seyfert galaxies.
5 Column density through the inner disk of NGC 3079
In this section, we use the depth of the absorption features in the spectrum of NGC 3079 to make a direct estimate of the gas column density of the disk, and discuss the origin of the absorption features.
We already noted in Section 3.1 that the H12CN (1-0) absorption is saturated, making it difficult to use reliably to derive column density. Instead, the H13CN (1-0) is an ideal transition for this purpose, not only because it is unsaturated but also because its frequency is far enough away from other transitions that it is unblended. The spectral profile of the absorption from this line is shown in panel (c) of Figure 3, and the systemic velocity, for which we have adopted 1147 km s-1 (Koda et al., 2002), is drawn as a dashed red line. The solid blue line represents the continuum flux density within the 3 aperture. The deeper absorption (the component close to the systemic velocity) is denoted “C1”; the broader absorption component (further blue-shifted from the systemic velocity) is denoted as “C2”.
5.1 Column Densities
Assuming that local thermal equilibrium (LTE) conditions hold, the velocity integrated optical depth can be used to derive the total column density of molecules (Wiklind & Combes, 1995). For an absorption line J J + 1:
| (1) |
where is the Einstein A coefficient, = 2J + 1 is the statistical weighting of level J, is the energy of level J, = is the partition function, and is the velocity integrated optical depth. In order to calculate this, we have used coefficients from the Leiden Atomic and Molecular Database (Schöier et al., 2005), for which the energy levels and radiation transitions extend up to J = 29. The excitation temperature, , is set as 4 K which is consistent with a high opacity of the lower transitions and, as concluded for NGC 5128 by Muller & Dinh-V-Trung (2009), is expected for densities up to cm-3. We estimate the optical depth over the source as:
| (2) |
where is the observed flux density of the absorption feature and is the continuum flux density transmitted by the background non-thermal radio sources.
The velocity integrated optical depths of C1 and C2 are 46.13 km s-1 and 80.88 km s-1, from which we estimate associated column densities for H13CN of cm-2 and cm-2 respectively. In order to derive the hydrogen column density , we need to apply two corrections. The first one is for the 12C/13C isotope ratio, which we assume to be 60, similar to the local interstellar medium (Milam et al., 2005). However, we note that this conversion may be underestimated if the circumnuclear region has a high star formation rate, for example M 82 and NGC 253 have 12C/13C 100 (Martín et al., 2010). The second correction is for the H12CN abundance . (Harada et al., 2010) have calculated values in the range to for gas on scales of a few to tens of parsecs around an AGN, depending on timescale. These values are for warm (–400 K) gas, similar to the molecular gas temperatures found in the central regions of Seyfert galaxies (Davies et al., 2012; Hailey-Dunsheath et al., 2012; Krips et al., 2008; Viti et al., 2014). In the absence of specific constraints, we adopt the geometrical mean of these two values, , which is consistent with the plentiful evidence for X-ray enhanced HCN abundance around AGN. Consequently, for the C1 and C2 components is cm-2 and cm-2 respectively.
Support for the high column density in the central disk of NGC 3079 comes from the SiO absorption. Numerous observations have shown that SiO is commonly found in massive star forming regions and in shocked clumps related to supernova remnants (e.g. Downes et al. 1982 and Ziurys et al. 1989a). And enhancement of the SiO abundance has been predicted in high temperature chemistry reactions and models which contain shocks or molecular formation in fast molecular outflows (Martin-Pintado et al., 1992; Klaassen & Wilson, 2007).
We estimate SiO column densities for components C1 and C2 in NGC 3079 as cm-2 and cm-2 respectively. For both components the ratio of SiO abundance to HCN is in the range 0.02–0.03. These ratios are significantly higher than found in dark clouds or quiescent regions (where ratios are expected), but also significantly less than the range 0.1–1 found in massive star forming regions. They are more comparable to the perturbed clouds associated with supernova remnant IC 443 where –0.06 (Ziurys et al., 1989b), and also to the circumnuclear disk of NGC 1068 where –0.1 (Usero et al., 2004). Adopting as found by Usero et al. (2004) for NGC 1068, we estimate column densities of 0.3– cm-2 for C1 and C2 in NGC 3079.
We note that comparison with derived from X-ray spectra towards the AGN is difficult. An estimate based on a BeppoSAX observation was cm-2 (Iyomoto et al., 2001), while another based on Chandra observations was cm-2 (Cecil et al., 2002). On the other hand, both X-ray observatories did strongly detect the Fe K complex at 6.4 keV, which is a fluorescence line produced when nuclear continuum radiation is reprocessed by circumnuclear material, and is consistent with heavy absorption.
5.2 Origin of the absorption
The central velocities of C1 and C2 are 29 km s-1 and 137 km s-1 respectively. This double peaked absorption not only appears in several molecules (e.g. H13CN, H13CO+, SiO and HN13C) in the spectrum in Figure 3, but is also present in the OH absorption observed on milli-arcsec scales with the European VLBI Network (EVN) (Hagiwara et al., 2004). Although different observations use distinct molecules, the velocity difference between the two absorption features has a consistent value of km s-1.
5.2.1 Component C1
Owing to the alignment of the water maser distribution with the kiloparsec-scale CO molecular structure, Trotter et al. (1998) proposed a highly inclined molecular disk, oriented roughly north-south, as the geometry of the nuclear region in NGC 3079. In addition, Kondratko et al. (2005) measured the water maser kinematics and concluded the presence of a relatively thick and flared disk structure in the centre. We adopt these ideas from the literature and suggest that the deeper absorption C1 originates from the blue-shifted part of the rotating molecular disk, which lies in front of the bright radio jet continuum source B, which we discussed in Section 3.1 as also being one of the primary sources of the 3 mm continuum. Adopting a black hole mass M⊙ (Kondratko et al., 2005), and taking into account the inclination of the rotating disk and the location at which the absorption is occurring, we estimate that the velocity associated with the disk absorption should be km s-1, in good agreement with the observed velocity of component C1. In contrast, the red-shifted part of the rotating molecular disk is located behind the other prominent radio jet continuum source, A; and therefore no equivalent redshifted absorption occurs in the spectrum. This scenario of off-centre absorption in the nuclear region of NGC 3079 is illustrated in the right panel of Figure 9. Based on this scheme, we argue that C1 may trace the intrinsic column density of neutral hydrogen in the edge-on rotating molecular disk, which we conclude is therefore N cm-2.
Despite the size of our 3 mm beam, this column is measured at radial scales of pc because that is the projected location of the continuum against which the absorption is occurring. If it applies throughout the nuclear disk, we can estimate a gas mass that we can compare with the dynamical mass from Section 4, and hence estimate a gas fraction. Assuming that the absorption is caused by only 1–2 clouds along the line of sight so that no inclination correction is required, the gas mass within a radius of 112 pc (the same as that used to derive ) is M⊙. For (Table 5), we find a gas fraction %.
These numbers are remarkably similar to the estimates of Hicks et al. (2009). Based on direct CO measurements as well as typical gas fractions for local spirals and star formation galaxies, these authors who argued that even with a low gas fraction of 1% the columns exceed cm-2 on scales out to several tens of parsecs, and values are more typically a few cm-2. Their estimates based on extinction to the stellar continuum (assuming the obscuring material is mixed with the stars) suggested slightly lower values with a mean of cm-2. Our independent measurement based on absorption confirms that in NGC 3079, although the gas fraction in the nucleus is low, there is still sufficient material on scales of at least several parsecs to cause significant optical obscuration from some directions.
5.2.2 Component C2
Absorption component C2 has a broad wing that extends to at least 200 km s-1 blueward from the central velocity of C2. Component C2 could be associated with OH absorption (Hagiwara et al., 2004). But in contrast to the extended HCN velocity profile, the OH absorption observed with 45-mas resolution ( pc) shows only the deep absorption of C2 without the broad blue-shifted wing. We suggest below that the broad wing could be caused by absorption in outflowing material. The H features resembling outflow in the nuclear region of NGC 3079 are displayed in the left panel of Figure 9. The brightest emission shows that the bubble apex is close to the nucleus, and shocks induced in the bubble wall extend out to large-scales tracing the extent of the super wind (Veilleux et al., 1994). An ionized filament with a blue-shifted velocity of 125 km s-1 relative to systemic lies at a distance of pc (4–5″) from the nucleus, and its morphology aligns with the VLBI-scale radio jet (Cecil et al., 2001). We speculate that the broad blue-shifted wing – and hence the whole of component C2 – may trace outflows on projected scales larger than 4 pc but smaller than pc (noting that this corresponds to half the 1″ FWHM of the IRAM beam). This would imply a column density in the outflowing material of cm-2, comparable with that of the material in the disk. While this seems remarkably high, outflowing material with a similar high cm-2 has been reported for the Seyfert 2 galaxy NGC 1433 (Combes et al., 2013).
.
6 HCN luminosity and Dynamical mass
In this section we explore the relation between HCN luminosity and dynamical mass in the central pc of Seyfert galaxies, and its implications. We use the combined sample of 8 Seyferts with 1″ HCN (1-0) observations and kinematical modelling, as given in Table 6.
Following Gao et al. (2007), the HCN luminosity is calculated as
| (3) |
in units of K km s-1 pc2, where S (Jy km s-1) is the velocity integrated HCN flux density and DL (Mpc) is the luminosity distance. Since all our objects are in the very local universe, the term is approximately unity. The uncertainty in HCN luminosity includes uncertainties from the velocity integrated flux density as well as the distance.
The uncertainties on are difficult to quantify robustly because of the assumptions and simplifications in the kinematic model from which is derived. For the galaxies they modelled, Sani et al. (2012) state that the random errors are 15–20% excluding the uncertainty for the term. From our modelling, which provides a more statistical estimate of the uncertainties based on the distribution of parameters in the best-fitting models, the uncertainties are 30–40%. However, we (and also Sani et al. 2012) adopted fixed inclinations and did not take their uncertainties into account. The inclinations we have used for each galaxy are given in the relevant subsections of Sec. 4, and we note that in all of the objects we have modelled as well as all of those modelled by Sani et al. (2012) the PA of the nuclear HCN emission matches rather well the PA of the host galaxy on larger scales. Since a warp is likely to alter the PA (as well as the inclination), the similarity of the PA on large and small scales suggests the impact of any warp on the observed orientation should be modest. We therefore have simply adopted the same inclinations as measured on large scales, noting that for NGC 7469, Davies et al. (2004) report that a change in inclination changes the dynamical mass by 17%. An effect of this size does not increase our uncertainties significantly, and so we adopt a global uncertainty of 40% on all the dynamical mass estimates.
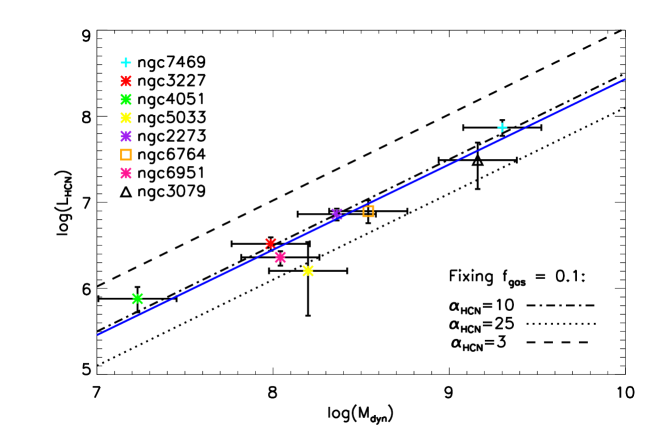
We have plotted against in Figure 10, which shows that the relation between them is essentially linear. The bivariate regression fit (solid blue line on the figure) is given as:
| (4) |
We find that Spearman’s rank correlation coefficient with 98% significance (noting that corresponds to two variables being monotonically related). Since we do not know the intrinsic for NGC 3079, we adopt the from the absorption corrected flat-topped profile. Its large uncertainty is due to the difference in flux between the observed line and the absorption corrected profile. We also looked at the surface densities for the mass and luminosity, where both axes in Figure 10 are divided by the best-fit model disk area. A significant correlation still exists, indicating that disk size may not influence the relation between and . We discuss below the implication of the mass luminosity relation in terms of the gas fraction and the conversion factor between HCN luminosity and gas mass.
For either a single virialised (gravitationally bound) cloud, or a non-overlapping ensemble of such clouds, the ratio between the gas mass Mgas and the HCN luminosity LHCN (in units of K km s-1 pc2) can be written as (Solomon et al., 1990; Downes et al., 1993; Krips et al., 2008):
| (5) |
where (cm-3) is the average H2 number density and Tb (K) is the brightness temperature.
However, as discussed by Downes et al. (1993) and Solomon & Vanden Bout (2005), when the line width traces the potential of a galaxy, i.e. , one has to modify Equation 5 to account for the mass contributed by stars in addition to the gas. As we have shown in Section 4, this is the case for our observations of the HCN (1-0) lines; and in Section 7 we show that in at least one galaxy the clouds are not self-gravitating. In addition, we also note that since the HCN (1-0) transition has a critical density of cm-3 (e.g. Meijerink et al. 2007), the emission traces preferentially dense gas, whereas there may also be a significant mass of gas in less dense clumps, which might instead be traced by CO (1-0) which has a much lower critical density. Following the argument given in Downes et al. (1993), the relation between dynamical mass and HCN luminosity can be expressed as:
| (6) |
where is an equivalent H2 number density. Then, since , Equation 6 can be rewritten as:
| (7) |
That there is a relation between and which is close to linear, as is apparent in Figure 10, implies either that there is an intrinsic relation between and or that there are typical values (to within a factor of 2 or so) for both of these quantities.
Based on a variety of sources and methods, Hicks et al. (2009) argued that the typical gas mass fraction lies in the range 4–25%, with a typical value of , within the central 200 pc of Seyferts. We adopt this value and, based on Equation 7, draw in Figure 10 the lines corresponding to (long dash line), 10 (dot-dash line), and 25 (dotted line). We find that M⊙ (K km s-1 pc2)-1 provides a remarkably good approximation to the data. A similar HCN conversion factor = 10 for nearby AGN (albeit with beam sizes ranging from a few arcsec up to 20″) was found via LVG analysis by Krips et al. (2008). As they noted, it is times smaller than the estimated by Gao & Solomon (2004) for nearby spiral, infrared-luminous, and ultraluminous galaxies. However, Figure 10 rules out such a high conversion factor for the centers of AGN since it would imply a gas fraction exceeding 50%. The difference may point towards differing excitation conditions and molecular abundances in the environments, and there is plentiful theoretical and observational evidence that X-ray excitation of gas by the AGN does have a major impact on both of these leading to an increase in the HCN luminosity (Lepp & Dalgarno, 1996; Maloney et al., 1996; Boger & Sternberg, 2005; Meijerink & Spaans, 2005; Meijerink et al., 2007; Kohno et al., 2003; Usero et al., 2004; Krips et al., 2007, 2008; Davies et al., 2012).
7 Non self-gravitating clouds in NGC 6951
In their high spatial resolution analyses of the Br hydrogen recombination line in Seyferts, Davies et al. (2007) and Hicks et al. (2013) were able to show that there was no on-going star formation in the central pc. And as part of their analysis of the HCN line kinematics, Sani et al. (2012) found that while there was often star formation occurring in circumnuclear rings at radii 100 pc, on smaller scales the evidence indicates that the star formation rates were much lower. Our aim in this section is to assess whether the clouds in the central region are self-gravitating. If they are not, this could be one reason why star formation appears to be suppressed on these scales.
We focus on NGC 6951 which is one of the Seyfert galaxies in the combined sample summarised in Table 6, and for which suitable data are available. Observations reported by Krips et al. (2007) provide the HCN (1-0)/CO (2-1) ratio, which is 2.5 (if units for line fluxes are K km s-1; it is 0.37 if the line flux units are Jy km s-1) as discussed by Davies et al. (2012). These data have similar small beams and so are spatially resolved, which is important since the distributions of the two lines are very different. Here we use the line ratio corresponding to the central component only. In addition, Krips et al. (2008) reported the HCN (3-2)/HCN (1-0) line ratio as 0.4 corrected for beam filling factors. Although the beam for these data is larger (and specifically, the HCN (1-0) measurement used for this line ratio is a single dish measurement rather than the interferometric measurement used for the other line ratio), it is less critical since both lines are from HCN and so are expected to have more similar distributions. Since the beam includes the circumnuclear ring, there is some uncertainty associated with whether the line ratio reflects that in the nucleus. However, a similar measurement by Krips et al. (2008) on NGC 1068 with a smaller beam that probes only regions well within the circumnuclear ring, yielded a HCN (3-2)/HCN (1-0) ratio of 0.21 (as such, given the HCN (1-0)/CO (2-1) ratio from Usero et al. (2004) discussed by Davies et al. 2012, the analysis below could equally apply to NGC 1068); and a ratio of 0.15 has been reported for the nucleus of NGC 1097 by Hsieh et al. (2012). While these two galaxies could also be used for this analysis, we have not included them here. This is partly because they are not part of our combined sample. For NGC 1068 it is also because the nuclear region of NGC 1068 is very complex, having a circumnuclear bar feeding gas in to the nucleus while an outflow from the AGN disrupts the disk (Müller-Sánchez et al. 2009; Krips et al. 2011; Garciá-Burillo et al. 2014). For NGC 1097, it is also because the AGN is very weak and cannot really be classified as a Seyfert. As can be seen in Figure 11 even a large uncertainty in the HCN (3-2)/HCN (1-0) ratio does not alter the general conclusion that the clouds cannot be self-gravitating.
In order to derive the physical conditions under which these line ratios can arise, we make use of the Large Velocity Gradient (LVG) approximation (Sobolev, 1957), which has been widely used in the literature to study gas conditions and excitiation in normal and active galaxies. It is important to realise that LVG calculations apply to individual clouds. On the other hand, the observations we use are of an ensemble of clouds. However, under the usual assumption that all the clouds in the ensemble are the same, the line ratios will not depend on the number of clouds: they will be the same for a single cloud and for the ensemble. We note, however, that this is not the case for the line width, which is very different for a single cloud and for the ensemble. As such, to interpret the modelled ratio , or equivalently , in the context of the observations would require additional assumptions that one sees all the clouds and that their individual line profiles and relative velocities combine to match the observed line profile. However, our results are not affected by this issue because our comparison of the LVG calculations to observations is based solely on line ratios.
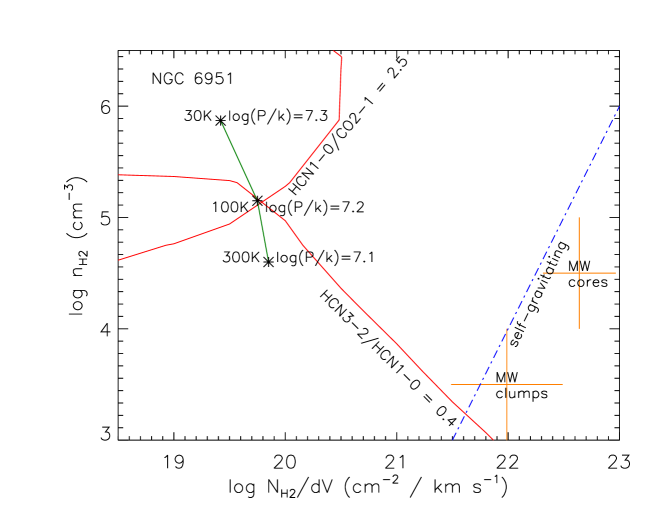
We use the LVG calculations performed by Davies et al. (2012) (we refer to that paper for details of the code and comparison to the commonly used RADEX) and extended them to include the HCN (3-2)/HCN (1-0) line ratio. The calculations cover a wide range of parameters: kinetic temperature , HCN to CO abundance ratio (with as the CO abundance relative to hydrogen), H2 volume gas density , and a ratio of gas-density to velocity-gradient, or equivalently column density to linewidth, of . One plane of this parameter space is shown in Figure 11.
For reference, we show the boundary (dot-dash blue line), to the right of which clouds are self-gravitating (see Goldsmith 2001 and Davies et al. 2012). For virialised clouds where is the velocity dispersion, is the cloud radius, and is the gas volume density. The self-gravitating boundary line is found by treating as a velocity gradient, which gives as shown.
We have also marked the regions where one expects to find Galactic clumps and cores, using the typical properties summarised by Bergin & Tafalla (2007) and estimating from their density, size, and velocity width. Galactic clouds, with densities of –500 cm-3, are outside the range of the plot. Their sizes of 2–15 pc and velocity widths of 2–5 km s-1 indicate they have and so lie just left of the extension of the self-gravitating line.
We now discuss how, although the LVG calculation formally has 5 free parameters, we can reach a robust conclusion with only 2 line ratios. The first parameter is the CO abundance , but because this hardly varies for a wide variety of conditions we fix it at . The HCN abundance is also a parameter. But it was already shown by Davies et al. (2012) that the HCN (1-0)/CO (2-1) ratio alone requires an unusually high HCN abundance, . Since this is already much higher than the typical abundance, although still consistent with what one might expect theoretically from calculations of equilibrium abundances in X-ray irradiated gas (Boger & Sternberg, 2005), we fix it at . The volume density and ratio of column density to linewidth are the axes of the plot and therefore left as free parameters. Finally, the temperature is unconstrained. We have therefore plotted red curves tracing the locus of the line ratios above for NGC 6951 assuming a temperature of 100 K; and show in addition the location where the two curves intersect for temperatures of 30 K and 300 K (asterisks joined by the green curve), a range that covers the temperatures one might expect to find in the central regions of Seyferts (Krips et al., 2008). This shows the well known degeneracy between temperature and density, but also indicates that, unless the temperature of the molecular gas significantly exceeds 300 K, the gas density must be .
One very clear conclusion from the figure is that, independent of temperature and density, the locus of intersections for the line ratios lies far to the left of the region where one finds self-gravitating clouds. Indeed, for the range of temperatures we have considered, the inferred pressure is roughly constant at cm-3 K suggesting that the clouds are likely to be pressure confined. A similar conclusion was reached by Zaragoza-Cardiel et al. (2014) for H II regions and giant molecular clouds in the interacting Antennae galaxy system: self-gravity only bound clouds above a certain mass threshold, and below this they must be bound by external pressure. Intriguingly the pressure we find is comparable to that found by Heckman et al. (1990) in the central few hundred parsecs of galaxies with starburst driven superwinds. As such, the line ratios observed in the centre of NGC 6951 are consistent with an environment dominated by supernovae, perhaps indicative of a young post-starbust.
8 Conclusion
We have presented 3 mm interferometer data from the IRAM PdBI, which spatially resolves the HCN (1-0) and HCO+ (1-0) molecular lines in the central few arcsecs of three nearby Seyfert galaxies: NGC 3079, NGC 6764, and NGC 5033. The main results of this study are as follows:
-
1.
For these galaxies, and also NGC 7469, we use a rotating disk model that takes into account beam smearing, to successfully match the observed line distribution and kinematics. The characteristics of NGC 5033 can be fitted by a thin disk having . In contrast NGC 7469, NGC 3079, and NGC 6764 all favour a thick disk with . Combining these results with the earlier study of Sani et al. (2012), we find that in 7 out of 8 Seyferts, the HCN (1-0) line traces thick rather than thin disks in the central pc.
-
2.
The spectrum of NGC 3079 is dominated by numerous absorption lines, which are characterised by a double peak profile. The component closest to systemic is caused by absorption in the approaching side of the inner disk, which lies in front of a radio continuum knot in the north-west jet. Based on the depth of the H13CN (1-0) feature (since H12CN (1-0) is both saturated and blended with emission), we estimate the hydrogen column density in the disk to be cm-2. The other absorption component, with a broad blue-shifted wing extending to km s-1, suggests the existence of a dense nuclear outflow. Correcting the HCN (1-0) and HCO+ (1-0) lines for continuum absorption indicates that the emission lines are also partially self-absorbed.
-
3.
We find a relation between HCN luminosity and dynamical mass. This implies either a relation between, or typical values for, the gas fraction and the conversion factor between HCN luminosity and gas mass. A gas fraction of and (consistent with the conclusion of Krips et al. 2008 from LVG calculations) can account for the observed relation.
-
4.
An analysis of the HCN (1-0)/CO (2-1) and HCN (3-2)/HCN (1-0) line ratios in NGC 6951 indicates that the molecular gas is not in self-gravitating clouds. Instead, the clouds are likely to be pressure confined. The implied pressure of cm-3 K is comparable to that measured in the centers of superwinds, suggesting that the interstellar medium in the centre of NGC 6951 is consistent with an environment dominated by supernova.
Acknowledgements
We thank the referee for providing a variety of important comments that have helped to improve the manuscript. MY would like to thank Nadia Murillo for useful discussions. RD thanks Katie Dodds-Eden for her initial work on this paper, particularly in the context of Section 5. Based on observations carried out under project number U08A with the IRAM PdBI. IRAM is supported by INSU/CNRS (France), MPG (Germany) and IGN (Spain). This research has made use of the NASA/IPAC Extragalactic Database (NED) which is operated by the Jet Propulsion Laboratory, California Institute of Technology, under contract with the National Aeronautics and Space Administration.
References
- Aalto et al. (2015) Aalto S., Martín S., Costagliola F., González-Alfonso E., Muller S., et al., 2015, A&A, 584, A42
- Antonucci (1993) Antonucci, R., 1993, ARAA, 31, 473
- Bergin & Tafalla (2007) Bergin E., Tafalla M., 2007, ARA&A, 45, 339
- Boger & Sternberg (2005) Boger G., Sternberg A., 2005, ApJ, 632, 302
- Braine et al. (1997) Braine J., Guélin M., Dumke M., Brouillet N., Herpin F., Wielebinski R., 1997, A&A, 326, 963
- Burtscher et al. (2015) Burtscher L., Orban de Xivry G., Davies R., Janssen A., Lutz D., et al., 2015, A&A, 578, 47
- Cecil et al. (2001) Cecil, G., Bland-Hawthorn, J., Veilleux, S., & Filippenko, A. V., 2001, ApJ, 555, 338
- Cecil et al. (2002) Cecil, G., Bland-Hawthorn, J., & Veilleux, S., 2002, ApJ, 576, 745
- Cid Fernandes et al. (2004) Cid Fernandes R., González Delgardo R., Schmitt H., Storchi-Bergmann T., Martins L., et al., 2004, ApJ, 605, 105
- Combes et al. (2013) Combes, F., García-Burillo, S., Casasola, V., et al., 2013, A&A, 558, A124
- Costagliola et al. (2011) Costagliola, F., Aalto, S., Rodriguez, M. I., et al., 2011, A&A, 528, A30
- Davies et al. (2004) Davies, R. I., Tacconi, L. J., & Genzel, R., 2004, ApJ, 602, 148
- Davies et al. (2006) Davies, R. I., Thomas, J., Genzel, R., et al., 2006, ApJ, 646, 754
- Davies et al. (2007) Davies, R. I., Müller Sánchez, F., Genzel, R., et al. 2007, ApJ, 671, 1388
- Davies et al. (2011) Davies, R., Förster Schreiber, N. M., Cresci, G., et al., 2011, ApJ, 741, 69
- Davies et al. (2012) Davies, R., Mark, D., & Sternberg, A., 2012, A&A, 537, A133
- Downes et al. (1982) Downes, D., Genzel, R., Hjalmarson, A., Nyman, L. A., & Ronnang, B., 1982, ApJL, 252, L29
- Downes et al. (1993) Downes, D., Solomon, P. M., & Radford, S. J. E., 1993, ApJL, 414, L13
- Elitzur & Shlosman (2006) Elitzur, M., & Shlosman, I., 2006, ApJL, 648, L101
- Engel et al. (2011) Engel H., Davies R., Genzel R., Taccconi L., Sturm E., Downes D., 2011, ApJ, 729, 58
- Esquej et al. (2014) Esquej P., Alonso-Herrero A., González-Martín O., Hönig S., Hernán-Caballero A., et al., 2014, ApJ, 780, 86
- Feltre et al. (2012) Feltre, A., Hatziminaoglou, E., Fritz, J., & Franceschini, A., 2012, MNRAS, 426, 120
- Fritz et al. (2006) Fritz J., Franceschini A., Hatziminaoglou E., 2006, MNRAS, 366, 767
- Gao et al. (2007) Gao, Y., Carilli, C. L., Solomon, P. M., & Vanden Bout, P. A., 2007, ApJL, 660, L93
- Gao & Solomon (2004) Gao, Y., & Solomon, P. M., 2004, ApJS, 152, 63
- Garciá-Burillo et al. (2014) Garciá-Burillo S., Combes F., Usero A., Aalto S., Krips M., et al., 2014, A&A, 567, A125
- Goldsmith (2001) Goldsmith P., 2001, ApJ, 557, 736
- Gottlieb et al. (1983) Gottlieb C., Gottlieb E., Thaddeus P., 1983, ApJ, 264, 740
- Granato & Danese (1994) Granato, G. L., & Danese, L., 1994, MNRAS, 268, 235
- Granato et al. (1997) Granato, G. L., Danese, L., & Franceschini, A., 1997, ApJ, 486, 147
- Hagiwara et al. (2004) Hagiwara, Y., Klöckner, H.-R., & Baan, W., 2004, MNRAS, 353, 1055
- Hailey-Dunsheath et al. (2012) Hailey-Dunsheath S., Sturm E., Fischer J., Sternberg A., Graciá-Carpio J., et al., 2012, ApJ, 755, 57
- Harada et al. (2010) Harada, N., Herbst, E., & Wakelam, V., 2010, ApJ, 721, 1570
- Hawarden et al. (1995) Hawarden T., Israel F., Geballe T., Wade R., 1995, MNRAS, 276, 1197
- Heckman et al. (1990) Heckman T., Armus L., Miley G., 1990, ApJSS, 74, 833
- Hicks et al. (2009) Hicks, E. K. S., Davies, R. I., Malkan, M. A., et al., 2009, ApJ, 696, 448
- Hicks et al. (2013) Hicks, E. K. S., Davies, R. I., Maciejewski W., Emsellem E., Malkan M., et al. 2013, ApJ, 768, 107
- Hönig et al. (2006) Hoenig S., Beckert T., Ohnaka K., Weigelt G., 2006, A&A, 452,459
- Hopkins et al. (2012) Hopkins, P. F., Hayward, C. C., Narayanan, D., & Hernquist, L., 2012, MNRAS, 420, 320
- Hota & Saikia (2006) Hota A., Saikia D., 2006, MNRAS, 371, 945
- Hsieh et al. (2012) Hsieh P.-Y., Ho P., Kohno K., Hwang C.-Y., Matsushita S., 2012, ApJ, 747, 90
- Huchra et al. (1995) Huchra J., Geller M., Corwin H., 1995 ApJSS, 99, 391
- Iyomoto et al. (2001) Iyomoto, N., Fukazawa, Y., Nakai, N., & Ishihara, Y., 2001, ApJL, 561, L69
- Kharb et al. (2010) Kharb, P., Hota, A., Croston, J. H., et al., 2010, ApJ, 723, 580
- Klaas & Walker (2002) Klaas U., Walker H., 2002, A&A, 391, 911
- Klaassen & Wilson (2007) Klaassen, P. D., & Wilson, C. D., 2007, ApJ, 663, 1092
- Koda et al. (2002) Koda, J., Sofue, Y., Kohno, K., et al., 2002, ApJ, 573, 105
- Kohno et al. (2003) Kohno, K., Vila-Vilaró, B., Sakamoto, S., et al., 2003, PASJ, 55, 103
- Kohno (2005) Kohno K., 2005, in The Evolution of Starbursts: The 331st Wilhelm and Else Heraeus Seminar, AIP Conf. Proc. vol. 783, pp. 203–208
- Kohno et al. (2008) Kohno, K., Nakanishi, K., Tosaki, T., et al., 2008, Ap&SS, 313, 279
- Kondratko et al. (2005) Kondratko, P. T., Greenhill, L. J., & Moran, J. M., 2005, ApJ, 618, 618
- Krips et al. (2007) Krips, M., Neri, R., Garcá-Burillo, S., et al., 2007, A&A, 468, L63
- Krips et al. (2008) Krips, M., Neri, R., García-Burillo, S., et al., 2008, ApJ, 677, 262
- Krips et al. (2011) Krips, M., Martín S., Eckart A., Neri R., Garciá-Burillo S., et al., 2011, ApJ, 736, 37
- Krolik & Begelman (1988) Krolik, J. H., & Begelman, M. C., 1988, ApJ, 329, 702
- Kukula et al. (1995) Kukula M., Pedlar A., Baum S., O’Dea C., 1995, MNRAS, 276, 1262
- Leon et al. (2007) Leon, S., Eckart, A., Laine, S., et al., 2007, A&A, 473, 747
- Lepp & Dalgarno (1996) Lepp, S., & Dalgarno, A., 1996, A&A, 306, L21
- Maloney et al. (1996) Maloney P., Hollenbach D., Tielens A., 1996, ApJ, 466, 561
- Martín et al. (2010) Martín, S., Aladro, R., Martín-Pintado, J., & Mauersberger, R., 2010, A&A, 522, A62
- Martin-Pintado et al. (1992) Martin-Pintado, J., Bachiller, R., & Fuente, A., 1992, A&A, 254, 315
- Meijerink & Spaans (2005) Meijerink, R., & Spaans, M., 2005, A&A, 436, 397
- Meijerink et al. (2007) Meijerink, R., Spaans, M., & Israel, F. P., 2007, A&A, 461, 793
- Middelberg et al. (2007) Middelberg E., Agudo I., Roy A., Krichbaum T., 2007, MNRAS, 377, 731
- Milam et al. (2005) Milam, S. N., Savage, C., Brewster, M. A., Ziurys, L. M., & Wyckoff, S., 2005, ApJ, 634, 1126
- Morganti et al. (2007) Morganti R., Holt J., Saripalli L., Oosterloo T., Tadhunter Cl., 2007, A&A, 476, 735
- Morganti (2012) Morganti R., 2012 in Nuclei of Seyfert galaxies and QSOs – Central engine & conditions of star formation, Proceedings of Science, pub. Max-Planck-Insitut für Radioastronomie (MPIfR), Bonn, Germany; online at http://pos.sissa.it/cgi-bin/reader/conf.cgi?confid=169
- Morganti et al. (2015) Morganti R., Oosterloo T., Oonk J., Frieswijk W., Tadhunter Cl., 2015, A&A, 580, 1
- Muller & Dinh-V-Trung (2009) Muller S., Dinh-V-Trung, 2009, ApJ, 696, 176
- Müller-Sánchez et al. (2009) Müller-Sánchez, F., Davies R., Genzel R., Tacconi L., Eisenhauer F., Hicks E., Friedrich S., Sternberg A., 2009, ApJ, 691, 749
- Müller-Sánchez et al. (2013) Müller-Sánchez, F., Prieto, M. A., Mezcua, M., et al., 2013, ApJL, 763, L1
- Nenkova et al. (2002) Nenkova, M., Ivezić, Ž., & Elitzur, M., 2002, ApJL, 570, L9
- Netzer (2015) Netzer H., 2015, ARA&A, 53, 365
- Papadopoulos (2007) Papadopoulos, P. P., 2007, ApJ, 656, 792
- Pérez-Torres & Alberdi (2007) Pérez-Torres, M. A., & Alberdi, A., 2007, MNRAS, 379, 275
- Pier & Krolik (1992) Pier E., Krolik J., 1992, ApJ, 401, 99
- Rangwala et al. (2015) Rangwala N., Maloney P., Wilson C., Glenn J., Kamenetzky J., Spinoglio L., 2015, ApJ, 806, 17
- Riffel et al. (2009) Riffel R., Postoriza M., Rodríguez-Ardila A., Bonatto C., 2009 MNRAS, 400, 273
- Sakamoto et al. (2009) Sakamoto K., Aalto S., Wilner D., Black J., Conway J., et al., 2009, ApJ, 700, L104
- Sani et al. (2012) Sani, E., Davies, R. I., Sternberg, A., et al. 2012, MNRAS, 424, 1963
- Schartmann et al. (2005) Schartmann M., Meisenheimer K., Camenzind M., Wolf S., Henning T., 2005, A&A, 437, 861
- Schartmann et al. (2008) Schartmann M., Meisenheimer K., Camenzind M., Wolf S., Tristram K., Henning T., 2008, A&A, 482, 67
- Schartmann et al. (2014) Schartmann M., Wada K., Prieto M.A., Burkert A., Tristram K., 2014, MNRAS, 445, 3878
- Schweitzer et al. (2008) Schweitzer, M., Groves, B., Netzer, H., et al., 2008, ApJ, 679, 101
- Schöier et al. (2005) Schöier, F. L., van der Tak, F. F. S., van Dishoeck, E. F., & Black, J. H., 2005, A&A, 432, 369
- Sobolev (1957) Sobolev V., 1957, SvA, 1, 678
- Sofue & Rubin (2001) Sofue, Y., & Rubin, V., 2001, ARAA, 39, 137
- Solomon et al. (1990) Solomon P., Radford S., Downes D., 1990, ApJL, 348, 53
- Solomon & Vanden Bout (2005) Solomon P.M. & Vanden Bout P.A., 2005, ARAA, 43, 677
- Sternberg & Dalgarno (1995) Sternberg, A., & Dalgarno, A., 1995, ApJS, 99, 565
- Stevens & Gear (2000) Stevens J., Gear W., 2000, MNRAS, 312, L5
- Takamiya & Sofue (2002) Takamiya, T., & Sofue, Y., 2002, ApJL, 576, L15
- Thean et al. (1997) Thean A., Mundell C., Pdelar A., & Nicholson R., 1997, MNRAS, 290, 15
- Thompson et al. (2005) Thompson, T. A., Quataert, E., & Murray, N., 2005, ApJ, 630, 167
- Tristram et al. (2014) Tristram, K. R. W., Burtscher, L., Jaffe, W., et al., 2014, A&A, 563, AA82
- Trotter et al. (1998) Trotter, A. S., Greenhill, L. J., Moran, J. M., et al., 1998, ApJ, 495, 740
- Urry & Padovani (1995) Urry, C. M., & Padovani, P., 1995, PASP, 107, 803
- Usero et al. (2004) Usero A., García-Burillo S., Fuente A., Martín-Pintado J., Rodríguez-Fernández N., 2004, A&A, 419, 897
- Veilleux et al. (1994) Veilleux, S., Cecil, G., Bland-Hawthorn, J., et al., 1994, ApJ, 433, 48
- Viti et al. (2014) Viti S., García-Burillo S., Fuente A.. Hunt L., Usero A., et al. 2014, A&A, 570, A28
- Vollmer et al. (2008) Vollmer B., Beckert T., Davies R., 2008, A&A, 491, 441
- Wada & Norman (2002) Wada, K., & Norman, C. A., 2002, ApJL, 566, L21
- Wada et al. (2009) Wada K., Papadopoulos P., Spaan M., 2009, ApJ, 702, 63
- Wada (2012) Wada K., 2012, ApJ, 758, 66
- White et al. (1997) White R., Becker R., Helfand D., Gregg M., 1997, ApJ, 475, 479
- Wiklind & Combes (1995) Wiklind, T., & Combes, F., 1995, A&A, 299, 382
- Yamagishi et al. (2010) Yamagishi M., Kandea H., Ishihara D., Komugi S., Suzuki T., Onaka T., 2010, PASJ, 62, 1085
- Zaragoza-Cardiel et al. (2014) Zaragoza-Cardiel J., Font J., Beckman J., García-Lorenzo B., Erroz-Ferrer S., Gutiérrez L., 2014 MNRAS, 445, 1412
- Ziurys et al. (1989a) Ziurys, L. M., Snell, R. L., & Dickman, R. L., 1989, ApJ, 341, 857
- Ziurys et al. (1989b) Ziurys, L. M., Friberg, P., & Irvine, W. M., 1989, ApJ, 343, 201