Spin-isospin transitions in chromium isotopes within the quasiparticle random phase approximation
Abstract
Beta decay and electron capture on isotopes of chromium are advocated to play a key role in the stellar evolution process. In this paper we endeavor to study charge-changing transitions for 24 isotopes of chromium (42-65Cr). These include neutron-rich and neutron-deficient isotopes of chromium. Three different models from the QRPA genre, namely the pn-QRPA, the Pyatov method (PM) and the Schematic model (SM), were selected to calculate and study the Gamow-Teller (GT) transitions in chromium isotopes. The SM was employed separately in the particle-particle () and + particle-hole () channels. To study the effect of deformation, the SM was first used assuming the nuclei to be spherical and later to be deformed. The PM was used both in and + channels but only for the case of spherical nuclei. The pn-QRPA calculation was done by considering both and forces and taking deformation of nucleus into consideration. A recent study proved this version of pn-QRPA to be the best for calculation of GT strength distributions amongst the QRPA models. The pn-QRPA model calculated GT distributions had low-lying centroids and small widths as compared to other QRPA models. Our calculation results were also compared with other theoretical models and measurements wherever available. Our results are in decent agreement with previous measurements and shell model calculations.
keywords:
pn-QRPA , Pyatov method , Schematic model , Gamow-Teller strength distributions , chromium isotopes.1 Introduction
Gamow- Teller (GT) transitions play an important role in many astrophysical events in universe. As soon as the iron core of a massive star exceeds the Chandrasekhar mass limit, the degenerated pressure of electron gas can no longer support the core, and the core starts to collapse. During early stages of collapse many important nuclear processes, such as decays, electron captures, neutrino absorption and inelastic scattering on nuclei, appear. These reactions are mainly governed by GT (and Fermi) transitions. GT transitions for -shell nuclei are considered very important for supernova physics (Fuller et al., 1980,1982,1985). The GT transitions, in -shell nuclei, play decisive roles in presupernova phases of massive stars and also during the core collapse stages of supernovae (specially in neutrino induced processes). At stellar densities 1011 gcm-3, for -shell nuclei, the electron chemical potential approaches the same order of magnitude as the nuclear Q-value. Under such conditions, the -decay rates are sensitive to the detailed GT distributions. Consequently centroids and widths of the calculated GT distributions function become important. For still higher stellar densities, the electron chemical potential is much larger than nuclear Q-values. Electron capture rates become more sensitive to the total GT strength for such high densities. To achieve a better understanding of these notoriously complex astrophysical phenomena, a microscopic calculation of GT strength distributions (along with the total strength, centroid and width of these distributions) is in order.
The GT transitions are extremely sensitive to two-body interactions. The GT excitations deal with the spin-isospin degree of freedom and are executed by the operator, where is the spin operator and is the isospin operator in spherical coordinates. The plus sign refers to the GT+ transitions where a proton is changed into a neutron (commonly referred to as electron capture or positron decay). On the other hand, the minus sign refers to GT- transitions in which a neutron is transformed into a proton (-decay or positron capture). The third component GT0 is of relevance to inelastic neutrino-nucleus scattering for low neutrino energies and would not be considered further in this manuscript. Total GT- and GT+ strengths (referred to as and , respectively, in this manuscript) are related by Ikeda Sum Rule as , where and are numbers of neutrons and protons, respectively (Ikeda et al., 1963). Given nucleons are treated as point particles and two-body currents are not considered, the model independent Ikeda Sum Rule should be satisfied by all calculations.
Not many measurements of GT strength in chromium isotopes have been performed to the best of our knowledge. The decay of 46Cr was first studied by (Zioni et al., 1972), who used the 32S(16O,2n) reaction to produce 46Cr. Onishi and collaborators (Onishi et al., 2005) observed the -decay of 46Cr to the 1 state at 993 keV excitation energy in 46V. The nuclei decay to the and 1+ states of daughter nuclei were called favored-allowed GT transitions and possessed a signature small value. The experiment was performed at RIKEN accelerator research facility. Two sets of independent measurement of strength for 50Cr were also performed. Fujita et al. did a 50Cr(3He, )50Mn measurement up to 5 MeV in daughter (Fujita et al., 2011). On the other hand Adachi and collaborators (Adachi et al., 2007) were able to perform a high resolution 50Cr(3He, )50Mn measurement at an incident energy of 140 MeV/nucleon and at 00 for the precise study of GT transitions. The experiment was performed at RCNP, Japan. Owing to high resolution the authors were able to measure strength up to 12 MeV in 50Mn. At higher excitations above the proton separation energy, a continuous spectrum caused by the quasifree scattering appeared in the experiment. Nonetheless there is a need to perform more experiments to measure GT transitions in -shell nuclei. Next-generation radioactive ion-beam facilities (e.g. FAIR (Germany), FRIB (USA) and FRIB (Japan)) are expected to provide us measured GT strength distribution of many more nuclei. It is also expected to observe GT states in exotic nuclei near the neutron and proton drip lines. However simulation of astrophysical events (e.g. core-collapse supernovae) requires GT strength distributions ideally for hundreds of nuclei. As such experiments alone cannot suffice and one has to rely on reliable theoretical estimates for GT strength distributions.
Isotopes of chromium are advocated to play an important role in the presupernova evolution of massive stars. Aufderheide and collaborators (Aufderheide et. al., 1994) searched for key weak interaction nuclei in presupernova evolution. Phases of evolution in massive stars, after core silicon burning, were considered and a search was performed for the most important electron capture and -decay nuclei for 0.40 0.50 ( is lepton-to-baryon fraction of the stellar matter). The rate of change of during presupernova evolution is one of the keys to generate a successful explosion. From their calculation, electron captures on 51-58Cr and -decay of 53,54,55,56,57,59,60Cr were found to be of significant astrophysical importance, regarding their abundance and weak rates, to control in stellar matter. Heger and collaborators (Heger et. al., 2001) performed simulation studies of presupernova evolution employing shell model calculations of weak-interaction rates in the mass range A = 45 to 65. Electron capture rates on 50,51,53Cr were found to be crucial for decreasing the of the stellar matter. Similarly, it was shown in the same study that -decay rates of 53,54,55,56Cr played a significant role in increasing the content of the stellar matter. There exists a strong connection between supernova explosion and the -process nucleosynthesis (Cowan Thielemann, 2004). These and similar studies of presupernova evolution provided us the motivation to perform a detailed study of GT transitions for chromium isotopes. In this work we calculate and study GT distributions of twenty-four (24) isotopes of chromium, 42-65Cr, both in the electron capture and -decay direction.
The theoretical formalism used to calculate the GT strength distributions in the PM, SM and pn-QRPA models is described briefly in the next section. We compare our results with other model calculations and measurements in Section 3. A decent comparison would put more weight in the predictive power of the QRPA models used in this work. It is pertinent to mention again that our calculation includes many neutron-rich and neutron-deficient isotopes of chromium for which no experimental data is available for now. Core-collapse simulators rely heavily on reliable theoretical estimates of the corresponding weak rates in their codes. Section 4 finally summarizes our work and states the main findings of this study.
2 Theoretical Formalism
GT strength distributions of 42-65Cr isotopes were calculated by using three different (microscopic) quasiparticle random phase approximation (QRPA) models namely the pn-QRPA ((Staudt et. al., 1990; Hirsch et al., 1993)), the Pyatov Method (PM) and the Schematic Model (SM) (for details see (Pyatov Salamov, 1977; Babacan et al., 2004, 2005, 2005a)). The QRPA treats the particle-particle () and hole-hole amplitudes in a similar way as in particle-hole () amplitudes. The QRPA takes into account pairing correlations albeit in a non-perturbative way. Earlier a similar study for calculation of GT transitions for key titanium isotopes, using the same models, was performed (Cakmak et. al., 2014). It was shown in Ref. (Cakmak et. al., 2014) that the pn-QRPA (C) (incorporating and forces as well as deformations) was a far better model than pn-QRPA (A) (basic model in which only the interaction in ph channel was considered) and pn-QRPA (B) (including both and forces but no deformation). Further the pn-QRPA (C) was the only model that was satisfying the Ikeda Sum Rule. On the other hand, the SM and PM showed satisfying results in their respective subcategories for calculation of GT transitions (Cakmak et. al., 2014). Based on the results of (Cakmak et. al., 2014), we decided to categorize the PM and SM models in two categories as Model (A) and Model (B). Model (A) is spherical model with only channel, while Model (B) is also spherical with both and interactions. The interaction is usually thought to play a less important role in decay but shown to be of critical importance in decay and electron capture reactions (Hirsch et al., 1993). GT calculations have demonstrated deformation parameter to be one of the most important parameters in pn-QRPA calculations (Stetcu Johnson, 2004). The SM was also employed with + interactions and deformation of nucleus and is referred to as SM (C) model in this work. The pn-QRPA model was not categorized (for reasons mentioned above) and incorporated + interactions as well as nuclear deformation. In the PM, efforts for incorporation of deformation is currently in progress and it is hoped that results would be reported in near future. To summarize GT calculation for twenty-four chromium isotopes, both in electron capture and -decay direction, was performed using six different models: SM (A), SM (B), SM (C), PM (A), PM (B) and pn-QRPA in this work.
In this section, we give necessary formalism used in the PM, SM and pn-QRPA models. Detailed formalism may be seen in (Cakmak et. al., 2014) and is not reproduced here for space consideration.
2.1 Pyatov Method (PM) and the Schematic Model (SM)
The SM Hamiltonian for GT excitations in the quasi particle representation is given as
| (1) |
where is the Single Quasi Particle (SQP) Hamiltonian, and are the GT effective interactions in the and channels, respectively (Cakmak et al., 2010). The effective interaction constants in the and channel were fixed from the experimental value of the Gamow-Teller resonance (GTR) energy and the -decay log(ft) values between the low energy states of the parent and daughter nucleus, respectively. In order to restore the super symmetry property of the pairing part in total Hamiltonian, certain terms, which do not commute with the GT operator, were excluded from the total Hamiltonian and the broken commutativity of the remaining part due to the shell model mean field approximation was restored by adding an effective interaction term :
| (2) |
or
| (3) |
where , and are isovectors, Coulomb and spin orbital term of the shell model potential, respectively. The Gamow-Teller operators were defined in the following way:
| (4) |
where is spherical component of Pauli operators, are the raising and lowering isospin operators. The restoration term in Eq. (3) was included in a separable form:
| (5) |
The strength parameter of effective interaction was found from the commutation condition in Eq. (3) and the following expression was obtained for this constant (for details see Ref. (Salamov et al., 2006)):
The total Hamiltonian of the system according to PM is
| (6) |
The GT transition strengths were calculated using the formula:
| (7) |
where are the excitation energy in the nucleus. The transition strengths were defined as
| (8) |
and are required to fulfill the Ikeda Sum Rule (ISR)
| (9) |
Detailed mathematical formalism maybe seen in (Cakmak et. al., 2014). As shown above, the main difference between the PM and SM models is that the effective interaction term ( ) is not added to the total Hamiltonian in the SM. The term can make width and centroid values in the PM lower than corresponding values in SM (for further details, see Refs. (Babacan et al., 2005, 2005a; Cakmak et al., 2010; Selam et al., 2004; Salamov et al., 2003)).
2.2 The pn-QRPA Method
The Hamiltonian of the pn-QRPA model is given by
| (10) |
Single particle energies and wave functions were calculated in the Nilsson model which takes into account nuclear deformation. Pairing in nuclei was treated in the BCS approximation. In the pn-QRPA model, proton-neutron residual interaction occurs through both and channels. Both the interaction terms were given a separable form. For further details see Ref. (Hirsch et al., 1993). The reduced transition probabilities for GT transitions from the QRPA ground state to one-phonon states in the daughter nucleus were obtained as
| (11) |
where the symbols have their usual meaning. represents daughter excitation energies. can only take three values (-1, 0, 1) and represents the third component of the angular momentum. The transition strengths were calculated as in Eq. (8) and satisfied the ISR (Eq. (9)).
For odd-A nuclei, there exist two different types of transitions: (a) phonon transitions with the odd particle acting only as a spectator and (b) transitions of the odd particle itself. For case (b) phonon correlations were introduced to one-quasiparticle states in first-order perturbation. For further details, we refer to (Hirsch et al., 1993).
Experimentally adopted values of the deformation parameters, for even-even isotopes of chromium (48,50,52,54Cr), extracted by relating the measured energy of the first excited state with the quadrupole deformation, were taken from (Raman et. al., 1987). For other cases the deformation of the nucleus was calculated as
| (12) |
where and are the atomic and mass numbers, respectively, and is the electric quadrupole moment taken from Möller and collaborators (Möller et al., 1981). Q-values were taken from the recent mass compilation of Audi and collaborators (Audi et al., 2003).
3 GT± Strength Distributions
Our ultimate goal is to calculate reliable and microscopic weak rates for astrophysical environments, many of which cannot be measured experimentally. The theoretical calculation poses a big challenge. For example, it was concluded that -decay and capture rates are exponentially sensitive to the location of GT+ resonance while the total GT strength affect the stellar rates in a more or less linear fashion (Aufderheide et. al., 1996). Weak rates, with an excited parent state, are required in sufficiently hot astrophysical environments. But rates from excited states are difficult to get: an experiment on a nucleus shows where in the GT+ centroid corresponding only to the ground state of resides. The calculations, described in this paper, are also limited only to ground state parents, although we hope to tackle excited parents in the future. For a discussion on calculation of excited state GT strength functions using the pn-QRPA model we refer to (Nabi Klapdor-Kleingrothaus, 1999, 1999a, 2004).
For this paper, we focus on the variation in calculations of GT strength distribution using different QRPA models, to give us an idea of the theoretical uncertainty. We multiply results of all QRPA calculations by a quenching factor of = (0.6)2 (Vetterli et al., 1989; Cakmak et. al., 2014) in order to compare them with experimental data and prior calculations, and to later use them in astrophysical reaction rates. The re-normalized Ikeda sum rule in all our models subsequently translates to
| (13) |
We first present the calculated GT distributions using all our six QRPA models for all twenty-four isotopes of chromium. We divide the isotopes of chromium into even-even and odd-A categories. To save space we only show the calculated total strength, centroid and width of the GT strength distributions, in both electron capture and -decay directions, for all chromium isotopes.
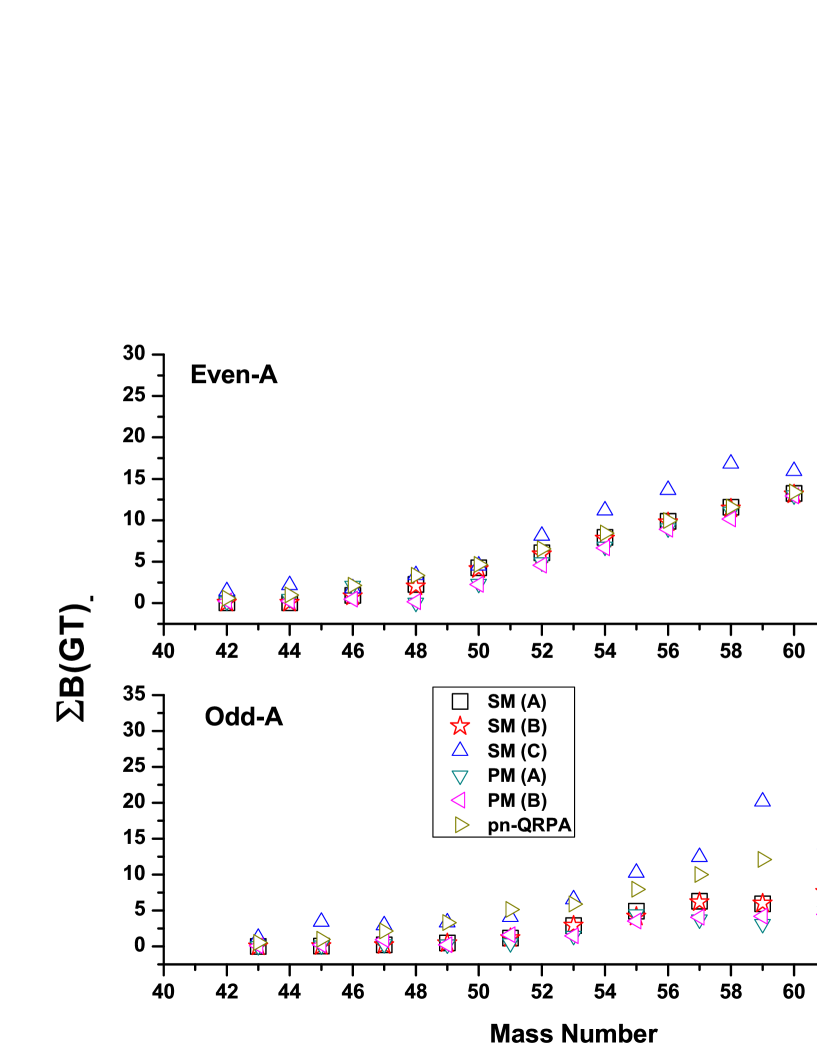
The total GT strength plays a very important role for the weak rates in stellar environment. They affect the stellar rates in a more or less linear fashion (Aufderheide et. al., 1996). Fig. 1 compares the calculated total strength values using all six QRPA models. The upper panel shows result for even-even isotopes whereas the lower panel those for odd-A isotopes of chromium. The total strength increases as the mass number increases. In case of even- A Cr isotopes, all six models calculate similar results for total GT strength in direction up to 52Cr isotope. Beyond this isotope, the SM (C) calculates bigger strength than other models. In odd-A Cr isotopes, the SM (C) model again shows a tendency to calculate bigger strength values. The SM (A), SM (B), PM (A) and PM (B) models calculate, in general, lower strength values. Beyond 53Cr isotope, the difference between the calculated values of the SM (C) and the pn-QRPA starts to increase with increasing mass number.
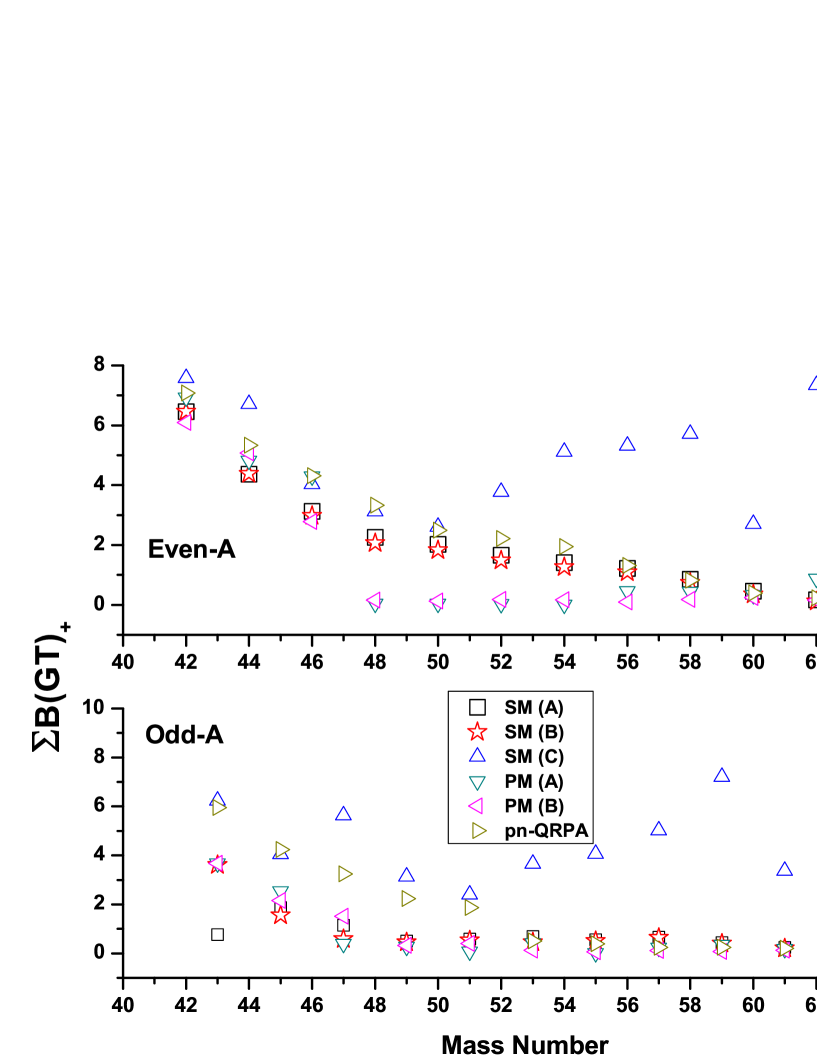
On the other hand, the total strength should decrease monotonically with increasing mass number (separately for even-even and odd-A cases). For even-even isotopes of chromium, this trend is followed by the pn-QRPA, SM (A) and SM (B) models (Fig. 2). For the odd-A nuclei, only the pn-QRPA model follows this trend. It is noted that SM (C) model has a tendency to calculate biggest strength values whereas PM (B) the smallest. The difference between the two model calculations tends to increase with mass number. For odd-A isotopes of chromium, all QRPA models, except SM (C), calculate almost same strength beyond 51Cr.
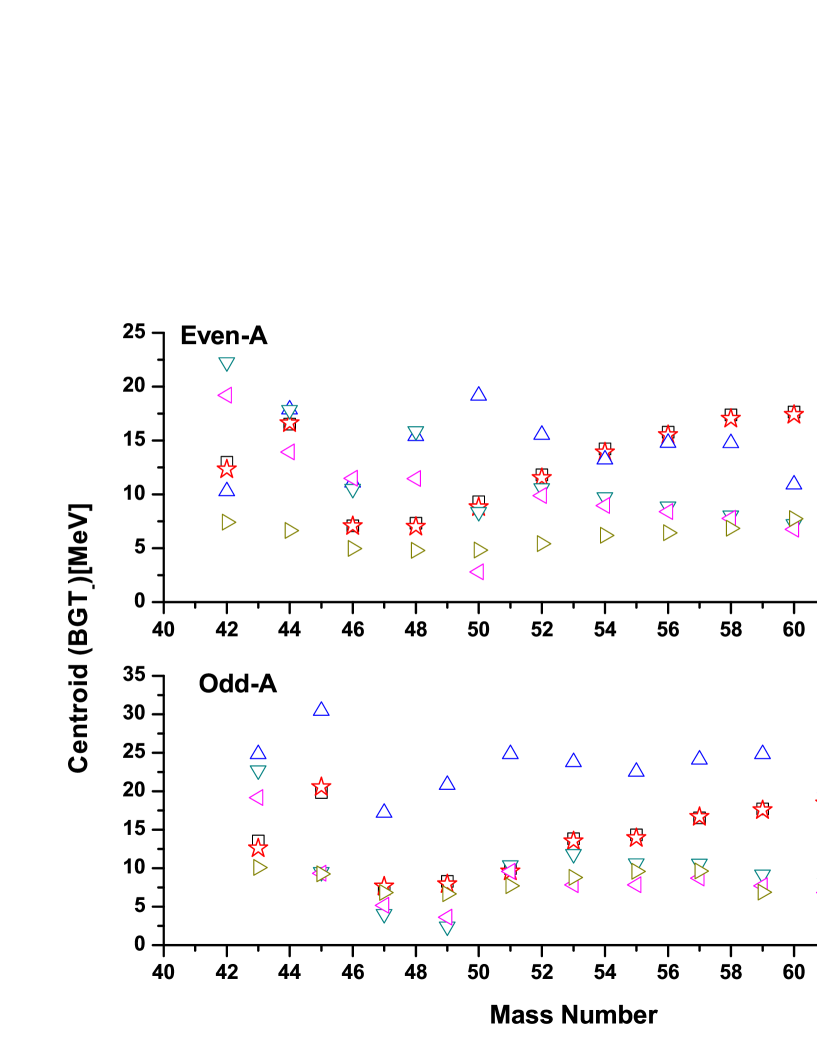
We next present the comparison of the calculated centroids of the GT distributions within the six QRPA models. The -decay and capture rates are exponentially sensitive to the location of GT+ resonance (Aufderheide et. al., 1996) which in turn translates to the placement of GT centroid in daughter. Fig. 3 shows the calculated GT centroids, in units of MeV, for even-even and odd-A isotopes of chromium in the -decay direction. The figure shows that, in general, the SM (C) model places the centroid at high excitation energies in manganese isotopes whereas the pn-QRPA at much lower energies. The other model calculations fall in between. The inclusion of particle-particle interaction affects the centroid results in the PM model. In general, it places the centroid at higher excitation energies in daughter. The SM (A) and SM (B) models calculate almost identical centroids. There is not much spread in the calculated centroid values by the pn-QRPA model. The calculated centroid values, in the case of pn-QRPA model, lies within the range 4–10 MeV for all 24 isotopes of chromium.
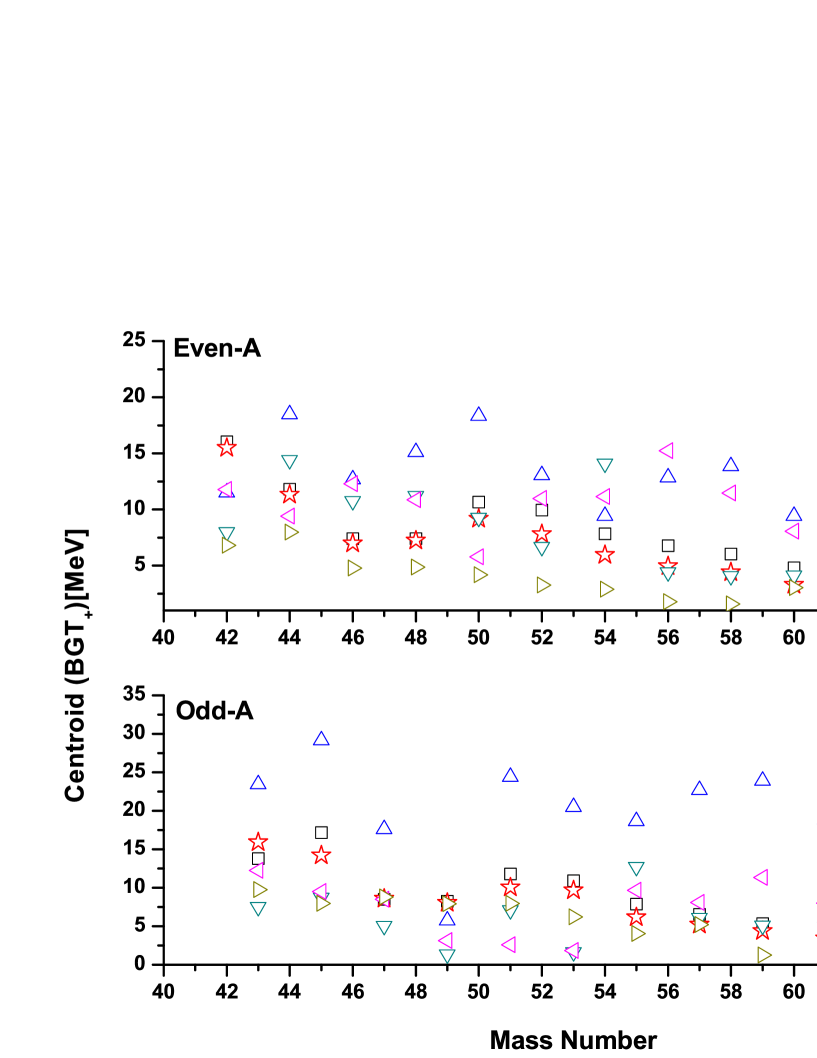
Fig. 4 displays the calculated centroids of the GT strength distributions in the electron capture direction for all 24 isotopes of chromium. Once again the figure shows that the SM (C) model possess a tendency of placing the centroids at high excitation energy in daughter. Except for 42Cr, the deformation increases the centroid values by more than a factor of 2–3 in the SM. The pn-QRPA model, on the other hand, calculates low-lying centroids. The pn-QRPA calculated centroid values are up to factor of 2–3 smaller than other models in all even Cr isotopes except for 60,62Cr. The spread in the calculated centroid values is again low for the pn-QRPA model, unlike other QRPA models, and lies roughly within the range of 2–9 MeV. The lower panel of Fig. 4 shows that inclusion of deformation in the SM results in placement of centroid at higher excitation energies akin to the case of even-even chromium isotopes.
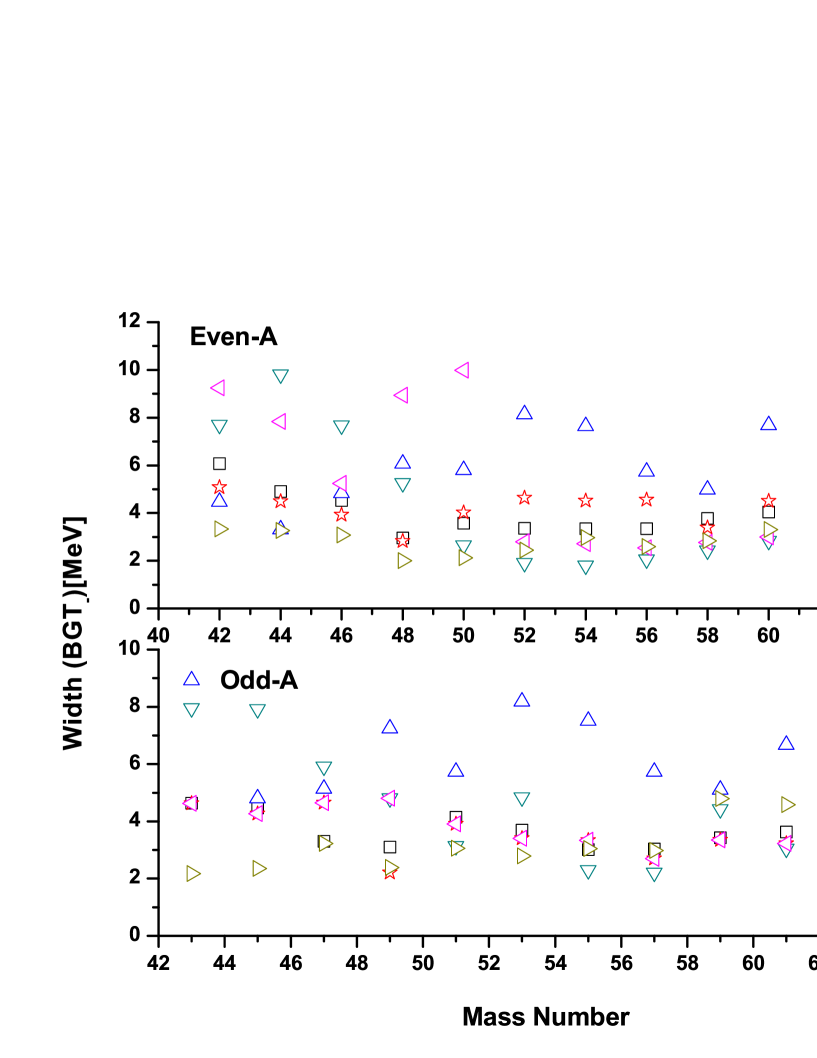
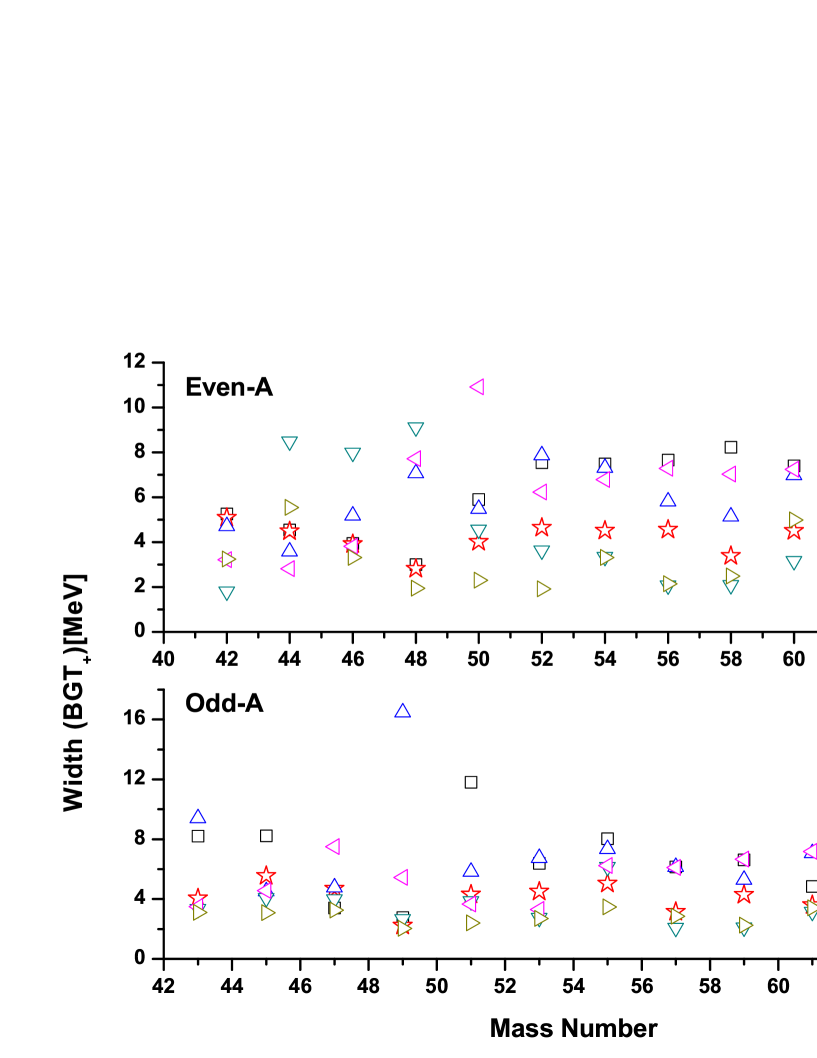
The widths of calculated GT distribution give an idea how much the individual GT states are scattered about the centroid value. The widths were calculated for all six models and the results are shown in Fig. 5 and Fig. 6. Whereas Fig. 5 shows the calculated widths, in units of MeV, in the -decay direction, Fig. 6 displays the calculated widths of all GT distributions in the electron capture direction. The figures show the fact that the pn-QRPA model calculates low widths between 2 and 5 MeV in both directions. For calculated GT distributions in the -decay direction, Fig. 5 shows that the PM (B) and SM (C) models calculate bigger widths between 8 and 10 MeV for even-even isotopes. For odd-A cases big widths in same range are calculated by the SM (C) and PM (A) models (Fig. 5). The effect of deformation on SM model can be seen by comparing the SM (B) and SM (C) models. For even-even chromium isotopes it is noted that deformation of nucleus leads to increased width values except for neutron-deficient and neutron-rich isotopes. Similarly, all QRPA models in Fig. 6 calculate big widths except for the pn-QRPA model.
Fig. 1 – Fig. 6 show the fact that the pn-QRPA calculated () strength increases (decreases) monotonically with increasing mass number. Further the pn-QRPA model calculates low-lying centroid values in daughter and also calculate smaller widths for the GT distributions. Other models show disparate results for calculated GT strength distributions. The SM (C) model has a tendency to calculate bigger GT strengths, centroids and widths for the GT distributions. The PM (B) model generally calculates low GT strength values.
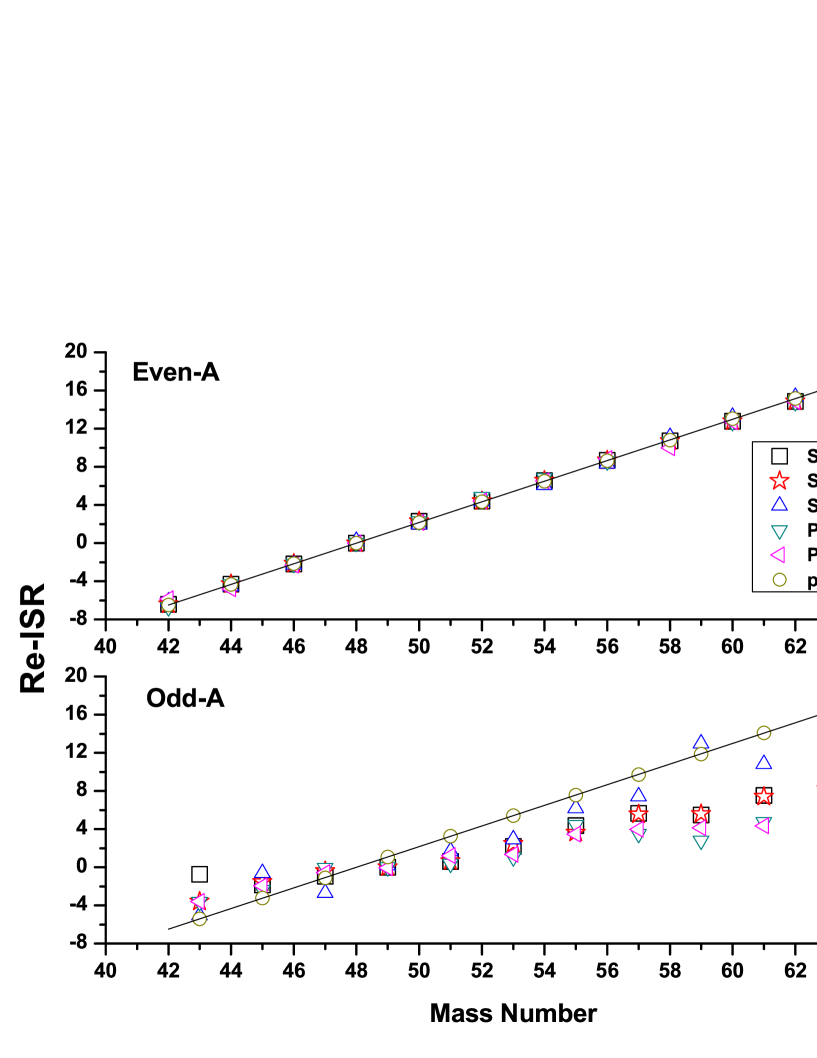
We also wanted to check how our six models perform when it comes to satisfying the model-independent Ikeda Sum Rule (ISR) (Eq. (13)). Fig. 7 shows the result. In Fig. 7 the solid line is the theoretically predicted value of re-normalized ISR and is shown to guide the eye. Fig. 7 shows that the re-normalized ISR is obeyed by all models for even-even cases. For odd-A cases it is only the pn-QRPA model that obeys Eq. (13). The SM (C) model does the best to satisfy Eq. (13) among the SM and PM models for odd-A chromium isotopes. The deviations increase with increasing mass number for the remaining QRPA models. Perhaps configuration mixing can account for the missing strength in the PM and SM models. The pn-QRPA model obeyed the ISR.
After the mutual comparison of the six QRPA model calculations of GT strength distribution for the twenty-four chromium isotopes, we wanted to see how our calculations compare with other theoretical models and measurements. We short-listed three of the best QRPA models for the sake of this comparison. Amongst the Schematic Model we chose the SM (C) model. The choice was rather straight forward as this model was performing GT calculation in both and channels and also taking the deformation of nucleus into consideration. From PM model, PM (B) was the better choice. Consequently, the pn-QRPA, SM (C) and PM (B) models were short-listed for the sake of comparison with other work. We searched the literature for previous calculations/measurements of GT strength distribution in isotopes of chromium and found a few results. Below we compare our calculations with these previous findings.
One can find unique information on nuclear structure in the mid- shell region by a study of GT decay in 46Cr. Besides measuring the favored-allowed GT transition in 46V, the authors (Onishi et al., 2005) also calculated the corresponding GT matrix element using the shell model. Three different interactions, namely the KB3G (Poves et al., 2001), FPD6 (Richter et al., 1991) and GXPF2 (Honma et al., 2002), were employed to perform the shell model calculation by the authors. (For a recent comparison between QRPA and shell model calculated GT strength distributions, see (Nabi Johnson, 2013).) The authors use a standard quenching factor of in their calculation. In Table 1, we compare our calculated values for 46Cr with the measured and calculated results of Onishi and collaborators. We also compare our results with the phenomenological quasideutron (QD) model (Lisetskiy et al., 2001) in Table 1. It can be seen from Table 1 that the closest value for the measured to the 1 state is the value obtained by shell model using the two body FDP6 interaction. However, our pn-QRPA calculated value of 0.49 is also very close to the FPD6 value and subsequently to the measured result obtained by Onishi et. al. The SM (C) model gives a value of 0.19 for this GT transition. The calculated total value using the PM (B) model is 0.35 up to 9.53 MeV in 46V. However PM (B) does not calculate any GT strength up to 1 MeV and hence was not included in Table 1. It can be concluded that pn-QRPA model and shell model using FDP6 interaction give a better description of the experimental result for total value of 46Cr compared with other calculations.
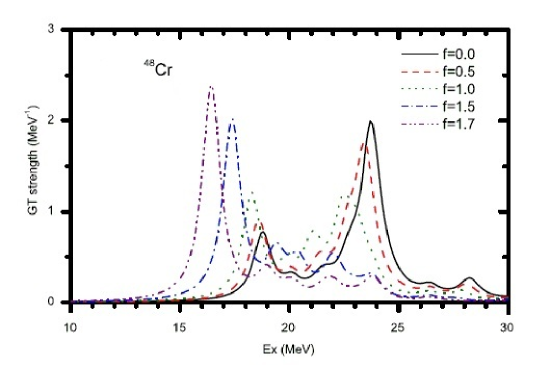
Bai and collaborators performed a Hartree-Fock-Bogoliubov + QRPA calculation using Skyrme interactions for GT states in = nuclei (Bai et al., 2013). The idea was to study the role of = pairing in the GT states. For this they scaled their pairing interactions with a factor which was varied from 0.0 (null pairing) to 1.7 (strong pairing). Their GT calculation for 48Cr is reproduced from their paper and shown as Fig. 8. The figure shows that with increase in pairing strength, the centroid of the GT distribution shifts to lower excitation energy. The authors calculated a total strength of 11.77. (It is to be noted that the x-axis of Fig. 8 represents excitation energy in parent nucleus.) The GT strength is distributed roughly over 15 MeV in parent. On the other hand Fig. 9 shows our QRPA calculations of GT- strength distribution in 48Cr. In all our calculations of GT strength distribution, the x-axis shows excitation energy in daughter nucleus. All calculations (Fig. 8 and Fig. 9) show GT fragmentation. Whereas the pn-QRPA calculates bulk of the GT strength at low excitation energy in daughter, the SM (C) model shifts the centroid to higher excitation energy. In PM (B) model, the main peak is at around 2.2 MeV , but GT states have been distributed up to 30 MeV in daughter. High-lying GT states are also seen in the SM (C) model and main peaks lie in the energy range of 20-25 MeV. The pn-QRPA model calculated a total strength of 3.33 and placed the centroid at 4.78 MeV. The SM (C) model calculated a similar total strength of 3.37 but centroid placement was at much higher excitation energy in 48Mn (15.4 MeV). On the other hand the PM (B) model calculated a very small strength of 0.16 and placed the energy centroid at 11.5 MeV in daughter.
Exact diagonalization shell model calculation in the scheme using the KB3 interaction was performed by Caurier and collaborators (Caurier et al., 1994) for 48Cr in the electron capture direction. The authors employed a quenching factor of in their calculation. Later Martínez-Pinedo et. al. performed a similar calculation for 49Cr (Martínez-Pinedo et al., 1997). The authors reported the value of 4.13 for total of 49Cr in their paper. Further the gross properties of even-even and = nuclei with mass number 48 to 64 were studied using the shell model Monte Carlo (SMMC) methods by Langanke and collaborators (Langanke et al., 1995). Calculations were not done for odd-A and odd-odd nuclei by SMMC because of a sign problem introduced by the projection of an odd number of particles. A quenching factor of was used in the calculation of total for 48Cr using the SMMC method. Our QRPA results are presented and compared with these calculations in Table 2. The biggest value, for both total and in 48Cr, is given by SMMC. The SMMC and Shell Model results are very close to each other. Our QRPA calculations give lower B(GT) values which we attribute to a bigger quenching factor used in our models. For 49Cr, the PM (B) model calculates the lowest strength. Shell Model did not report the total strength for 49Cr.
As mentioned earlier there were two different measurements of strength for 50Cr in literature (Fujita et al., 2011; Adachi et al., 2007). Petermann and collaborators (Petermann et al., 2007) performed large-scale shell model (LSSM) calculation of the GT strength distributions in -shell nuclei (including 50Cr) using the KB3G residual interaction (Poves et al., 2001). A quenching factor of was used in the LSSM calculation. In Fig. 10, we show the two experimental results, our model calculations and the calculation by Petermann et. al. for strength distributions in 50Cr. Fragmentation of GT states exist in all cases except in the GT distribution calculated by our PM (B) model. The pn-QRPA calculated strength distribution is in very good agreement with the measured data. In the SM (C), GT strength appears at higher energies. There exist only one main peak in the PM (B) model. GT states are mainly populated within energy interval of 3-7 MeV in both pn-QRPA and Exp. 2. The KB3G calculation of Petermann et. al. shows a wide spectrum of GT distribution covering states up to 15 MeV in daughter. The pn-QRPA placed the centroid of the calculated strength distribution at 4.81 MeV in daughter. The corresponding values calculated by the SM (C) and PM (B) models are 19.16 MeV and 2.79 MeV, respectively. Fig. 10 shows that the pn-QRPA calculation has the best agreement with the available experimental data.
Table 3 presents the comparison of our calculated total values for 50Cr with the measured data and LSSM. In this table the second column gives total value up to 5 MeV in 50Mn whereas the last column gives the strength up to 12 MeV in daughter. It can be seen from Table 3 that LSSM results are in very good agreement with the measured data up to 5 MeV. The PM (B) gives a good description of the experimental data for excitation energies up to 12 MeV. In this case the pn-QRPA and LSSM calculations give bigger total values than the measured data.
We compare the total for 50Cr with other theoretical calculations in Table 4. Large scale shell model calculations for -shell nuclei were performed by Caurier et. al. (Caurier et al., 1995) using the KB3 residual interaction. A quenching factor of was used in the calculation. Results for total for 50Cr along with other -shell nuclei were shown in Fig. 2 of (Caurier et al., 1995). The SMMC calculated value was taken from (Langanke et al., 1995). From Table 4 one notes that the Shell Model and SMMC results are very close to each other. Our calculated total values are lower than the corresponding LSSM and Shell Model results which we again attribute to the bigger quenching factor used in our calculation. The SM (C) and pn-QRPA models calculate similar strength values for 50Cr. The PM (B) gives the lowest value for total in 50Cr.
Petermann and collaborators (Petermann et al., 2007) also performed a large scale shell model calculation of in 52Cr using the KB3G interaction. We compare their results with our QRPA calculations in Fig. 11. The figure displays the fact that in this particular case, the pn-QRPA and shell model calculations produce a better fragmentation of GT states than the ones by PM (B) and SM (C) models. In shell model calculation the GT states are mainly concentrated between 5–15 MeV in daughter. The PM (B) model once again fails to produce the required fragmentation in GT states and produce a main peak at 9.9 MeV. In the SM (C) model, GT stated are calculated at higher excitation energy (around 10-15 MeV). The pn-QRPA once again places the energy centroid at low excitation energy of 5.41 MeV in 52Mn as against the value of 15.54 MeV and 9.88 MeV calculated by SM (C) and PM (B) models, respectively.
Our results for total strength (in both directions) for 52,53,54Cr are compared with other theoretical models in Table 5. Nakada and Sebe (Nakada Sebe, 1996) performed a large-scale shell model calculation for -shell nuclei by using Towner’s microscopic parameters and using the KB residual interaction. The authors incorporated a quenching factor of 0.68 in their Shell Model calculation. The results are shown in last row of Table 5. The Shell Model calculates biggest value for total in 52,53,54Cr. The same model also calculate biggest value for total in 52,53Cr. SMMC (Langanke et al., 1995) calculated total only for even-even nuclei. They were unable to perform calculations for odd-A nuclei for reasons mentioned earlier. The large scale shell model calculations of total in 52,54Cr were also reported by Petermann and collaborators (Petermann et al., 2007) and are in excellent agreement with results of our SM (C) model. For 53Cr isotope, we see that the results of the SM (C) and Shell Model for are very close to each other. In case of 54Cr, the SM (C) model calculates the biggest value of total . Further, it is noted that the SMMC, pn-QRPA and Shell Model results are close to each other. It is clear from Table 5 that the Shell Model results of Nakada and Sebe are way too big and requires further quenching of strength in -decay direction.
In Fig. 12, GT strength distributions for -decay transitions in 54Cr have been presented and compared with the large scale shell model calculation of Petermann et al. All models display different degree of GT fragmentation over many daughter states. Bulk of GT strength in states have been concentrated in different energy ranges in different models. They are placed at energy intervals of 2.5–10 MeV in pn-QRPA model , 10–20 MeV in SM (C) model and 8–16 MeV in shell model calculation. The PM (B) model shows very poor fragmentation. We attribute this to the neglect of deformation in the model. The assumption of spherical nuclei in PM (B) model leads to a concentration of most of the strength in one particular state. The total strength calculated by PM (B) model is 6.68. This is to be compared with the values of 8.45 and 11.19 calculated by the pn-QRPA and SM (C) models, respectively. The pn-QRPA model places the centroid at 6.10 MeV in 54Mn whereas the SM (C) model places the centroid at more than twice this energy.
We finally compare our calculated total values for 56Cr with SMMC model and results are shown in Table 6. For this even-even isotope of chromium, the SMMC and pn-QRPA results are in very good agreement. The SM (C) model calculates the highest value whereas PM (B) bagged a paltry strength of 0.09.
4 Summary and conclusions
From various studies of the presupernova evolution of massive stars, it was concluded that weak-interaction mediated reactions in chromium isotopes (along with other -shell nuclei) play a key role in the notorious and complex dynamics of supernova explosion. For more results concerning weak rates of other key -shell nuclei using the pn-QRPA model, see (Nabi Rahman, 2005; Nabi et al., 2007; Nabi Sajjad, 2008; Nabi, 2009, 2010, 2011, 2012; Nabi Johnson, 2013). Owing to the evidence of strong connection between supernova explosion and the -process nucleosynthesis (see e.g. (Cowan Thielemann, 2004)), we felt motivated to calculate and study the GT transitions in isotopes of chromium.
Six different QRPA models were used to calculate and study the GT transitions in twenty-four (24) isotopes of chromium. These included many important neutron-deficient and neutron-rich nuclei. The idea was to study the theoretical uncertainty involved in the QRPA models. The different models studied the effect of particle-particle interaction, particle-hole interaction and deformations in QRPA calculations. It was concluded that PM (B) calculated the lowest B(GT) strength values and failed to produce the desired fragmentation of the strength. As discussed before, the neglect of deformation in PM (B) model led to a concentration of most of the strength in one particular state. Interaction with a deformed mean field leads to fragmentation of the GT state and of GT strength (Hirsch et al., 1993; Onishi et al., 2005). The incorporation of deformation in the PM (B) model might improve the situation and we are currently working on this. The PM (B) and SM (C) models did satisfy Ikeda Sum Rule (ISR) for even-even cases but posed some deviations for the case of odd-A chromium isotopes. The SM (C) model calculated biggest values of total GT strength but at the same time also placed the GT centroid at high excitation energy in daughter nucleus. In the PM, the inclusion of interaction resulted in higher placement of centroid values in daughter nuclei. Similarly the inclusion of deformation in the SM led to calculation of bigger values of centroid. The pn-QRPA model displayed a tendency to calculate lower centroids which can translate to bigger weak rates in stellar environment. The SM and PM models satisfy ISR for even-even isotopes of chromium. The pn-QRPA model satisfied the ISR for both even-even and odd-A cases.
Our calculations were also compared with previous measurements and theoretical calculations wherever available. All our models showed decent comparison with previous measurements/calcuations in relevant cases. Of special mention is the very good agreement of pn-QRPA result with the measured strength distributions in 50Cr. It is hoped that the predicted GT strength distributions for the neutron-rich and neutron-deficient chromium isotopes would prove very useful for core-collapse simulators and other related network calculations.
Acknowledgments: J.-U. Nabi wishes to acknowledge the support provided by Tübitak (Turkey) under Project No. 1059B211402772 and the Higher Education Commission (Pakistan) through the HEC Project No. 20-3099. The authors also wish to acknowledge the useful discussions with Cevad Selam on the results of PM and SM models.
References
- Adachi et al. (2007) Adachi T., et al. Gamow-Teller transitions in pf -shell nuclei studied in (3He, t) reactions. Nucl. Phys. A 788, 70c-75c, 2007.
- Audi et al. (2003) Audi, G., Wapstra, A.H., Thibault, C. The AME2003 Atomic Mass Evaluation (II). Tables, Graphs and References. Nucl. Phys. A 729, 337-676, 2003.
- Aufderheide et. al. (1994) Aufderheide, M.B., Fushiki, I., Woosley, S.E., Stanford, E. and Hartmann, D.H. Search for important weak interaction nuclei in presupernova evolution. Astrophys. J. Suppl. Ser. 91, 389-417, 1994.
- Aufderheide et. al. (1996) Aufderheide, M.B., Bloom, S.D., Mathews, G.J. and Resler, D.A. Importance of (n,p) reactions for stellar beta decay rates. Phys. Rev. C 53, 3139-3142, 1996.
- Babacan et al. (2004) Babacan, T., Salamov, D.I. and Kucukbursa, A. The effect of the pairing interaction on the energies of isobar resonanse in 112-124Sb and isospin admixture in 100-124Sn isotopes. J. Phys. G 30, 759-770, 2004.
- Babacan et al. (2005) Babacan, T., Salamov, D.I. and Kucukbursa, A. Gamow-Teller states in 208Bi. Phys. Rev. C 71, 037303, 2005.
- Babacan et al. (2005a) Babacan T., Salamov, D. I. and Kucukbursa, A. The investigation of the log(ft) values for the allowed Gamow-Teller transitions of some deformed nuclei. Math. Comp. Appl. 10, 359-368, 2005.
- Bai et al. (2013) Bai, C.L., Sagawa, H., Sasano, M., Uesaka, T., Hagino, K., Zhang, H.Q., Zhang, X.Z. and Xu, F.R. Role of T = 0 pairing in Gamow Teller states in N = Z nuclei. Phy. Lett. B 719, 116-120, 2013.
- Cakmak et al. (2010) Cakmak, N., Unlu, S. and Selam, C. Gamow-Teller states in 112-124Sb isotopes, Pramana J. Phys., 75, 649-663, 2010.
- Cakmak et. al. (2014) Cakmak, S., Nabi, J.-U., Babacan, T. and Selam, C. Study of Gamow Teller transitions in isotopes of titanium within the quasi particle random phase approximation. Astrophys. Space Sci. 352, 645-663, 2014.
- Caurier et al. (1994) Caurier, E., Zuker, A.P., Poves, A., and Martínez-Pinedo, G. Full pf shell model study of A=48 nuclei. Phys. Rev. C 50, 225-236, 1994.
- Caurier et al. (1995) Caurier, E., Martínez-Pinedo, G., Poves, A., Zuker, A.P. Gamow-Teller strength in 56Fe and 56Fe Phys. Rev. C 52, R1736-R1740, 1995.
- Cowan Thielemann (2004) Cowan, J.J., Thielemann, F.-K. R-process Nucleosynthesis in Supernovae. Phys. Today Oct. 2004 issue, 57/10 47, 2004.
- Fujita et al. (2011) Fujita, Y., Rubio, B., Gelletly, W. Spin-isospin excitations probed by strong, weak and electro-magnetic interactions. Prog. Part. Nucl. Phys. 66, 549-606, 2011.
- Fuller et al. (1980,1982,1985) Fuller, G.M., Fowler, W.A. and Newman, M.J. Stellar Weak-Interaction Rates for sd-Shell Nuclei. I. Nuclear Matrix Element Systematics with Application to 26Al and Selected Nuclei of Important to the Supernova Problem. Astrophys. J. Suppl. Ser. 42, 447-473, 1980; Stellar Weak-Interaction Rates for sd-Shell Nuclei. I. Nuclear Matrix Element Systematics with Application to 26Al and Selected Nuclei of Important to the Supernova Problem. Astrophys. J. Suppl. Ser. 48, 279-320, 1982; Neutron Shell Blocking of Electron Capture During Gravitational Collapse. Astrophys. J. 252, 741-764, 1982; Stellar Weak Interaction Rates for Intermediate Mass Nuclei. IV. Interpolation Procedures for Rapidly Varying Lepton Capture Rates Using Effective log (ft)- Values. Astrophys. J. 293, 1-16, 1985.
- Heger et. al. (2001) Heger, A., Woosley, S.E., Martínez-Pinedo, G. and Langanke, K. Presupernova evolution with improved rates for weak interactions. Astrophys. J. 560, 307-325, 2001.
- Hirsch et al. (1993) Hirsch, M., Staudt, A., Muto, K. and Klapdor-Kleingrothaus, H.V. Microscopic predictions of /EC-decay half-lives. At. Data Nucl. Data Tables 53, 165-193, 1993.
- Honma et al. (2002) Honma, M., Otsuka, T., Brown, B.A. and Mizusaki, T. Effective interaction for pf-shell nuclei. Phys. Rev. C 65, 061301(R), 2002.
- Ikeda et al. (1963) Ikeda, K.I., Fuji, S., Fujita, J.I. The (p,n) reactions and beta decays. Phys. Lett. 3, 271-272, 1963.
- Langanke et al. (1995) Langanke, K., Dean, D.J., Radha, P.B., Alhassaid, Y.and Koonin, S.E. Shell-model Monte Carlo studies of fp-shell nuclei. Phys. Rev. C 52, 718-725, 1995.
- Lisetskiy et al. (2001) Lisetskiy, A.F., Jolos, R.V., Pietralla, N. and Brentano, P. von. Quasideuteron configurations in odd-odd N=Z nuclei. Phys. Rev. C 60, 064310, 1999; Lisetskiy, A.F., Gelberg, A., Jolos, R.V., Pietralla, N. and Brentano, P. von. Quasideuteron states with deformed core. Phys. Lett. B 512, 290-296, 2001.
- Martínez-Pinedo et al. (1997) Martínez-Pinedo, G., Zuker, A.P., Poves , A. and Caurier, E. Full pf shell study of A=47 and A=49 nuclei. Phys. Rev. C 55, 187-205, 1997.
- Möller et al. (1981) Möller, P. and Nix, J.R. Atomic Masses and Nuclear Ground-State Deformations Calculated with a New Macroscopic-Microscopic Model. At. Data Nucl. Data Tables 26, 165-196, 1981.
- Nabi Klapdor-Kleingrothaus (1999) Nabi, J.-Un and Klapdor-Kleingrothaus, H.V. Weak Interaction Rates of sd-Shell Nuclei in Stellar Environments Calculated in the Proton-Neutron Quasiparticle Random-Phase Approximation. At. Data Nucl. Data Tables 71, 149-335, 1999.
- Nabi Klapdor-Kleingrothaus (1999a) Nabi, J.-Un and Klapdor-Kleingrothaus, H.V. Microscopic calculations of weak interaction rates of nuclei in stellar environment for A = 18 to 100. Eur. Phys. J. A 5, 337-339, 1999.
- Nabi Klapdor-Kleingrothaus (2004) Nabi, J.-Un and Klapdor-Kleingrothaus, H.V. Microscopic calculations of stellar weak interaction rates and energy losses for fp- and fpg-shell nuclei. At. Data Nucl. Data Tables 88, 237-476, 2004.
- Nabi Rahman (2005) Nabi, J.-Un and Rahman, M.-Ur. Gamow-Teller strength distributions and electron capture rates for 55Co and 56Ni. Phys. Lett. B612, 190-196, 2005.
- Nabi et al. (2007) Nabi, J.-Un, Sajjad , M. and Rahman, M.-Ur. Electron capture rates on titanium isotopes in stellar matter. Acta Physica Polonica B 38, 3203-3223, 2007.
- Nabi Sajjad (2008) Nabi, J.-Un and Sajjad, M. Neutrino energy loss rates and positron capture rates on 55Co for presupernova and supernova physics. Phys. Rev. C 77, 055802, 2008.
- Nabi (2009) Nabi, J.-Un. Weak-interaction-mediated rates on iron isotopes for presupernova evolution of massive stars. Eur. Phys. J. A 40, 223-230, 2009.
- Nabi (2010) Nabi, J.-Un. Expanded calculation of neutrino cooling rates due to 56Ni in stellar matter. Phys. Scr. 81, 025901, 2010.
- Nabi (2011) Nabi, J.-Un. Ground and excited states Gamow-Teller strength distributions of iron isotopes and associated capture rates for core-collapse simulations. Astrophys Space Sci. 331, 537-554 (2011).
- Nabi (2012) Nabi, J.-Un. Nickel isotopes in stellar matter. Eur. Phys. J. A, 48, 84, 2012.
- Nabi Johnson (2013) Nabi, J.-Un and Johnson, C.W. Comparison of Gamow-Teller strengths in the random phase approximation. J. Phys. G 40, 065202, 2013.
- Nakada Sebe (1996) Nakada, H and Sebe T. Microscopic description of Gamow Teller transitions in middle pf-shell nuclei by a realistic shell-model calculation. J. Phys. G: Nucl. Part. Phys. 22, 1349 -1362, 1996.
- Onishi et al. (2005) Onishi, T.K., Gelberg, A., Sakurai, H., Yoneda, K., Aoi, N., Imai, N., Baba, H., Brentano, P. von, Fukuda, N. , Ichikawa, Y., Ishihara, M., Iwasaki, H., Kameda, D., Kishida,T., Lisetskiy, A.F., Ong, H.J., Osada, M., Otsuka, T., Suzuki, M.K., Ue, K., Utsuno, Y. and Watanabe, H. Gamow-Teller decay of the T=1 nucleus 46Cr. Phys. Rev. C 72, 024308, 2005.
- Petermann et al. (2007) Petermann, I., Martínez-Pinedo, G., Langanke, K. and Caurier, E. Breaking of the SU(4) limit for the Gamow-Teller strength in N Z nuclei. Eur. Phys. J. A 34, 319 -324, 2007.
- Pyatov Salamov (1977) Pyatov, N.I. and Salamov, D.I. Conservation laws and collective excitations in nuclei. Nucleonica 22, 1-127, 1977.
- Poves et al. (2001) Poves, A., S nchez-Solano, J., Caurier, E. and Nowacki, F. Shell model study of the isobaric chains A=50, A=51 and A=52. Nucl. Phys. A694, 157-198, 2001.
- Raman et. al. (1987) Raman, S., Malarkey, C.H., Milner, W.T., Nestor, C.W., Stelson, Jr. and P.H. Transition Probability, B(E2), from the Ground to the First-Excited 2+ State of Even-Even Nuclides, At. Data Nucl. Data Tables, 36, 1–96, 1987.
- Richter et al. (1991) Richter, W.A., Merwe, M.G. Van Der, Julies, R.E. and Brown, B.A. New effective interactions for the shell Nucl. Phys. A 253, 325-353, 1991.
- Salamov et al. (2003) Salamov, D.I., Kucukbursa, A., Maras, I., Aygor, H.A., Babacan, T. and Bircan, H. Calculation of the Log(ft) Values for the Allowed Gamow-Teller Transitions in Deformed Nuclei Using the Basis of Woods-Saxon Wave Functions, Acta Physica Slovaca, 53, 307-319, 2003.
- Selam et al. (2004) Selam, C., Babacan, T., Bircan, H., Aygor, H.A., Kucukbursa, A. and , Maras, I. The investigation of the Log(ft) Values for the Allowed Gamow-Teller Transitions of Some Deformed Nuclei, Mathematical Computational Applications, 9 (1), 79-90, 2004.
- Salamov et al. (2006) Salamov, D.I., et. al. Proceedings of 5th Conference on Nuclear and Particle Physics (NUPPAC 05), 361 (Cairo, August 2006)
- Staudt et. al. (1990) Staudt, A., Bender, E., Muto and Klapdor-Kleingrothaus, H.V. Second-Generation Microscopic Predictions of Beta-Decay Half-lives of Neutron-Rich Nuclei. At. Data Nucl. Data Tables, 44, 79-132, 1990.
- Stetcu Johnson (2004) Stetcu, I. and Johnson, C. W. Gamow-Teller transitions and deformation in the proton-neutron random phase approximation. Phy. Rev C 69, 024311, 2004.
- Vetterli et al. (1989) Vetterli, M.C., Häusser, O., Abegg, R., Alford, W.P., Celler, A., Frekers, D., Helmer, R., Henderson, R., Hicks, K.H., Jackson, K.P., Jeppesen, R.G., Miller, C.A., Raywood, K. and Yen, S. Gamow-Teller strength deduced from charge exchange reactions on 54Fe at 300 MeV. Phy. Rev. C 40, 559-569, 1989.
- Zioni et al. (1972) Zioni, J., Jaffe, A.A., FriedMan, E., Haik, N., Schectman, R. and Nir, D. An investigation of proton-rich nuclei and other products from the bombardment of 24Mg, 28Si and 32S by 16O ions. Nucl. Phys. A 181, 465-476, 1972.


| Models | |
|---|---|
| SM (C) | 0.19 |
| pn-QRPA | 0.49 |
| Exp. | 0.640.20 |
| FPD6 | 0.51 |
| KB3 | 0.31 |
| GXPF2 | 0.35 |
| QD | 0.41 |
| Models | 48Cr | 49Cr | ||
|---|---|---|---|---|
| SM (C) | 3.37 | 3.12 | 3.33 | 3.14 |
| PM (B) | 0.16 | 0.16 | 0.24 | 0.32 |
| pn-QRPA | 3.33 | 3.33 | 3.31 | 2.23 |
| SMMC (KB3) | 4.370.35 | 4.370.35 | - | - |
| Shell Model (KB3) | 4.13 | 4.13 | - | 4.13 |
| Models | 50Cr | |
|---|---|---|
| SM (C) | - | 0.41 |
| PM (B) | 0.18 | 2.19 |
| pn-QRPA | 2.79 | 4.65 |
| Exp. 1 | 1.49 | - |
| Exp. 2 | - | 2.69 |
| LSSM (KB3G) | 1.53 | 5.20 |
| Models | 50Cr |
|---|---|
| SM (C) | 2.61 |
| PM (B) | 0.12 |
| pn-QRPA | 2.49 |
| Shell Model (KB3) | 3.57 |
| SMMC (KB3) | 3.510.27 |
| Models | 52Cr | 53Cr | 54Cr | |||
|---|---|---|---|---|---|---|
| SM (C) | 8.14 | 3.78 | 6.57 | 3.66 | 11.19 | 5.12 |
| PM (B) | 4.57 | 0.18 | 1.46 | 0.12 | 6.68 | 0.17 |
| pn-QRPA | 6.55 | 2.21 | 5.91 | 0.51 | 8.45 | 1.95 |
| LSSM (KB3G) | 8.85 | - | - | - | 11.13 | - |
| SMMC (KB3) | - | 3.510.19 | - | - | - | 2.210.22 |
| Shell Model (KB) | 17.4 | 4.3 | 20.1 | 3.8 | 22.4 | 2.9 |
| Models | 56Cr |
|---|---|
| SM (C) | 5.32 |
| PM (B) | 0.09 |
| pn-QRPA | 1.31 |
| SMMC (KB3) | 1.50.21 |