Optical anisotropy of the = 1/2 Mott insulator Sr2IrO4
Abstract
We report the complex dielectric function along and perpendicular to the planes in the layered perovskite determined by spectroscopic ellipsometry in the spectral range from 12 meV to 6 eV. Thin high quality single crystals were stacked to measure the -axis optical conductivity. In the phonon response we identified 10 infrared-active modes polarized within the basal plane and only four modes polarized along the -axis, in full agreement with first-principle lattice dynamics calculations. We also observed a strong optical anisotropy in the near-infrared spectra arising from direct transitions between =1/2 and =3/2 bands, which transition probability is highly suppressed for light polarized along the -axis. The spectra are analyzed and discussed in terms of relativistic LSDA+U band structure calculations.
pacs:
78.20.Ci, 63.20.-e, 71.70.Ej, 71.20.-bI introduction
A rich variety of electronic ground states of transition metal oxides (TMOs) emerges from strong electron correlations and cooperative phenomena with competing interactions, including the on-site Coulomb repulsion , crystal-electric field (CEF), and spin-orbit coupling (SOC). The transition from elements with 3d via 4d to 5d valence orbitals progressively results in larger single particle band width , reduced , and enhanced SOC. TMOs of the type , where (3d), (4d), or (5d), allow one to consider the magnitudes of these interactions as variable parameters which can significantly influence the electronic structure within the same layered perovskite ’214’ structure. is particularly well known as the parent compound of a hole-doped high- superconductor family in close proximity to a Mott insulator ground state with antiferromagnetic ordering (Takagi, 2007). Whilst has the same crystal symmetry, its exotic low- superconducting state emerges from a Fermi-liquid metallic state (Mackenzie and Maeno, 2003). Its 5d counterpart represents, in turn, a prototype spin-orbit Mott insulator (Kim et al., 2008, 2009, 2012a). In the presence of strong SOC, the five states of the ions with 5d5 electron configuration form bands described by the effective quantum numbers =3/2 and =1/2. The latter, which is half-filled, is split already by moderate into a lower and upper Hubbard band, opening the spin-orbit Mott gap.
The magnetic interactions in also bear a resemblance to those in and can be described within an antiferromagnetic Heisenberg model with an effective spin 1/2 on a quasi two-dimensional square lattice Kim et al. (2012a). The discovery of a low temperature -wave gap Kim et al. (2016); Yan et al. (2015) and a splitting of the Fermi surface into so-called separated Fermi-arcs Kim et al. (2014) in electron doped , which are hallmarks of the doped cuprates Keimer et al. (2015), have recently been reported. These findings underscore the similarity of the the low-energy effective physics of and that of the superconducting cuprates, and they encourage further research to elucidate the relationship between Mott physics and superconductivity and to search for new routes to high- superconductivity.
Infrared and optical spectroscopies provide valuable information about the low-energy excitations, charge dynamics, and electron correlations in this class of materials. The in-plane conductivity spectra of single crystals of have been systematically studied Moon et al. (2008, 2009); Sohn et al. (2014) and show evidence of the cooperative electron correlation and SOC effects in the presence of the orbital-dependent electron-phonon interaction. To make further inferences about the electronic structure and underlying interactions in the layered iridate , the interplane response needs to be carefully examined; likewise in the ruthenates and cupratesKatsufuji et al. (1996); Pucher et al. (2003); Dordevic et al. (2003); Schafgans et al. (2010); Basov and Timusk (2005); Boris et al. (2002); Yu et al. (2008); Dubroka et al. (2011), where valuable information about the interplane coupling, phonon anomalies, the pseudo-gap phase and precursor Cooper-pair formation has been drawn from studies of the interlayer electrodynamics.
Furthermore, -axis optical conductivity data, along with the in-plane spectra, can be used to significantly constrain the model parameters for band structure calculations, such as the on-site Coulomb interaction .
A thorough and reliable study of the interplane response is impeded by the small size of the currently available crystals along the -axis, orthogonal to the planes. The interplane optical conductivity measured on -axis-oriented epitaxial films Nichols et al. (2013) is obscured by the substrate contribution and by the distorted electronic structure caused by the anisotropic biaxial strains Lupascu et al. (2014); Rayan Serrao et al. (2013). Instead, we have used an array of high-quality and well-aligned single crystals stacked along the -axis.
In this paper, we report a comprehensive ellipsometric study of the dielectric function anisotropy of over a wide range of photon energies, extending from the far-infrared (far-IR) into the ultraviolet (UV), and its interpretation based on band-structure and lattice dynamics calculations. The paper is organized as follows. Section II describes experimental and computational details. In Section III, the far-IR in- and out-of-plane phonon spectra are reported, followed by group theory analysis of the zone-center phonons and first-principles lattice dynamics calculations. The optical anisotropy of the interband transitions is discussed in Section IV. In Section V relativistic calculations, which use the local spin density approximation +U (LSDA+U) approach to account for the on-site Coulomb interaction U simultaneously with strong spin-orbit coupling, are reported in order to explain the observed anomalies and the anisotropy of the optical response. Finally, our conclusions are summarized in Section VI.
II experimental and computational details
High quality single crystals of were grown by a self flux method following Ref. Cao et al., 1998. They crystallize in the K2NiF4 structure with lattice parameters and . The plate-like crystals mechanically extracted from the crucible had lateral dimensions of about in the -plane and thicknesses less than in the -direction. In order to gain a sample thickness along the -axis that is sufficient for optical spectroscopy we prepared stacks of about 10 to 15 individual single crystals glued on top of each other by a minimal amount of GE-varnish. The crystals were co-aligned according to their in-plane crystallographic axes using Laue x-ray back scattering. Subsequently one -face of the stack was polished with dry polishing paper. The in-plane optical data were obtained from individual as-grown plate-like crystals.
We report spectroscopic ellipsometric data in a wide energy range from to over temperatures = to . For the IR range, we used home-built ellipsometers in combination with a Bruker IFS 66v/S and Vertex 80v Fourier Transform IR spectrometers. Some of the experiments were performed at the infrared beam line IR1 of the ANKA synchrotron light source at Karlsruhe Institute of Technology, Germany. Spectra in the visible and UV range were measured with a Woollam VASE variable angle spectroscopic ellipsometer equipped with an ultra-high vacuum cold-finger cryostat.
Spectroscopic ellipsometry determines the complex reflectance ratio
| (1) |
where and denote the reflectance of and polarized light and are given by the Fresnel equations, from which the full dielectric response is extracted.
For the calculations we used the low temperature experimental structural data according to Ref. Shimura et al., 1995. To calculate the phonon spectrum, we employed scalar relativistic density functional perturbation theoryBaroni et al. (2001) as implemented in quantum espressoGiannozzi et al. (2009). We used ultrasoft pseudopotentialsUSP , the generalized gradient approximationPerdew et al. (1996) and set the wave function (charge density) plane wave cutoff to 80 Ry (960 Ry), respectively. The initial structure was optimized to have a stress below 0.1 kbar and residual forces per atom smaller than 0.1 mRy/Bohr prior to the lattice dynamics calculation.
The relativistic band structure calculations were performed within the local spin density approximation (LSDA) using the linear muffin-tin orbital (LMTO) method Andersen (1975); Antonov et al. (2004). The Coulomb interaction of 5d electrons in the presence of strong SOC was taken into account using the rotationally invariant LSDA+U methodLiechtenstein et al. (1995); Yaresko et al. (2003). The on-site Coulomb repulsion was varied in the range from 1.15 eV to 2.15 eV and Hund’s coupling was fixed to the value estimated from LSDA. Thus, the parameter , which crudely determines the splitting between the lower and upper Hubbard bands, varied between 0.5 and 1.5 eV. Since the calculated optical conductivity does not show any significant dependence on the actual spin orientation within the antiferromagnetic phase, we assumed collinear antiferromagnetic order in -plane with moments aligned along the -axis.
III phonon spectrum
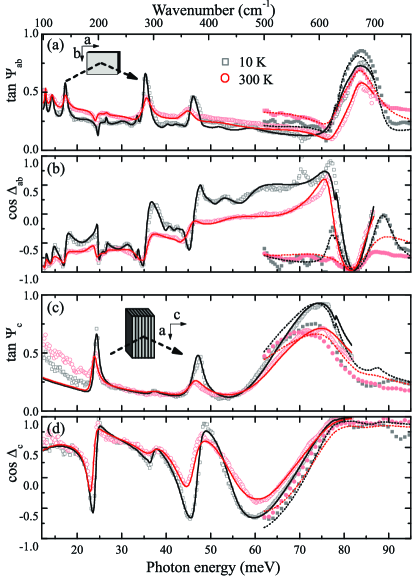
Panels (a) and (b) of Fig. 1 show the ellipsometric angles and obtained from the -plane in the far-IR and mid-IR spectral range up to (). Panels (c) and (d) exhibit the corresponding -plane response, where the -axis was co-aligned with the plane of light incidence as sketched in panel (a) and (c). Far-IR (open symbols) and mid-IR (closed symbols) data were taken at different angles of incidence and overlap in the spectral range from to . While there is certainly a finite spread in the alignment of individual single crystals of the stacks prepared for the -axis measurements there is no significant “contamination” from the in-plane response into the out-of-plane response as already evident from the raw data. For instance, there is no significant absorption in the -plane at the position of the highest energy -plane feature around . This underlines the validity of our stacking approach.
In the case of a system with uniaxial anisotropy the dielectric tensor has two complex eigenvalues – and . In principle, two independent ellipsometric data sets on - and -faces, as presented here, allow for wavelength-by-wavelength numerical inversion of the corresponding Fresnel equations. However, due to numerical instability of the inversion process wherever the ellipsometric angles and approach their extreme values of and , respectively, which happens especially around sharp spectral features, we have fitted the full anisotropic data set at the same time by two sets of harmonic oscillators with Lorentzian lineshapes:
| (2) | |||||
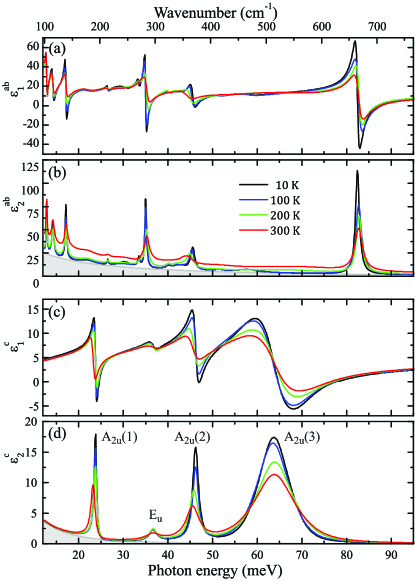
where , and denote the oscillator strength, center frequency and line width of the -th phonon resonance, respectively, and the effectively constant contribution of the high energy interband transitions to the real part of the dielectric function in the far-IR range. For the highest energy -axis phonon at we have to use a Voigt profile (that is a Lorentzian profile broadened by convolution with a Gaussian with width ) to account for the anomalously large line width. This additional broadening might be caused by the stacking approach and polishing of the crystal stack. The results of the corresponding fits are shown as solid lines in Fig. 1 for temperatures and , respectively. Accordingly, the fitted complex dielectric response is shown in Fig. 2 for both the -plane and the -axis also for intermediate temperatures. The best fit parameters for are summarized in Table 1 along with the -plane results from Moon et al. (2009), where we find good agreement.
We unambiguously distinguish eight phonon resonances in the -plane and four in the -axis dielectric response in contrast to six in-plane modes reported so far(Moon et al., 2009). The double peak structure located at and develops at low temperatures only and might be related to two additional phonons. It can be clearly seen in the spectra presented by Moon et al. (2009) but is not discussed there. The dip feature at clearly seen in the raw data of the in-plane response is a result from the ellipsometric measurement scheme and correctly modeled and reproduced by the lowest energy -axis phonon at . While the -plane phonons exhibit a small line width , indicating a high single crystal quality, all four -axis resonances are considerably broader. This might be attributed to the stacking procedure of many single crystals with enhanced contribution of the near-surface regions into the -axis optical response. Mechanical polishing as applied here can also induce strain effects in the surface layer which might significantly decrease the phonon lifetime (Evans and Ushioda, 1974), although the large penetration depth of far-IR radiation (of the order of several micrometers) increases significantly the bulk sensitivity, hence averaging out pure surface effects.
We find for both in- and out-of-plane response a nonzero background of absorption, which can be attributed to oxygen deficiency in the crystals (Sung et al., 2016). This might indeed have occurred under the growth conditions applied here. This background is modeled by a broad Lorentzian and shown as a shaded area for the case in Fig. 2. It shows only moderate temperature dependence between and .
| experiment | calculation | |||||
| () | () | 111Ref. Moon et al., 2009 () | () | symmetry | polarization | |
| -plane | ||||||
| -axis | ||||||
| 222 | ||||||
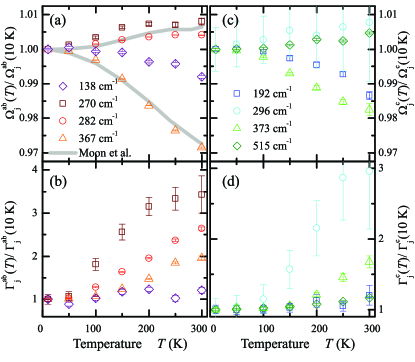
The temperature dependence of the resonant frequencies and corresponding line widths for a representative set of in-plane and all out-of-plane modes is shown in Fig. 3(a-d). The resonance frequencies of the in-plane modes reproduce the reported behavior Moon et al. (2009) and the out-of-plane modes show qualitatively similar characteristics: a regular anharmonic softening by 1.5% at of the modes at and , whereas the other two exhibit a small hardening upon heating. For the -axis modes as expected from the already enhanced line width at low temperatures the increase of with rising temperature is only moderate compared to their in-plane counterparts.
A space group analysis helps us to crosscheck our findings. The space group with the Wyckoff positions for (8a), (16d) and the 2 different oxygen sites (apical 16d and basal 16f) (Crawford et al., 1994) allows four and twelve doubly degenerate infrared active optical phonons (Kroumova et al., 2003). All modes belonging to the same irreducible representation (here either or ) are allowed to mix in order to form the eigenmodes of the ion lattice excited by infrared photons. If an irreducible representation embodies both in- and out-of-plane polarizations this intermixing can lead to allowed phonons both in the in-plane and out-of-plane response. The large unit cell of four formula units, which adds up to 28 atoms per unit cell, and the reduced crystal symmetry makes a phonon calculation computationally expensive but indispensable for further insights on the lattice dynamics. Therefore we compare our experimentally extracted phonon parameters with results from lattice dynamics calculations. The set of calculated zone center phonon frequencies is summarized in Table 1. We quantify the degree of -axis polarization of each phonon eigenmode by looking at the projection of the normalized eigenvector onto the -plane, , and -axis, , respectively, with in the range [0,1].
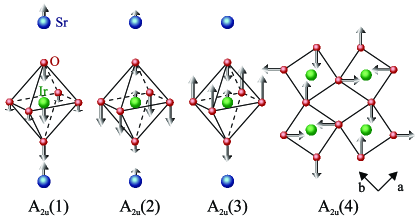
According to the calculated eigenvectors, we find that the set of four modes actually consists of three with pure -axis polarization and one polarized in the -plane. The respective mode patterns are depicted in Fig 4. The -axis modes to lead to octahedron bending and oscillations of the octahedra against the ions, well known from the high symmetry structure Pintschovius et al. (1989). , however, involves the planar oxygen atoms only and leads to a quasi-quadrupolar mode, which stems from the backfolding of zone boundary modes (from the point of the high symmetry structure ) due to the rotation of the octahedra and concomitant enlargement of the unit cell. Thus for , there is actually no intermixing of the in- and out-of-plane contributions.
In the group of the doubly degenerate modes, however, there is also one irreducible representation, which originates from the planar oxygen atoms, that generates a displacement in the -direction. This is an IR-inactive zone boundary mode of folded back to the point that tilts the oxygen octahedra. It mixes with other in-plane modes which could give rise to a non-vanishing dipole moment along the -axis for several eigenmodes. In our experimental data, however, we find in total only four out-of-plane resonances. This suggests only a weak or even absent out-of-plane dipole moment in all but one of the phonon modes.
With the highest phonon frequency at the total frequency range of the calculation matches quite well the experimental one. In qualitative agreement with the experimental results, we also find the highest -axis phonon at considerably lower frequency (). The considerable numerical discrepancy between the calculated and measured phonon frequencies is probably due to the fact that the material is metallic in this calculation. The phonon frequency and oscillator strength are therefore affected by charge screening, which is not present in the Mott-insulating compound.
Following this analysis and in contrast to previous work Cetin et al. (2012); Sohn et al. (2014) we assign the experimental -axis modes at and to be the one of symmetry and the one at of type. The in-plane modes are of symmetry, except of the highest energy one, that could be either related to the quasi-quadrupolar mode or the mode, which we find close by in energy in the calculation.
In summary, the far-infrared phonon spectrum is consistent with group symmetry considerations and lattice dynamics calculations. Distinct in- and out-of-plane spectra prove that the sample stack can be considered as a quasi-single domain in terms of its optical response, which allows us to examine the anisotropic dielectric tensor also at higher photon energies.
IV optical anisotropy
Figure 5 shows the real parts of the dielectric function and optical conductivity in-plane ( and ) as well as out-of-plane ( and ) in the photon energy range from . Since and are far from their extrema we apply the numerical inversion to correct for the anisotropy. In this energy range only moderate corrections to the absolute values of are introduced.
First, we will focus on the in-plane response at photon energies up to . The measured spectra agree very well with the spectra previously reported in the spectral range up to by Moon et al. (2009) and Sohn et al. (2014). We assign the low energy interband transitions accordingly as and . Above we find strong absorption setting in due to interband transitions with a plateau-like feature around and a further increase at higher photon energies with another shoulder around .
Following Fermi’s golden rule one finds the following frequency dependence of the imaginary part of the dielectric function for photon energies just above the direct optical gap (Yu and Cardona, 2005; Menzel et al., 2009): . Therefore we plot in the inset of Fig. 5(a) and obtain at of the linear fit. Both the amplitude and the temperature dependence of the gap are in good agreement with the reported values (Moon et al., 2009).
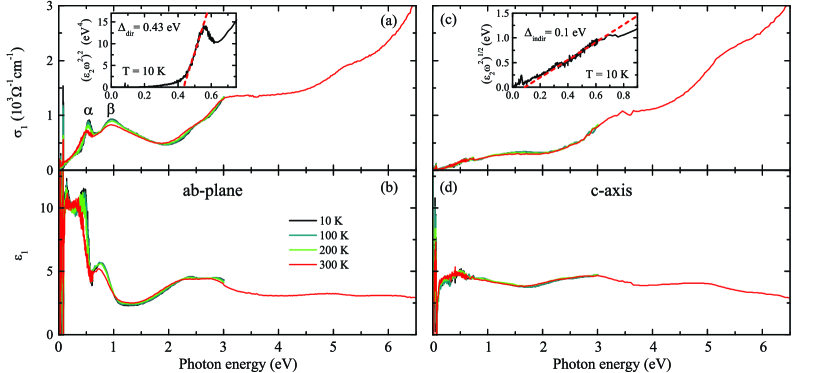
The out-of-plane response, however, shows remarkably different behavior. While at high photon energies the optical conductivity is almost identical to the in-plane response with very similar characteristic shoulder features around nd , the two bands and at lower photon energies are strongly suppressed with a remaining broad, hump-like background extending down to low frequencies. Surprisingly, the temperature dependence of the -axis response is rather weak up to room temperature. This low-energy -axis optical response can be understood in terms of an indirect gap. Phonon assisted absorption across an indirect optical gap involves essentially two processes. When the photon is absorbed an additional phonon can either be absorbed or emitted in order to fulfill energy and momentum conservation conditions. While the former strongly depends on the phonon density and is therefore strongly suppressed at low temperatures, the latter is stronger and weakly temperature dependent. For an indirect gap of two parabolic bands one expectsMenzel et al. (2009) . As depicted in the inset of Fig. 5(b), this expression provides an excellent description of the experimental data. In this way we estimate a low temperature indirect optical gap of about . But the absence of enhanced absorption at higher temperatures suggest additional absorption mechanisms, such as impurities, to be at play.
A similar trend has recently been reported on thin-films of epitaxially grown along the direction on (100) substrates which also provides access to the -axis response by normal incidence transmissionNichols et al. (2013). Although lattice mismatch and inevitable bi-axial strain effects lead to a significant orthorhombic distortion and hence a shift in the and bands to lower energies, the main features – strong suppression of and followed by an upturn and shoulder around – are quite similar in both sets of materials.
In an ionic picture the origin of the optical anisotropy with respect to the and interband transitions might be attributed to inter-site hopping of the excited electrons since on-site - transitions are forbidden by the dipole selection rules (Nichols et al., 2013), but this picture neglects the spatially extended nature and hybridization of the valence states as evident from the relatively large electronic bandwidths realized in TMOs. To elucidate the complex pattern of interband transitions and optical gaps we compare our experimental results with the optical conductivity from electronic band structure calculations.
V band structure calculations
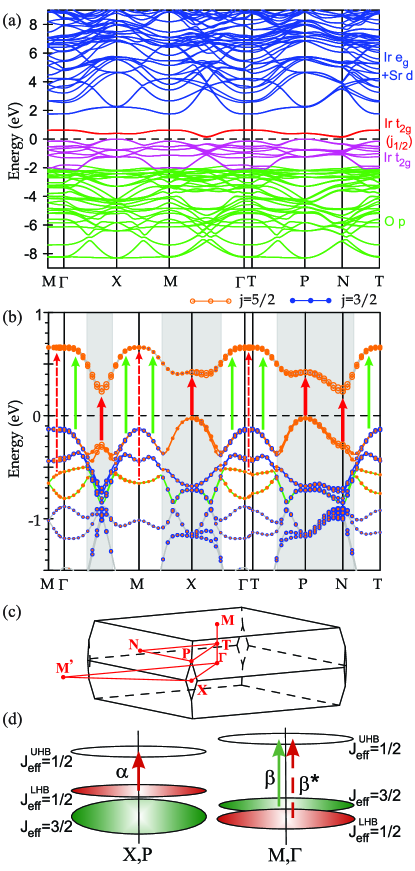
The electronic band structure in the energy range of to and an expansion of the region around the Fermi energy [,] are depicted in Fig. 6(a) and (b), respectively. In panel (b) the bands are decorated with circles proportional in size to their orbital character projected onto the basis set of the (blue) and (orange) states. As expected, we find the upper Hubbard band with pure , i.e. , character well separated from the lower Hubbard band and the states below the Fermi level [red and purple lines in Fig. 6(a)]. We adjusted to match the position of the low energy and transitions [inset of Fig. 7]. Hence, the direct optical band gap is naturally found to be about in our calculations.
Before we discuss the high energy features we will focus on the analysis of the low energy and double peak structure of the in-plane response. The band indeed stems from transitions between initial and final bands formed by pure states but only from restricted sections of the space near zone boundaries, e.g., around the -point or - high symmetry line [solid red arrows and gray shaded areas in Fig. 6(b)]. AFM order of moments within -plane stabilized by the on-site Coulomb repulsion causes opening of a gap near the zone boundary between two pairs of bands which are nearly degenerate in non-spin-polarized relativistic LDA calculations. These two pairs of bands show nearly parallel dispersions which insures a high joint density of states for interband transitions responsible for the band. This is in line with both previous theoretical dynamical mean-fieldZhang et al. (2013) and experimental photoemission results.Wang et al. (2013) Both find the highest occupied states with character around the -point, too.
The band located around , however, is more intricate. The occupied bands exhibit rather strong dispersion with the total width of about . They cross bands so that near the Brillouin zone center along –– line the bottom of the bands is buried well below the top of the ones. In agreement with previous resultsKim et al. (2008); Zhang et al. (2013) we found the band to have a dominant contribution from transitions with initial states [green arrows]. However, in contrast to the previous interpretation based on a simplified band pictureKim et al. (2008) transitions from initial bands also contribute to the optical conductivity at [dashed red arrows]. While the DMFT resultsZhang et al. (2013) lead to the same conclusions, Kim et al. (2012b) favor an interpretation in terms of a Fano-type interference of the broad electron-hole continuum with an optically inactive so-called SO-exciton, i.e., a magnetically active mode found as a broad peak around in resonant inelastic x-ray experiments.Kim et al. (2012a); Ishii et al. (2011) This depletes the optical excitation spectrum in that energy range which leaves the two-peak structure. Our calculations give the lower -band about twice as strong as the higher -band while in the experimental spectra the strength is approximately the same for both. Kim et al. (2012b) observed a similar trend in their microscopic model calculations when considering clusters of 4 ions. They relate this to interband mixing of and states which reflects the itinerancy of the system, i.e., the hybridization of states via neighboring oxygen 2 states.
Furthermore, our calculations allow us to analyze the full anisotropic optical response up to high energies. Fig. 7(a,b) presents the real parts of the calculated optical conductivity (out-of-plane) and (in-plane) in the spectral range up to along with the experimental data taken at .
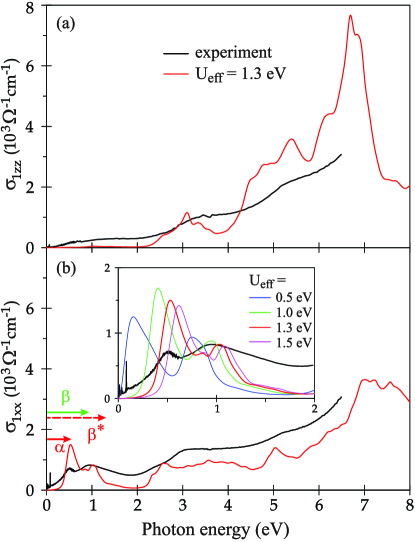
Most noticeable is the large optical gap of about along the -axis [Fig. 7 (a)] followed by a weak band centered around and several stronger bands around 5.5 and in rather good overall agreement with the experimentally obtained -axis response. For and we find the dipole matrix elements for -axis polarization below either completely vanishing as for the transitions or for to be strongly suppressed in strength by roughly two orders of magnitude compared to the in-plane response. Above interband transitions from the low lying oxygen states into the unoccupied states set in. This matches the absorption edge we find in the out-of-plane response around .
In the in-plane response [Fig. 7(b)] we identify three major features. Beside the discussed double peak structure the next set of interband transitions sets in around concurrent with the -axis response but at somewhat lower frequency than in the experimental spectra. From there a plateau reaches out to about followed by a further rise peaking at with approximately half the strength of the -axis response. The weak feature around seen in the experiment might find its counterpart at in the calculation.
Along the Brillouin zone boundaries, for example between the and points (see Fig. 6), we find an indirect optical gap of about . This could indeed enable phonon mediated indirect transitions, which as second order processes are beyond our calculations. These transitions may contribute to the hump in the -axis response as well as the strongly temperature dependent absorption edge tail and far-IR background seen in the -plane. The latter has also been shown to be relevant for , the narrow band gap bilayer analogue(Park et al., 2014).
VI conclusions
We demonstrate the feasibility of a stacking approach of single crystals to extract the -axis optical conductivity of as proven by a distinct phonon spectrum, which is in full accordance with lattice dynamics calculations. The observed uniaxial anisotropy in the infrared excitation spectrum is consistent with the suggested novel ground state within the LSDA+U band structure calculations. The absence of the characteristic IR double peak structure in the out-of-plane response is explained by vanishing dipole matrix elements. The additional information from the -axis response severely constrains the parameter space for calculations. Our comprehensive investigation of the optical response of a prototypical spin-orbit Mott insulator thus provides an excellent basis for experiments on doped layered iridates, which are promising candidates for exotic ground states including unconventional superconductivity.
References
- Takagi (2007) H. Takagi, Nat Mater 6, 179 (2007).
- Mackenzie and Maeno (2003) A. P. Mackenzie and Y. Maeno, Rev. Mod. Phys. 75, 657 (2003).
- Kim et al. (2008) B. J. Kim, H. Jin, S. J. Moon, J.-Y. Kim, B.-G. Park, C. S. Leem, J. Yu, T. W. Noh, C. Kim, S.-J. Oh, J.-H. Park, V. Durairaj, G. Cao, and E. Rotenberg, Phys. Rev. Lett. 101, 076402 (2008).
- Kim et al. (2009) B. J. Kim, H. Ohsumi, T. Komesu, S. Sakai, T. Morita, H. Takagi, and T. Arima, Science 323, 1329 (2009).
- Kim et al. (2012a) J. Kim, D. Casa, M. H. Upton, T. Gog, Y.-J. Kim, J. F. Mitchell, M. van Veenendaal, M. Daghofer, J. van den Brink, G. Khaliullin, and B. J. Kim, Phys. Rev. Lett. 108, 177003 (2012a).
- Kim et al. (2016) Y. K. Kim, N. H. Sung, J. D. Denlinger, and B. J. Kim, Nat Phys 12, 37 (2016).
- Yan et al. (2015) Y. J. Yan, M. Q. Ren, H. C. Xu, B. P. Xie, R. Tao, H. Y. Choi, N. Lee, Y. J. Choi, T. Zhang, and D. L. Feng, Phys. Rev. X 5, 041018 (2015).
- Kim et al. (2014) Y. K. Kim, O. Krupin, J. D. Denlinger, A. Bostwick, E. Rotenberg, Q. Zhao, J. F. Mitchell, J. W. Allen, and B. J. Kim, Science 345, 187 (2014).
- Keimer et al. (2015) B. Keimer, S. A. Kivelson, M. R. Norman, S. Uchida, and J. Zaanen, Nature 518, 179 (2015).
- Moon et al. (2008) S. J. Moon, H. Jin, K. W. Kim, W. S. Choi, Y. S. Lee, J. Yu, G. Cao, A. Sumi, H. Funakubo, C. Bernhard, and T. W. Noh, Phys. Rev. Lett. 101, 226402 (2008).
- Moon et al. (2009) S. J. Moon, H. Jin, W. S. Choi, J. S. Lee, S. S. A. Seo, J. Yu, G. Cao, T. W. Noh, and Y. S. Lee, Phys. Rev. B 80, 195110 (2009).
- Sohn et al. (2014) C. H. Sohn, M.-C. Lee, H. J. Park, K. J. Noh, H. K. Yoo, S. J. Moon, K. W. Kim, T. F. Qi, G. Cao, D.-Y. Cho, and T. W. Noh, Phys. Rev. B 90, 041105 (2014).
- Katsufuji et al. (1996) T. Katsufuji, M. Kasai, and Y. Tokura, Phys. Rev. Lett. 76, 126 (1996).
- Pucher et al. (2003) K. Pucher, A. Loidl, N. Kikugawa, and Y. Maeno, Phys. Rev. B 68, 214502 (2003).
- Dordevic et al. (2003) S. V. Dordevic, S. Komiya, Y. Ando, and D. N. Basov, Phys. Rev. Lett. 91, 167401 (2003).
- Schafgans et al. (2010) A. A. Schafgans, A. D. LaForge, S. V. Dordevic, M. M. Qazilbash, W. J. Padilla, K. S. Burch, Z. Q. Li, S. Komiya, Y. Ando, and D. N. Basov, Phys. Rev. Lett. 104, 157002 (2010).
- Basov and Timusk (2005) D. N. Basov and T. Timusk, Rev. Mod. Phys. 77, 721 (2005).
- Boris et al. (2002) A. V. Boris, D. Munzar, N. N. Kovaleva, B. Liang, C. T. Lin, A. Dubroka, A. V. Pimenov, T. Holden, B. Keimer, Y.-L. Mathis, and C. Bernhard, Phys. Rev. Lett. 89, 277001 (2002).
- Yu et al. (2008) L. Yu, D. Munzar, A. V. Boris, P. Yordanov, J. Chaloupka, T. Wolf, C. T. Lin, B. Keimer, and C. Bernhard, Phys. Rev. Lett. 100, 177004 (2008).
- Dubroka et al. (2011) A. Dubroka, M. Rössle, K. W. Kim, V. K. Malik, D. Munzar, D. N. Basov, A. A. Schafgans, S. J. Moon, C. T. Lin, D. Haug, V. Hinkov, B. Keimer, T. Wolf, J. G. Storey, J. L. Tallon, and C. Bernhard, Phys. Rev. Lett. 106, 047006 (2011).
- Nichols et al. (2013) J. Nichols, O. B. Korneta, J. Terzic, L. E. De Long, G. Cao, J. W. Brill, and S. S. A. Seo, Applied Physics Letters 103, 131910 (2013).
- Lupascu et al. (2014) A. Lupascu, J. P. Clancy, H. Gretarsson, Z. Nie, J. Nichols, J. Terzic, G. Cao, S. S. A. Seo, Z. Islam, M. H. Upton, J. Kim, D. Casa, T. Gog, A. H. Said, V. M. Katukuri, H. Stoll, L. Hozoi, J. van den Brink, and Y.-J. Kim, Phys. Rev. Lett. 112, 147201 (2014).
- Rayan Serrao et al. (2013) C. Rayan Serrao, J. Liu, J. T. Heron, G. Singh-Bhalla, A. Yadav, S. J. Suresha, R. J. Paull, D. Yi, J.-H. Chu, M. Trassin, A. Vishwanath, E. Arenholz, C. Frontera, J. Železný, T. Jungwirth, X. Marti, and R. Ramesh, Phys. Rev. B 87, 085121 (2013).
- Cao et al. (1998) G. Cao, J. Bolivar, S. McCall, J. E. Crow, and R. P. Guertin, Phys. Rev. B 57, R11039 (1998).
- Shimura et al. (1995) T. Shimura, Y. Inaguma, T. Nakamura, M. Itoh, and Y. Morii, Phys. Rev. B 52, 9143 (1995).
- Baroni et al. (2001) S. Baroni, S. de Gironcoli, A. Dal Corso, and P. Giannozzi, Rev. Mod. Phys. 73, 515 (2001).
- Giannozzi et al. (2009) P. Giannozzi, S. Baroni, N. Bonini, M. Calandra, R. Car, C. Cavazzoni, D. Ceresoli, G. L. Chiarotti, M. Cococcioni, I. Dabo, A. D. Corso, S. de Gironcoli, S. Fabris, G. Fratesi, R. Gebauer, U. Gerstmann, C. Gougoussis, A. Kokalj, M. Lazzeri, L. Martin-Samos, N. Marzari, F. Mauri, R. Mazzarello, S. Paolini, A. Pasquarello, L. Paulatto, C. Sbraccia, S. Scandolo, G. Sclauzero, A. P. Seitsonen, A. Smogunov, P. Umari, and R. M. Wentzcovitch, Journal of Physics: Condensed Matter 21, 395502 (2009).
- (28) We used the pseudopotentials Sr.pbe-nsp-van.UPF, Ir.pbe-n-rrkjus.UPF and O.pbe-n-rrkjus.UPF from http://www.quantum-espresso.org.
- Perdew et al. (1996) J. P. Perdew, K. Burke, and M. Ernzerhof, Phys. Rev. Lett. 77, 3865 (1996).
- Andersen (1975) O. K. Andersen, Phys. Rev. B 12, 3060 (1975).
- Antonov et al. (2004) V. N. Antonov, B. N. Harmon, and A. N. Yaresko, Electronic Structure and Magneto-Optical Properties of Solids (Kluwer Academic Publishers, Dordrecht, 2004).
- Liechtenstein et al. (1995) A. I. Liechtenstein, V. I. Anisimov, and J. Zaanen, Phys. Rev. B 52, R5467 (1995).
- Yaresko et al. (2003) A. N. Yaresko, V. N. Antonov, and P. Fulde, Phys. Rev. B 67, 155103 (2003).
- Evans and Ushioda (1974) D. J. Evans and S. Ushioda, Phys. Rev. B 9, 1638 (1974).
- Sung et al. (2016) N. H. Sung, H. Gretarsson, D. Proepper, J. Porras, M. L. Tacon, A. V. Boris, B. Keimer, and B. J. Kim, Philosophical Magazine (2016).
- Crawford et al. (1994) M. K. Crawford, M. A. Subramanian, R. L. Harlow, J. A. Fernandez-Baca, Z. R. Wang, and D. C. Johnston, Phys. Rev. B 49, 9198 (1994).
- Kroumova et al. (2003) E. Kroumova, M. Aroyo, J. Perez-Mato, A. Kirov, C. Capillas, S. Ivantchev, and H. Wondratschek, Phase Transitions 76, 155 (2003).
- Pintschovius et al. (1989) L. Pintschovius, J. M. Bassat, P. Odier, F. Gervais, G. Chevrier, W. Reichardt, and F. Gompf, Phys. Rev. B 40, 2229 (1989).
- Cetin et al. (2012) M. F. Cetin, P. Lemmens, V. Gnezdilov, D. Wulferding, D. Menzel, T. Takayama, K. Ohashi, and H. Takagi, Phys. Rev. B 85, 195148 (2012).
- Yu and Cardona (2005) P. Y. Yu and M. Cardona, Fundamentals of Semiconductors: Physics and Materials Properties (Springer, Berlin, 2005).
- Menzel et al. (2009) D. Menzel, P. Popovich, N. N. Kovaleva, J. Schoenes, K. Doll, and A. V. Boris, Phys. Rev. B 79, 165111 (2009).
- Zhang et al. (2013) H. Zhang, K. Haule, and D. Vanderbilt, Phys. Rev. Lett. 111, 246402 (2013).
- Wang et al. (2013) Q. Wang, Y. Cao, J. A. Waugh, S. R. Park, T. F. Qi, O. B. Korneta, G. Cao, and D. S. Dessau, Phys. Rev. B 87, 245109 (2013).
- Kim et al. (2012b) B. H. Kim, G. Khaliullin, and B. I. Min, Phys. Rev. Lett. 109, 167205 (2012b).
- Ishii et al. (2011) K. Ishii, I. Jarrige, M. Yoshida, K. Ikeuchi, J. Mizuki, K. Ohashi, T. Takayama, J. Matsuno, and H. Takagi, Phys. Rev. B 83, 115121 (2011).
- Park et al. (2014) H. J. Park, C. H. Sohn, D. W. Jeong, G. Cao, K. W. Kim, S. J. Moon, H. Jin, D.-Y. Cho, and T. W. Noh, Phys. Rev. B 89, 155115 (2014).