Charge-changing transitions and capture strengths of pf-shell nuclei with at proton drip-line
Abstract
Charge-changing transitions, commonly referred to as Gamow-Teller (GT) transitions, and electron capture/-decay strengths for pf-shell nuclei with at proton drip-line have been calculated using the proton-neutron quasi-particle random phase approximation (pn-QRPA) model. The total GT+ strength values and electron capture/-decay rates are needed for the study of the late stages of the stellar evolution. The pn-QRPA theory is used for a microscopic calculation of GT strength distribution functions and associated stellar electron capture/-decay rates of proton-rich pf-shell nuclei with in the mass range 46 A 56 at proton drip-line. Standard quenching factor of 0.74, usually implemented in the shell model calculation, has been incorporated for the comparison with experimental data (wherever available). The calculated GT strength of the two proton-rich nuclei, 52Ni and 56Zn are compared with experimental data of corresponding mirror nuclei. It has been found that the pn-QRPA results are in good agreement with the experimental data as well as shell model result. It is noted that the total GT strength increases linearly with the increase of mass number. The electron capture/-decay rates for proton-rich nuclei are calculated on a temperature and density scale relevant to presupernova evolution of massive stars. The decay half-lives are compared with measured and other theoretical calculations.
email: muneeb@icp.edu.pk00footnotetext: Faculty of Engineering Sciences, GIK Institute of Engineering Sciences and Technology, Topi 23640, Swabi, KP, Pakistan
email: jameel@giki.edu.pk
Keywords Gamow-Teller (GT) strength distribution; electron capture/-decay; pn-QRPA; proton drip-line; stellar dynamics; core-collapse.
1 Introduction
The simulation of supernovae explosion mechanism depends on many input parameters to be fed in relevant mega codes. Alone the parameters related to nuclear physics involve data for a large number of nuclei required to simulate this complex scenario. The more susceptible nuclei for electron capture and beta decay tend to be small in numbers, however, weak rate times abundance is the quantity important for necessary action. Synthesis of the iron group and other heavier elements substantially depend on many input parameters. Number of electrons per baryon (), energetics of the shock waves, entropy of the stellar core, mass and metalicity of the progenitor, mixing and fallback, and explosion energy are among the few. The hydrodynamic shock is believed to be formed at the edge of homologous core and its energy is related to as:
| (1) | |||
where , , , and are mass of the unshocked inner core (the homologous core), radius of homologous core, and initial and final lepton fraction, respectively (Kar et al. 1994; Nabi et al. 2004; Rahman et al. 2014). The central part of the massive stars () consists of iron core which grows with the passage of time. When this core exceed the appropriate Chandrasekhar mass limit, the implosion ensues. This collapse is subsonic and homologous in the inner region of the core and is supersonic in the outer regions. The behavior of the supernovae after collapse is very sensitive to the mass of homologous core, and consequently to final lepton fraction which in turn is dependent on the electron capture (Bethe 1990). The mass of the inner core has important consequences such as it sets the value of kinetic energy imparted to the shock wave, mass cut for material which the shock has to plough, and sets the amount of matter and angular momentum that can be dynamically relevant in the astrophysical scenario. For core density greater than the electromagnetic radiation and heat conduction are transported very slowly as compared to the time scale of the collapse (Juodagalvis 2010). Thus, for stellar core densities , provided the stars are not too massive, neutrinos bleed away from the surface to support low entropy condition and keep the nucleons bound inside nuclei in stellar interior. This reduction in entropy in stellar interior favors smaller mass of the iron core and consequently facilitate the shock’s outward march (Timmes et al. 1996). Lower entropy of the core favors the explosion because less energy is stored in the nuclear excited states in the collapsing core and presupernova environment and consequently the implosion process leads to higher density to produce stronger bounce and an energetic shock (Bethe et al. 1979). Bethe and collaborators (Bethe 1990; Bethe et al. 1979) pointed out that the lower central entropy makes it sensitive to the Chandrasekhar mass limit and due to the overlying matter’s pressure the mass of the final collapsing core is small as compare to the Chandrasekhar mass. The structure of the presupernova core (which determines the extent of the convective shells) and nucleosynthesis in stars are greatly effected by the entropy profile. Neutrino bleeding, entropy profile and electron to baryon ratio () are dependent on weak decay rates in stellar matter. Electron capture reduces the value of and electron degeneracy pressure in the core to accelerate the collapse. Various authors (Rahman et al. 2014; Juodagalvis et al. 2010; Heger et al. 2001; Nabi et al. 1999a; Liu 2013; Rahman et al. 2013) implemented different models to calculate the weak decay rates at temperature and density scale relevant to astrophysical environment. These authors noted that the electron capture rates are substantially suppressed in stellar core as compared to the seminal work of Fuller, Fowler and Newman (FFN)(Fuller et al. 1980, 1982a, 1982b, 1985). After recognition of the pivotal role of Gamow-Teller (GT) strength functions in astrophysical environment, FFN used the parameterization based on the independent particle model to calculate the GT contributions to the stellar rates. They inserted the experimental data, available at that time, for the discrete transitions and assigned a value of log ft = 5 to unmeasured allowed GT transitions. However, Caurier and collaborators (Caurier et al. 1999) observed that for even-even nuclei their GT centroid was at lower excitation energy in the daughter nucleus as compared to the FFN. It has also been noted that for odd-A and odd-odd nuclei, FFN placed GT centroid at too low excitation energies than the shell model and experimental data (Aufderheide et al. 1996; Langanke et al. 1998; Nabi and Rahman 2005). Experimental measurements showed that, contrary to the independent particle model, the total GT strength both in GT+ and GT- direction is quenched and fragmented over many final states in the daughter nucleus (Rapaport et al. 1983; Vetterli et al. 1989; Anderson et al. 1990; Ronnqvist et al. 1993; El-Kateb et al. 1994). This quenching and fragmentation of the GT strength is due to the residual interaction among the valence nucleons and an accurate description of these correlations is essential and play significant role for the calculation of stellar weak decay rates. Various models have been proposed and can be found in literature elsewhere.
The pn-QRPA is an efficient way to calculate GT strength and associated weak decay rates (Nabi et al. 1999a; Nabi 2009; Nabi 2012; Nabi et al. 2013). The pn-QRPA model has access to a liberal model space of 7 to perform the required calculation. For isospin symmetry, Fermi transitions are simple and they are only important for decay of proton-rich nuclei with Z N (Sarriguren 2013). The authors (Cole et al. 2012) used QRPA to calculate and compare GT strength and electron capture rates with experimental and other models for various pf-shell nuclei and discussed the pros and cons of their results for astrophysical scenario. The following section shows the necessary mathematical formulae for the calculation of GT strength distributions and weak decay rate at density and temperature scale that are relevant for astrophysical environment. The GT strength distributions, calculated in the present study, are compared with shell model results and measurements in Section 3. The electron capture rates for few selected proton drip-line nuclei (46Mn, 48Fe, 50Co, 52Ni and 56Zn) are presented in Section 4. Finally we conclude our study in Section 5.
2 Formalism
For the calculation of GT strength distributions and electron capture/-decay rates on proton rich nuclei in stellar environment, the following main assumptions were taken into account:
1) Only allowed GT and superallowed Fermi transitions were calculated in the present study. Forbidden transitions are relatively negligible for the density and temperature scales considered here.
2) It was assumed that the gas in the stellar medium is completely ionized and electrons are no longer bound to the nucleus and obey Fermi-Dirac distribution.
3) Neutrino and anti-neutrino captures escape freely from the interior and surface of the star for density scales considered in this project.
4) The effect of particle emission from the excited states were taken into account.
5) All excited states having energy less than () (separation energy of protons (neutrons)) were assumed to decay directly to the ground state through transitions.
The Hamiltonian, in the present study, takes the form
| (2) |
where , , , are the single-particle Hamiltonian, the pairing force (pairing was treated in the BCS approximation), the particle-hole (ph) GT force, and the particle-particle (pp) GT force, respectively. Single particle energies and wave function were calculated in the Nilsson model, which takes into account nuclear deformations. The proton-neutron residual interactions occurred as particle-particle and particle-hole interaction. The interactions were given separable form and were characterized by two interaction constants and , respectively. The details and fine tuning of these GT strength parameters can be found in literature (Staudt et al. 1990; Muto et al. 1992; Hirsch et al. 1993). Other parameters such as Nilsson potential parameters (taken from (Nilsson 1955)), the deformations, pairing gaps, and Q-value of the reactions were used in the calculation of weak decay rates. Nilsson oscillator constant was taken as (MeV) for both neutrons and protons. The traditional choice of was used for the pairing gaps. Deformation of the nuclei was calculated as
| (3) |
where and are the atomic and mass numbers, respectively and is the electric quadrupole moment taken from Ref. (Möller et al. 1981). Q-value of the reaction was taken from the mass compilation of Audi and Wapstra (Audi et al. 2003).
The electron capture (ec) and positron decay (pd) rates of a transition from the state of the parent to the state of the daughter nucleus are given by
| (4) |
The value of D was taken to be 6146 6 s adopted from Ref. (Jokinen et al. 2002). Here and are the reduced transition probabilities due to Fermi and GT transitions:
| (5) |
| (6) |
| (7) |
Here is the spin operator and stands for the isospin raising and lowering operator and is the effective ratio of the axial-vector to the vector coupling constants that takes into account the observed quenching of the GT strength (Osterfeld 1992). In the present work was taken as
| (8) |
with taken as -1.257. In the present work the dominant Gamow-Teller transition strength are taken into account for the electron capture/-decay rate calculation. In order to calculate the Fermi transitions, the Coulomb displacement energy was calculated as
| (9) |
Where is average charge of the pair of the respective nucleus and A is the mass number. The energy position of the isobaric analog state (IAS) was computed using the following equation:
| (10) |
where is the beta decay energy (to the ground state of the daughter nucleus), and are mass of neutron and proton, respectively.
The are the phase space integrals and are functions of stellar temperature (), electron density () and Fermi energy () of the electrons. They are explicitly given by
| (11) |
and by
| (12) |
In Eqs. (11) and (12), is the total energy of the electron including its rest mass. is the total -decay energy,
| (13) |
where and are masses and excitation energies of the parent nucleus, and and of the daughter nucleus, respectively. F( Z,w) are the Fermi functions and were calculated according to the procedure adopted by Gove and Martin (Gove et al. 1971). G± are the Fermi-Dirac distribution functions for positrons (electrons).
| (14) |
| (15) |
here is the kinetic energy of the electrons and is the Boltzmann constant.
The neutrino blocking of the phase space was not taken into account for reasons mentioned earlier. The total capture/-decay rate per unit time per nucleus is finally given by
| (16) |
The summation over the initial and final states was carried out until satisfactory convergence was achieved is stellar weak rates calculation. Here is the probability of occupation of parent excited states and follows the normal Boltzmann distribution.
3 Charge-changing Strength Distributions for Proton Drip-Line Nuclei
Due to the advancement of Radioactive Ion Beam (RIB) facilities worldwide (e.g. projectile- fragmentation facilities at GANIL with powerful LISE3 separators for in-flight isotope separation), the study of medium mass proton drip-line nuclei are now in experimental reach (Pougheon et al. 1987; Borrel et al. 1992). As one moves on the proton-rich side of the nuclear landscape the Q energy window in the GT+ (electron capture) direction increases and thereby allows access to large GT strength. The pn-QRPA theory was used to calculate the GT strength in the isospin raising direction, , for pf-shell nuclei at proton drip-line. The proton-rich nuclei 46Mn, 48Fe, 50Co, 52Ni and 56Zn were studied in this project and are also shown on the nuclear chart in Fig. 1. These nuclei have an excess of four protons and represent the bound nuclei (Pougheon et al. 1987).
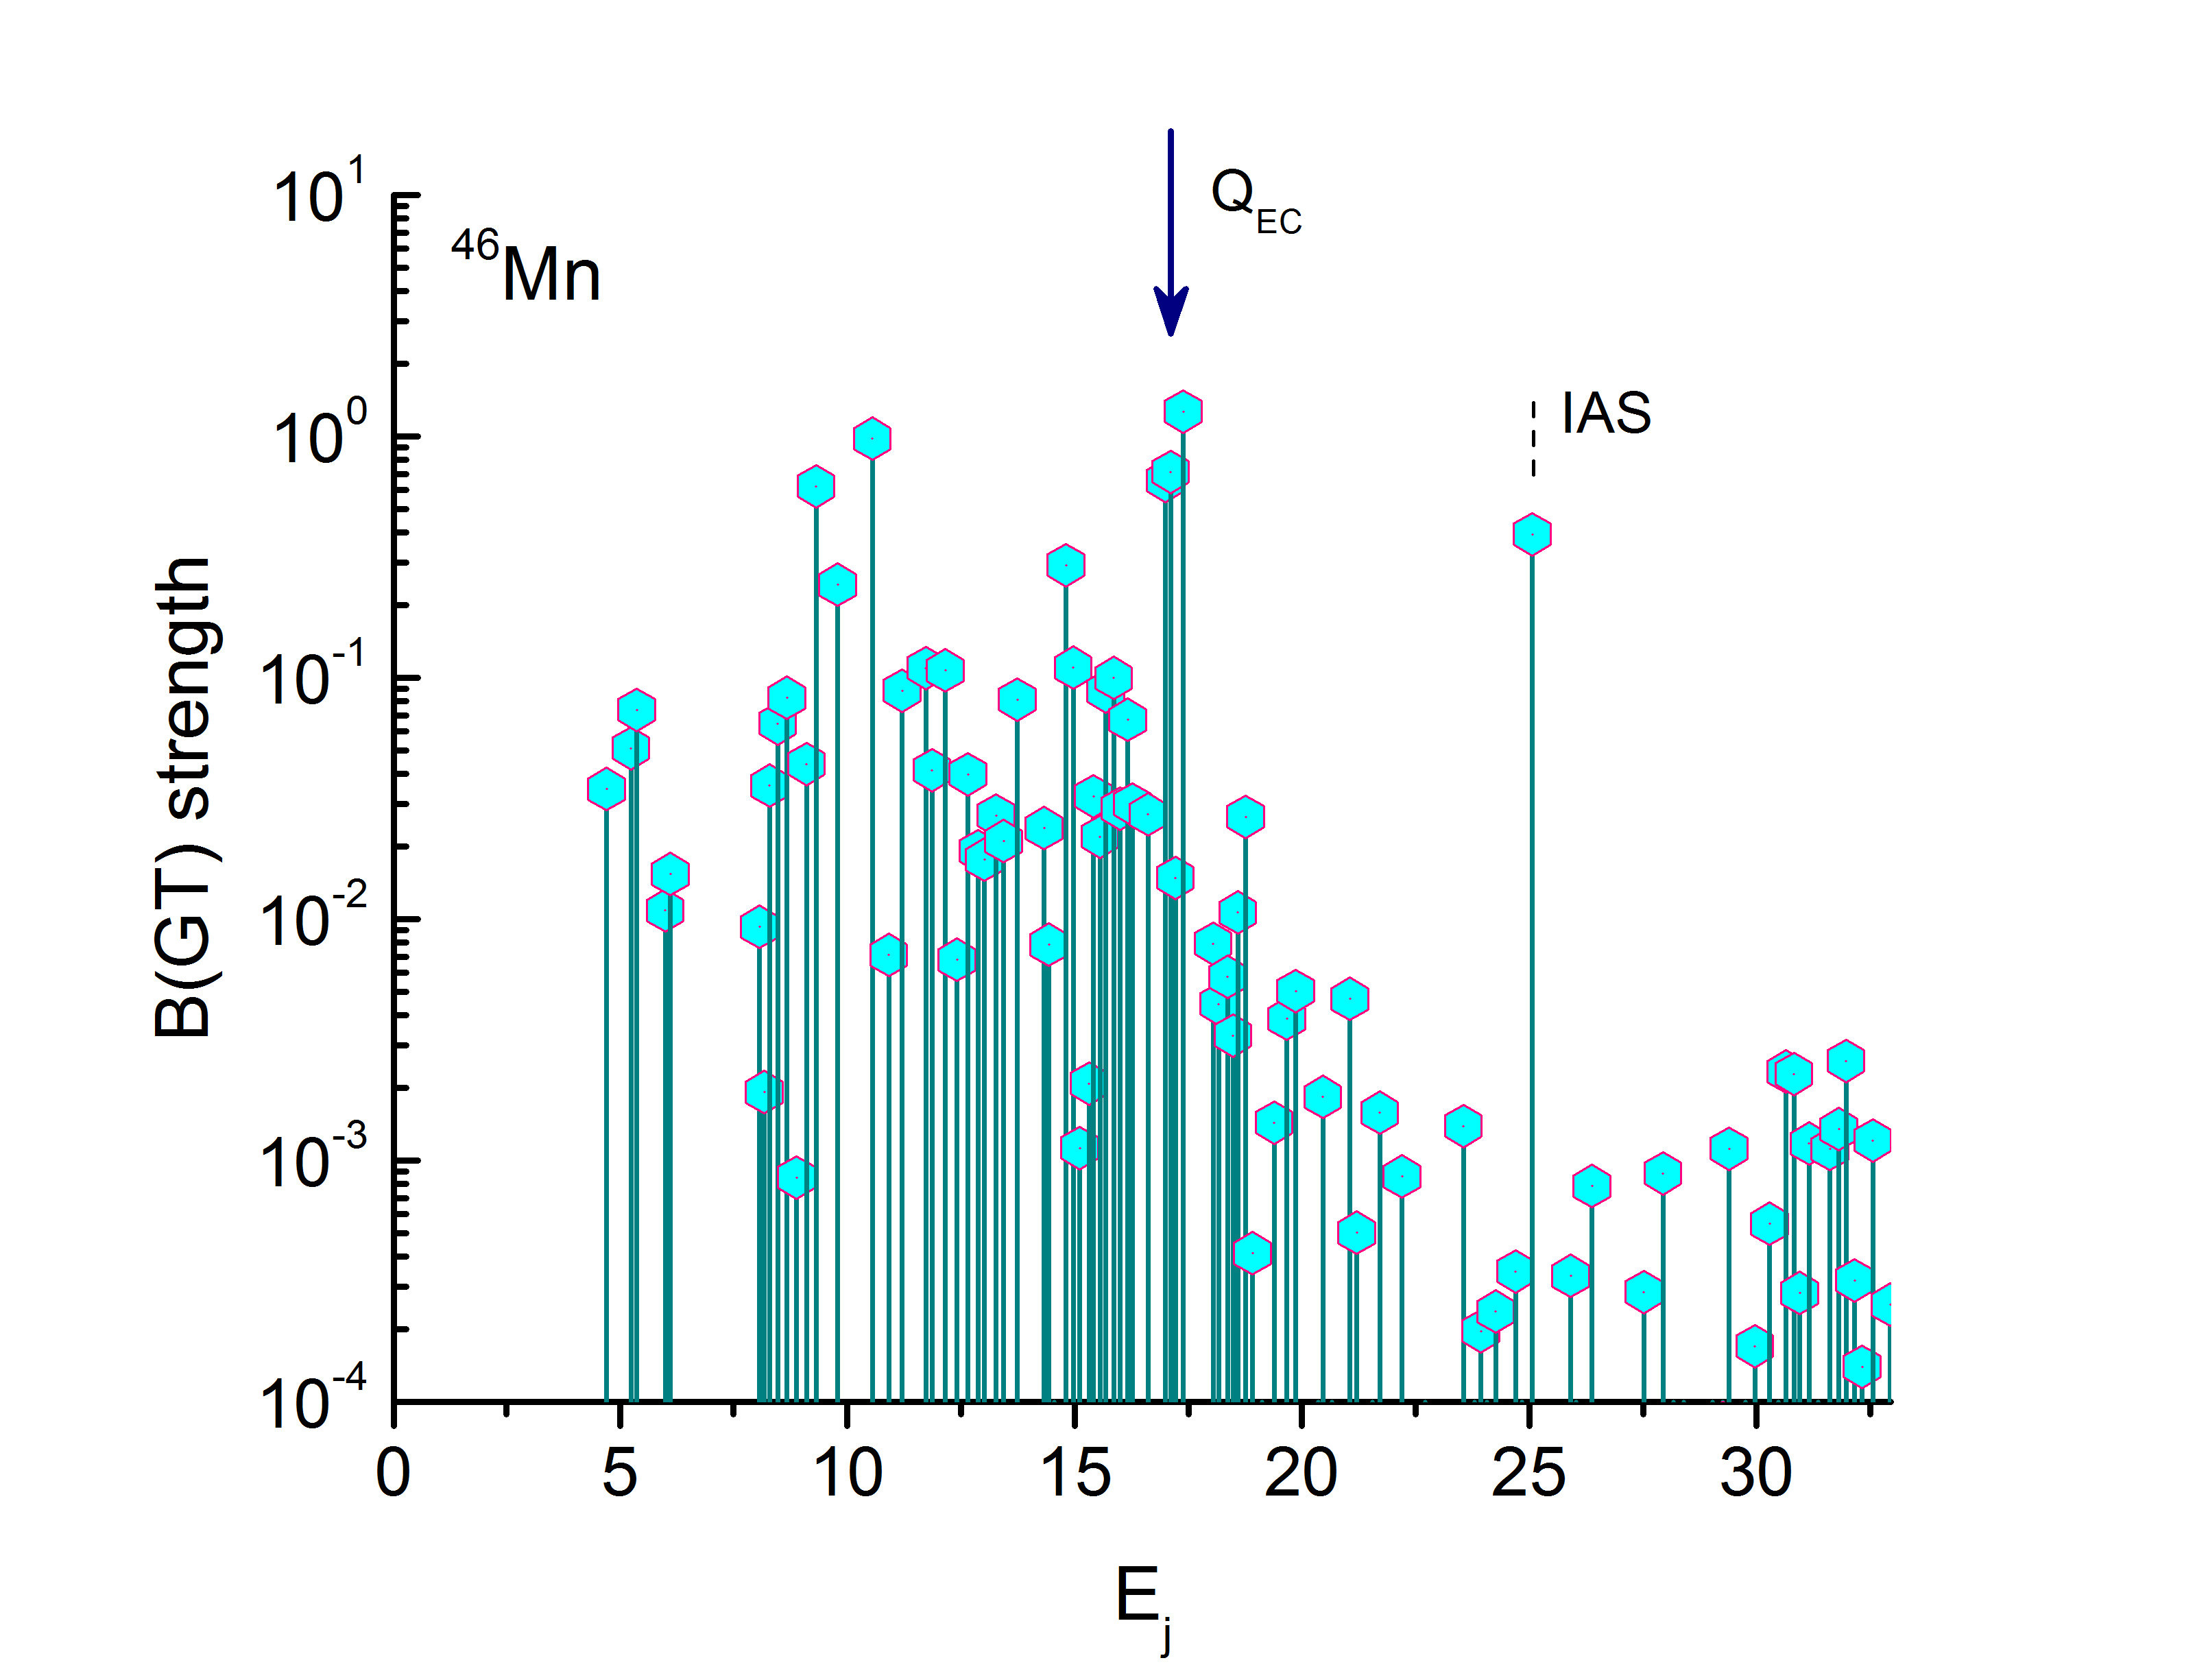
The representative GT strength distributions in the electron capture direction (GT+) for 46Mn and 50Co are shown in Fig. 2 and Fig. 3, respectively. The energy scale refers to excitation energy in daughter nuclei. The energy position of the isobaric analogue state (IAS) is shown by dashed-line in Fig. 2 and Fig. 3. The for 46Mn, 48Fe, 50Co, 52Ni, and 56Zn is 25.06 MeV, 19.38 MeV, 25.75 MeV, 19.99 MeV, 22.09 MeV, respectively. The ground state values and mass excess of these nuclei with were taken from the nuclear mass compilations of Audi and Wapstra (Audi et al. 2003). Quenching factor of 0.74 was used as employed in the shell model calculation (Martínez-Pinedo et al. 1996; Langanke et al. 1999) for the pf-shell nuclei. The value is represented by an arrow and it is evident that most of the GT strength structure appears within the Q window of the reaction. A sharp decline in the GT strength can be seen at high excitation energy beyond the Q window in the daughter 46Cr (Fig.2). In this work a total unquenched and quenched strength of 12.45 and 6.82, respectively, was calculated as compared to the corresponding shell model values of 12.89 and 6.98, respectively (Caurier et al. 1998).
For even-even 48Fe, the pn-QRPA extracted an unquenched and quenched total GT strength of 12.62 and 6.91, respectively. This quenched value is close to the quenched total strength of 7.18 reported by (Caurier et al. 1998). The mass-excess of the 48Fe ground state, taken from (Audi et al. 2003), is taken to be (-18160 70) keV.
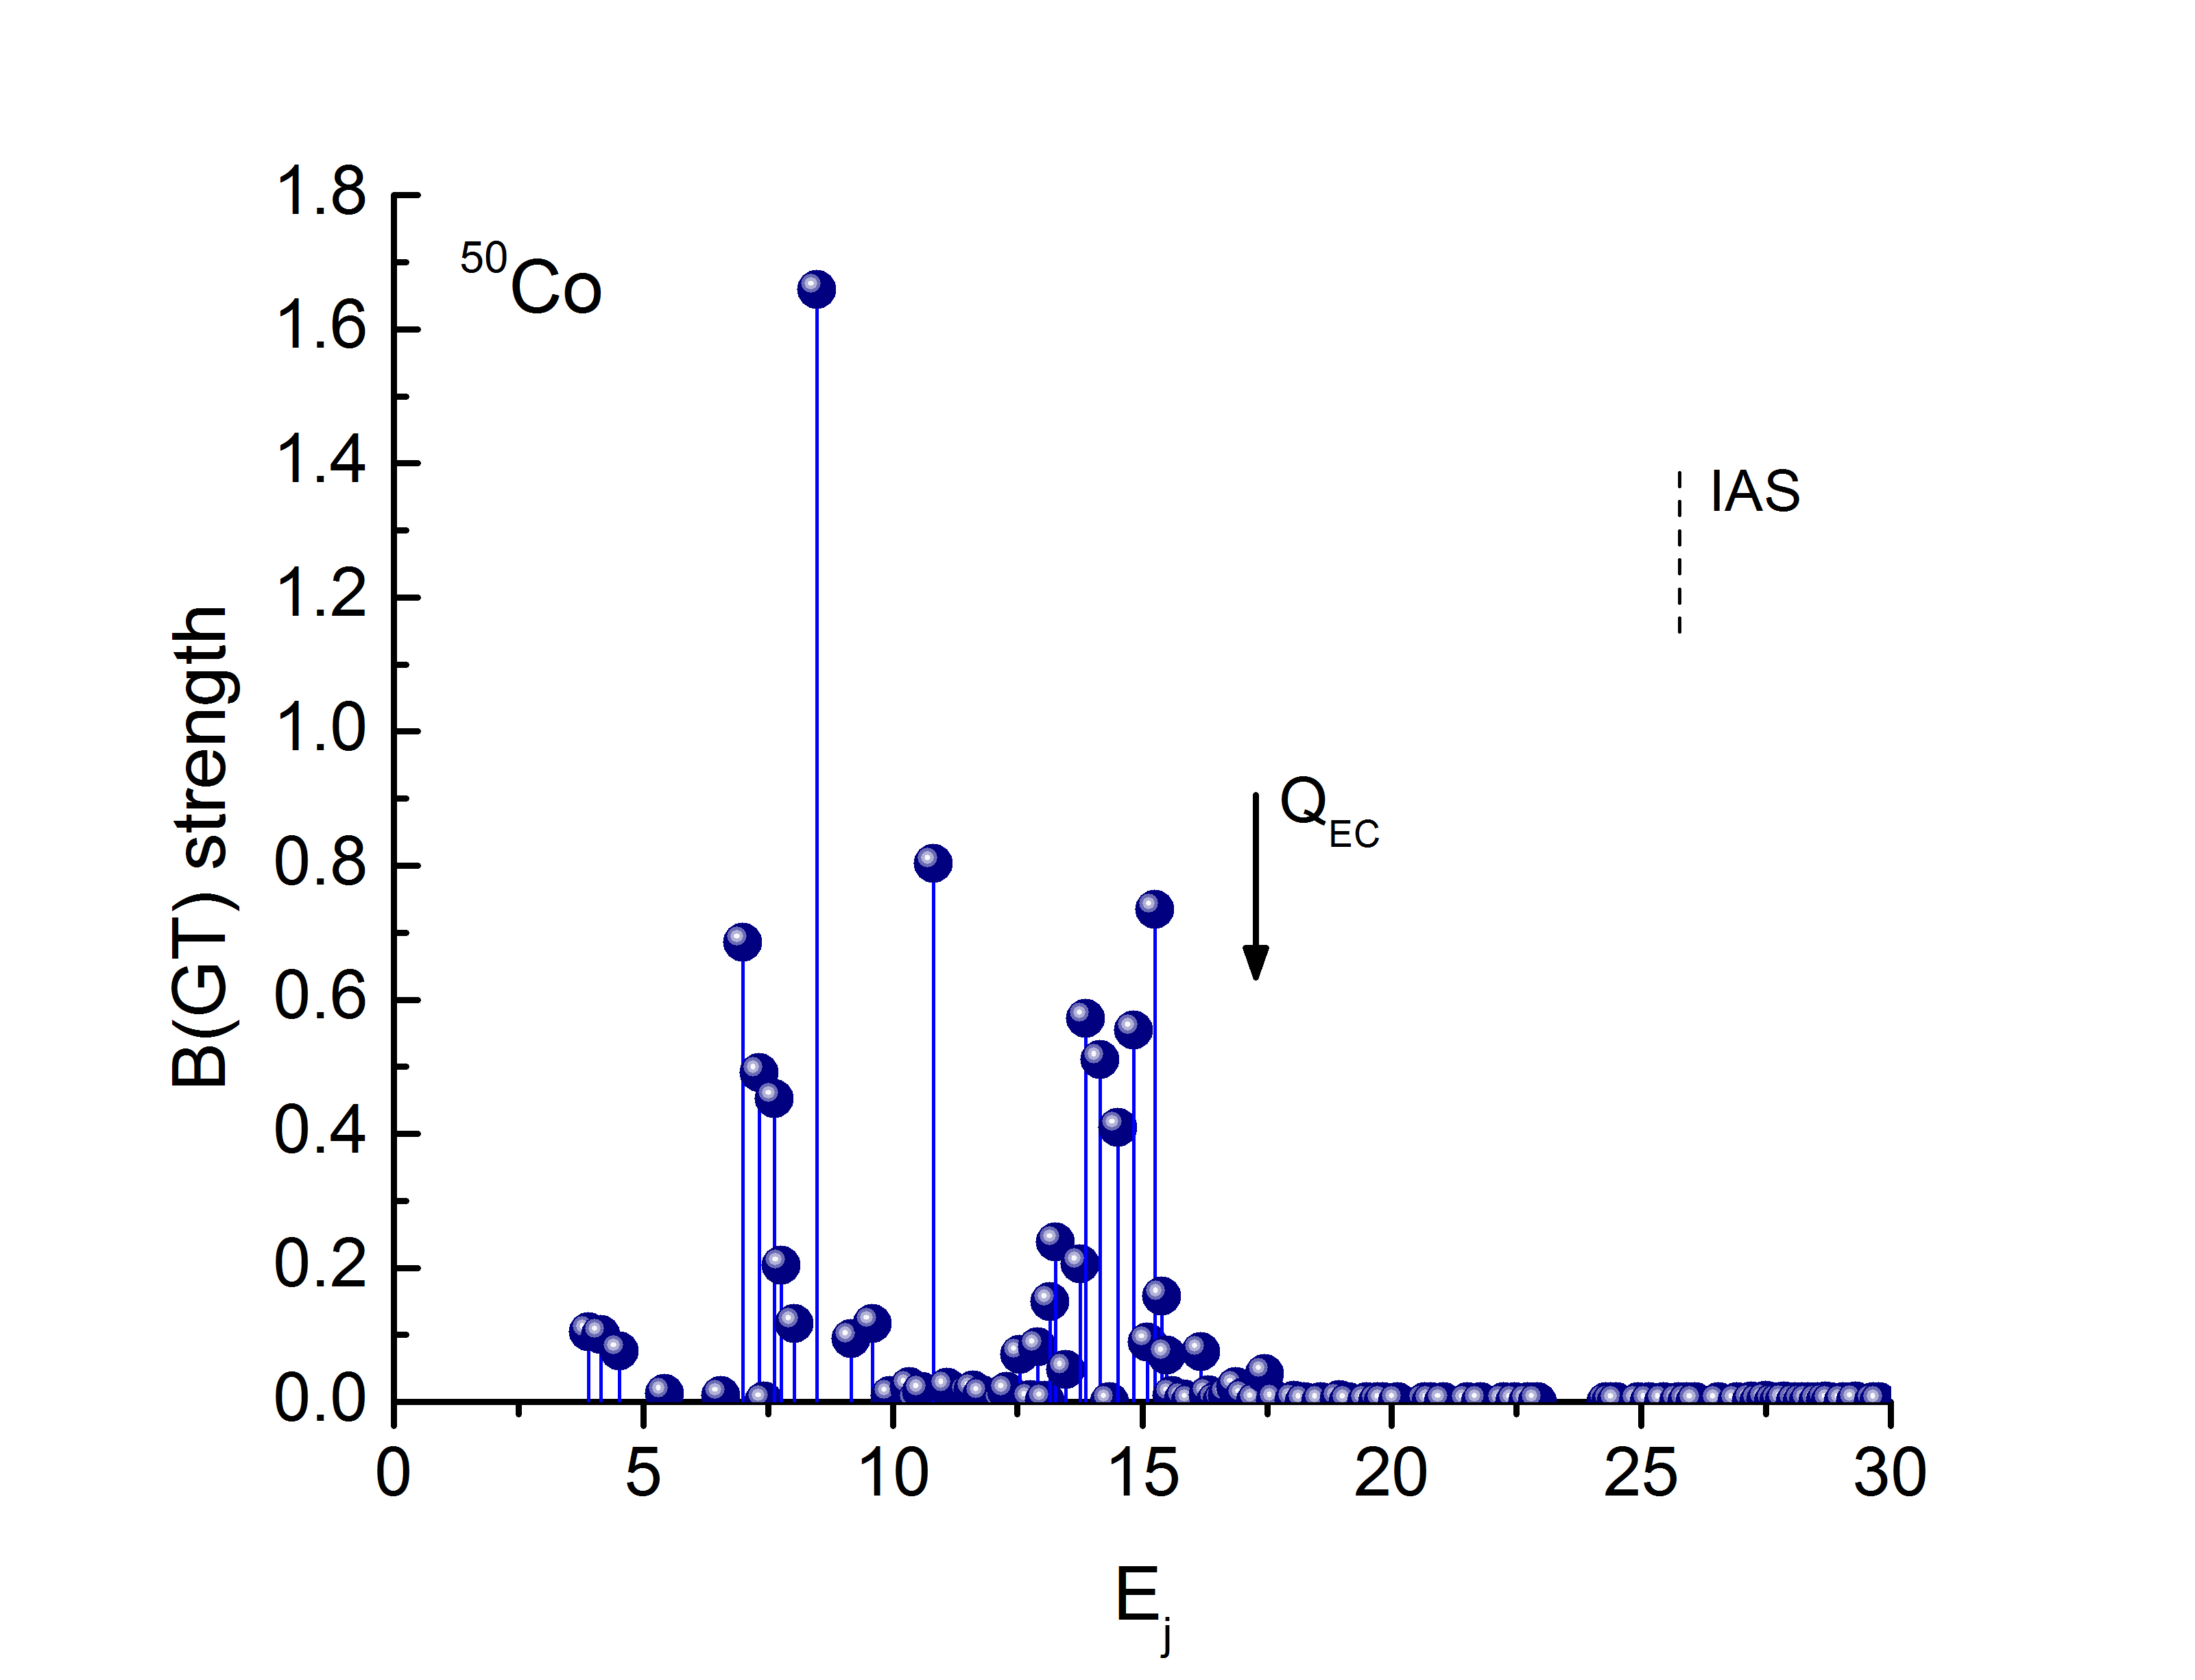
For the odd-odd nucleus 50Co the GT strength (shown in Fig. 3) is fragmented over many states in the daughter 50Fe due to the correlations effect among the nucleons. The over all morphology of the strength is in good agreement with calculated GT strength of (Caurier et al. 1998). They used the KB3 interaction (Wang et al. 1988) to calculate the GT strength and these interactions are modified version of Kuo-Brown interactions. The pn-QRPA extracted more GT strength than calculated by shell model (Caurier et al. 1998). This decrease in their calculated GT strength could be due to the truncated model space used in their calculation. It is noted that bulk of the GT strength is distributed below or very close to the Q window. The total GT strength is very crucial in the high density regions in stellar core where the electrons are degenerate and their Fermi energy grows faster than the corresponding Q value. The pn-QRPA and shell model total unquenched and quenched GT strengths for the proton drip-line nuclei are given in Table 1. These strengths were computed with the additional assumption that the proton that has been converted to a neutron lie within the same major shell. It is noted that the pn-QRPA calculated GT strength is in reasonable agreement with corresponding shell model results. It is further noted that for heavier nuclei the reported strengths are much bigger than shell model results (for reasons mentioned above). The pn-QRPA calculated GT strength is compared with experimental strength wherever available. Due to lack of measurements of the ground state transition, one can use the data for transitions of the mirror nucleus given by (p,n) charge-exchange reactions. It is well known that the GT strength is expected to be same in both isospin direction and the symmetry equation can be used for comparison. The total GT strengths observed in the (p, n) charge-exchange reaction (Wang et al. 1988; Rapaport et al. 1983) for the mirror nuclei 52Cr and 56Fe with are used for comparison in Table 1. It is seen that the pn-QRPA result is in good agreement with the upper limit of the total strength observed in the (p, n) charge-exchange reaction for the case of A = 56. At this point, we reiterate the remarks in (Caurier et al. 1998) about the reliability of the experimental data of these proton rich nuclei. The strong splitting of the strength makes the observation more difficult and thus imposes strict limits for the background in the GT spectrum. The improvement in production rate of these proton rich nuclei can assist in the possible observation of the shape of the main components of the GT distribution by beta decay study.
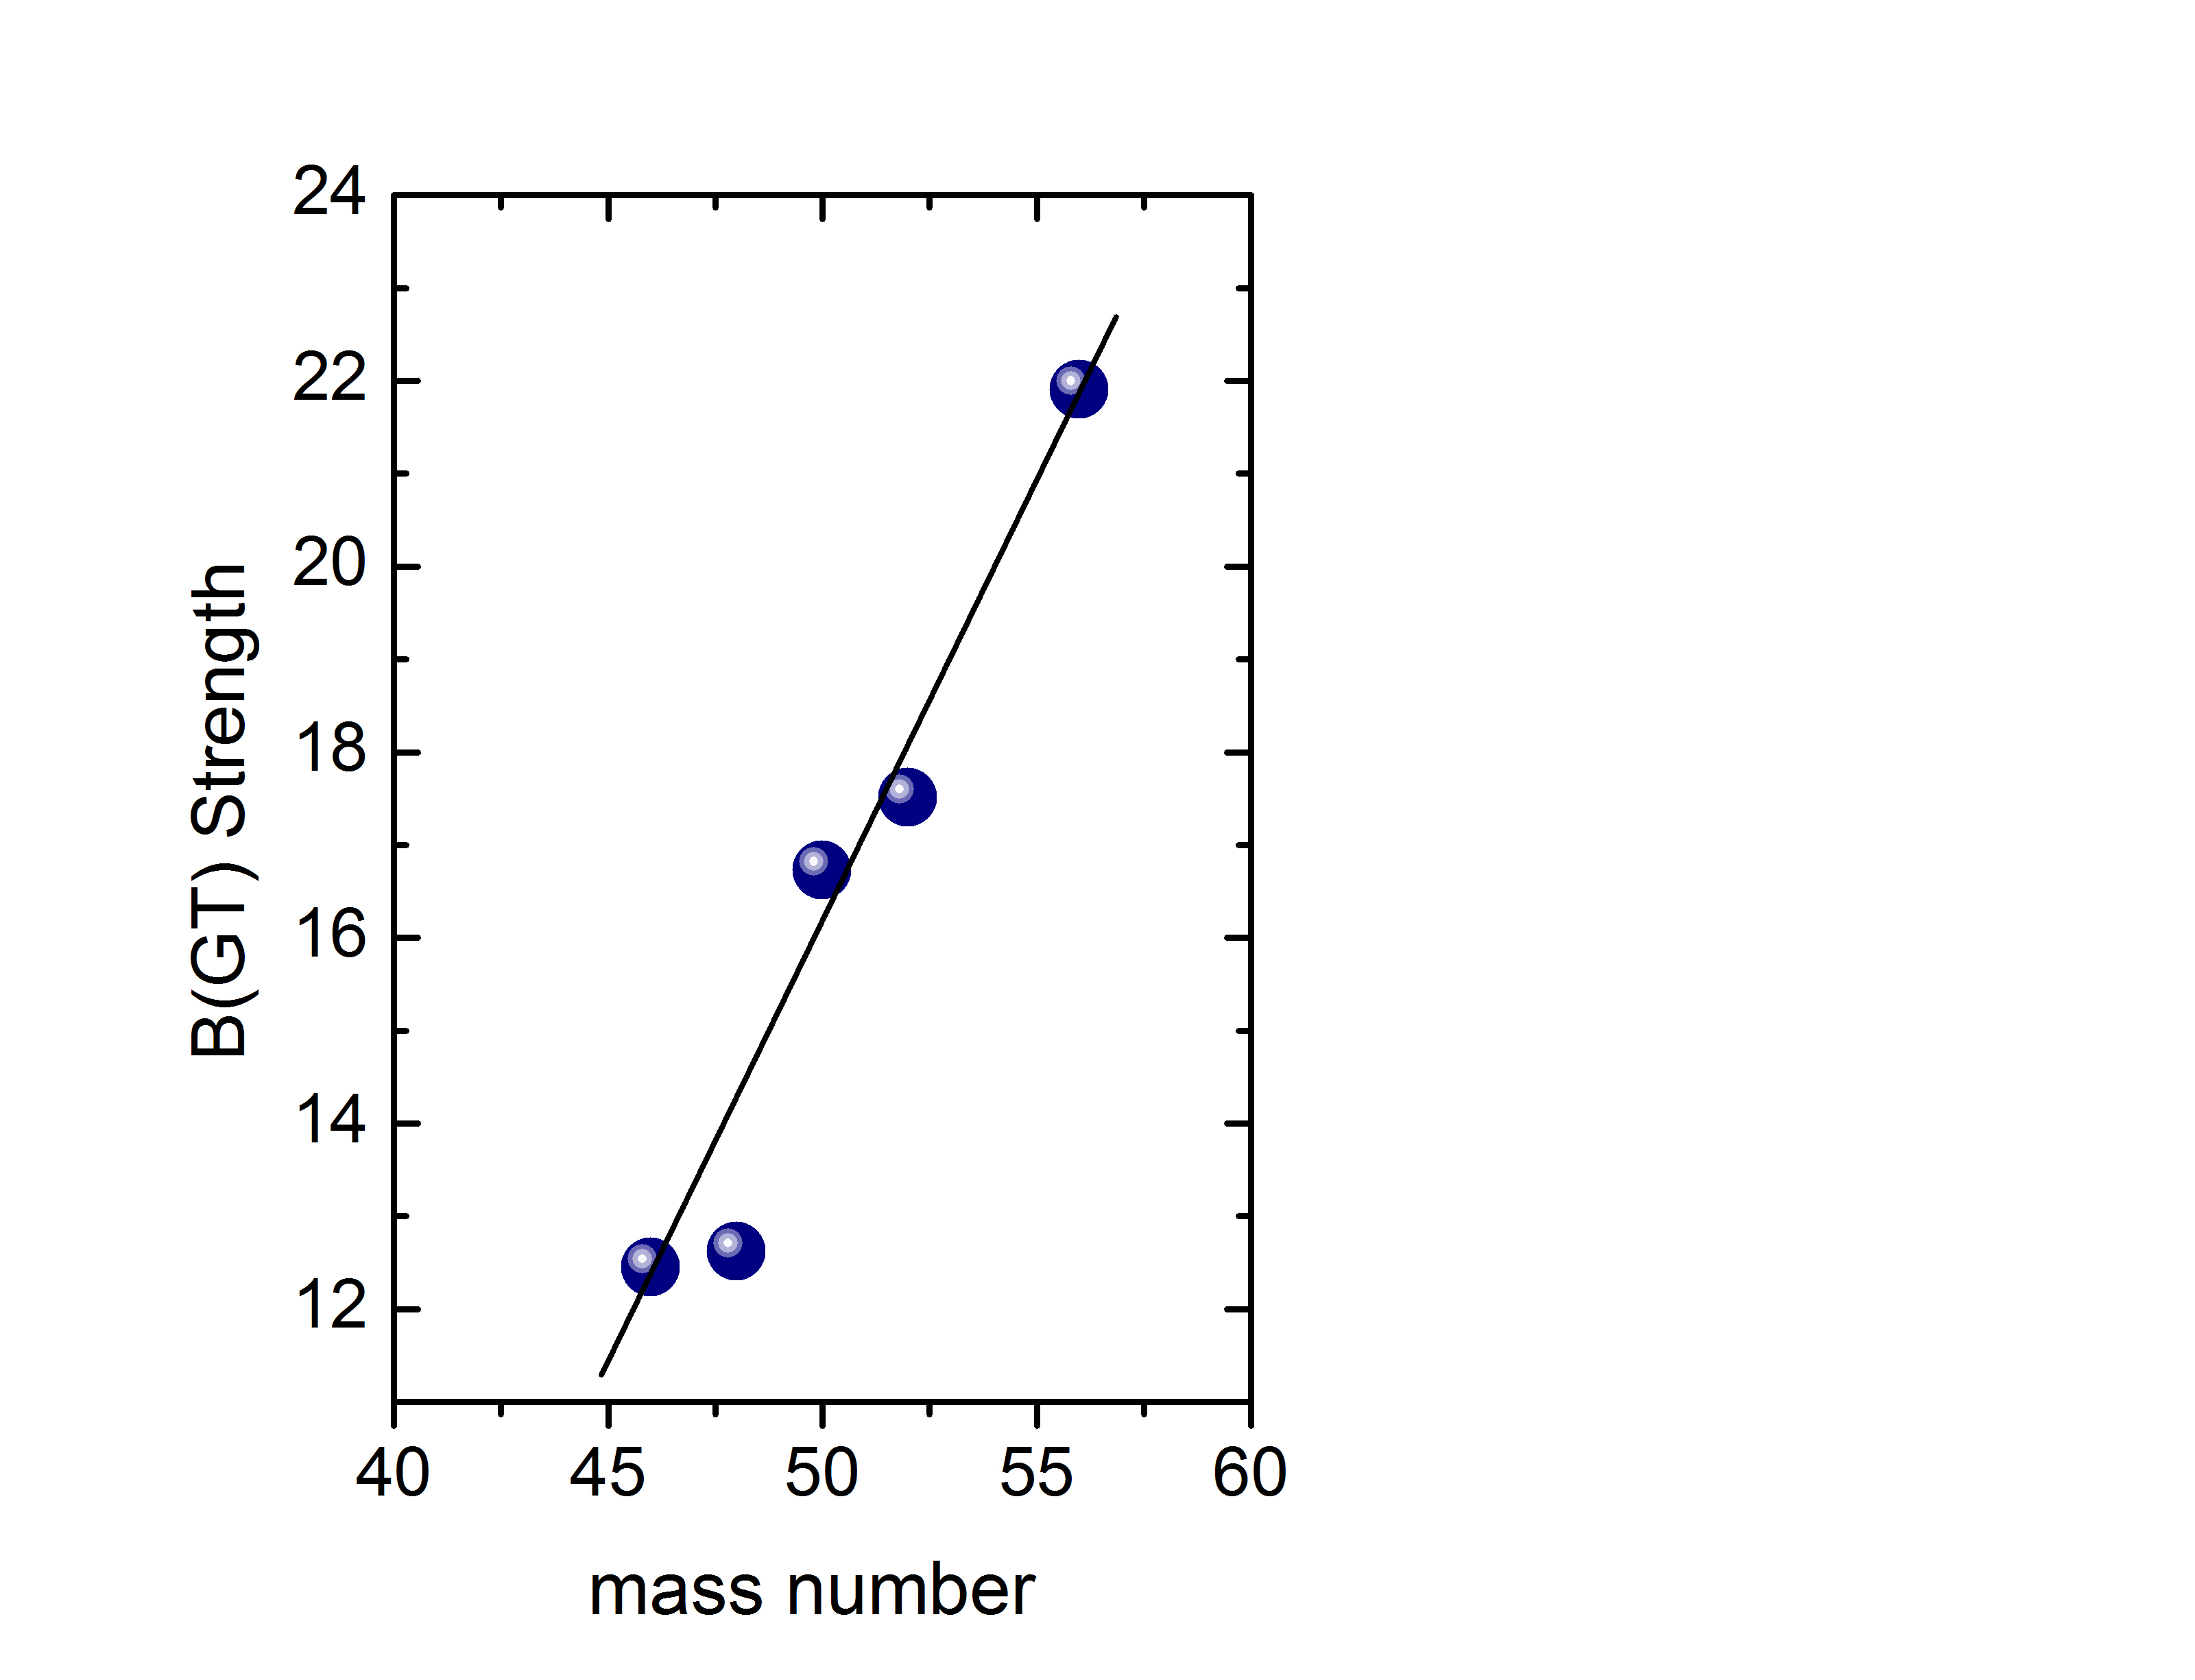
The increase of GT+ strength with mass number is natural as the number of protons increases with the increase of mass number for the selected proton drip-line nuclei. The total strength for these nuclei (with in the mass range ) is plotted as a function of mass number in Fig. 4. It is noted that total strength increases roughly linearly with the increase of proton number. This is attributed to the correlation effects between the nucleons in-built within the QRPA model. The number of protons increases as one moves from 46Mn to 56Zn along the proton drip-line. This results in the enhancement of Coulombic repulsion among the protons and consequently the Fermi surface of the proton’s orbital is pushed up and is close to the continuum.
4 Electron Capture/-Decay Rates for Proton Drip-Line Nuclei
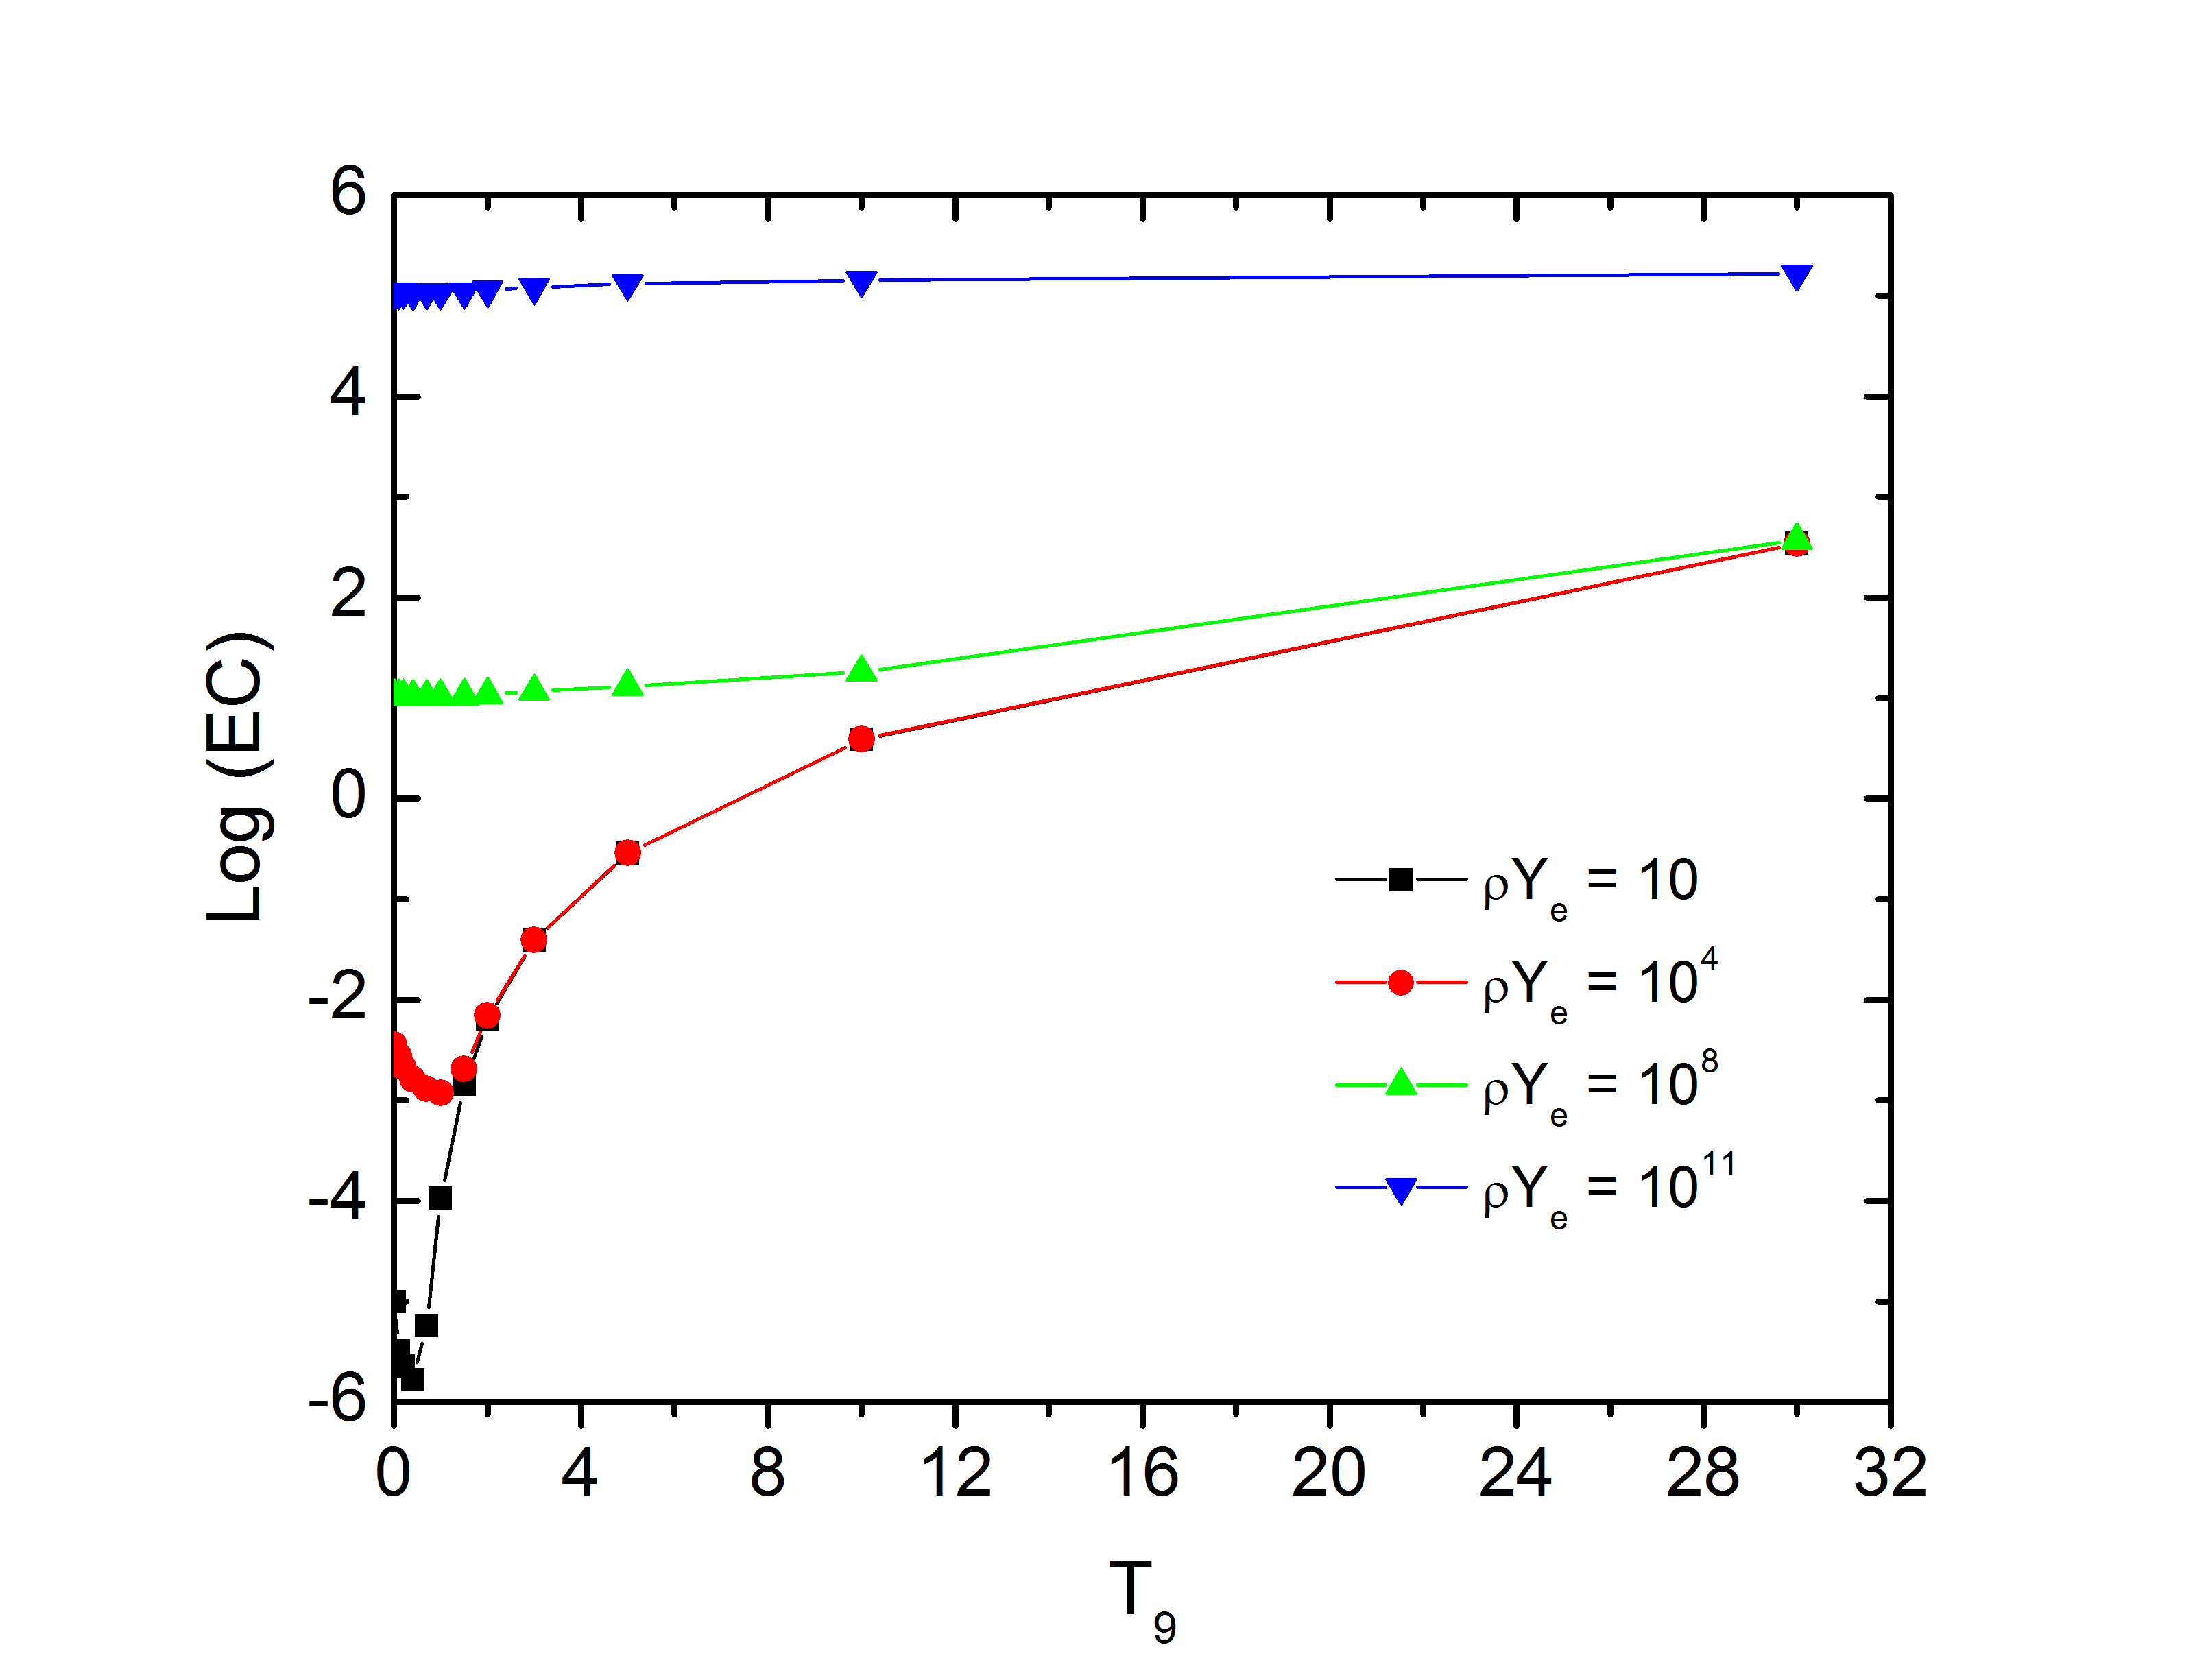
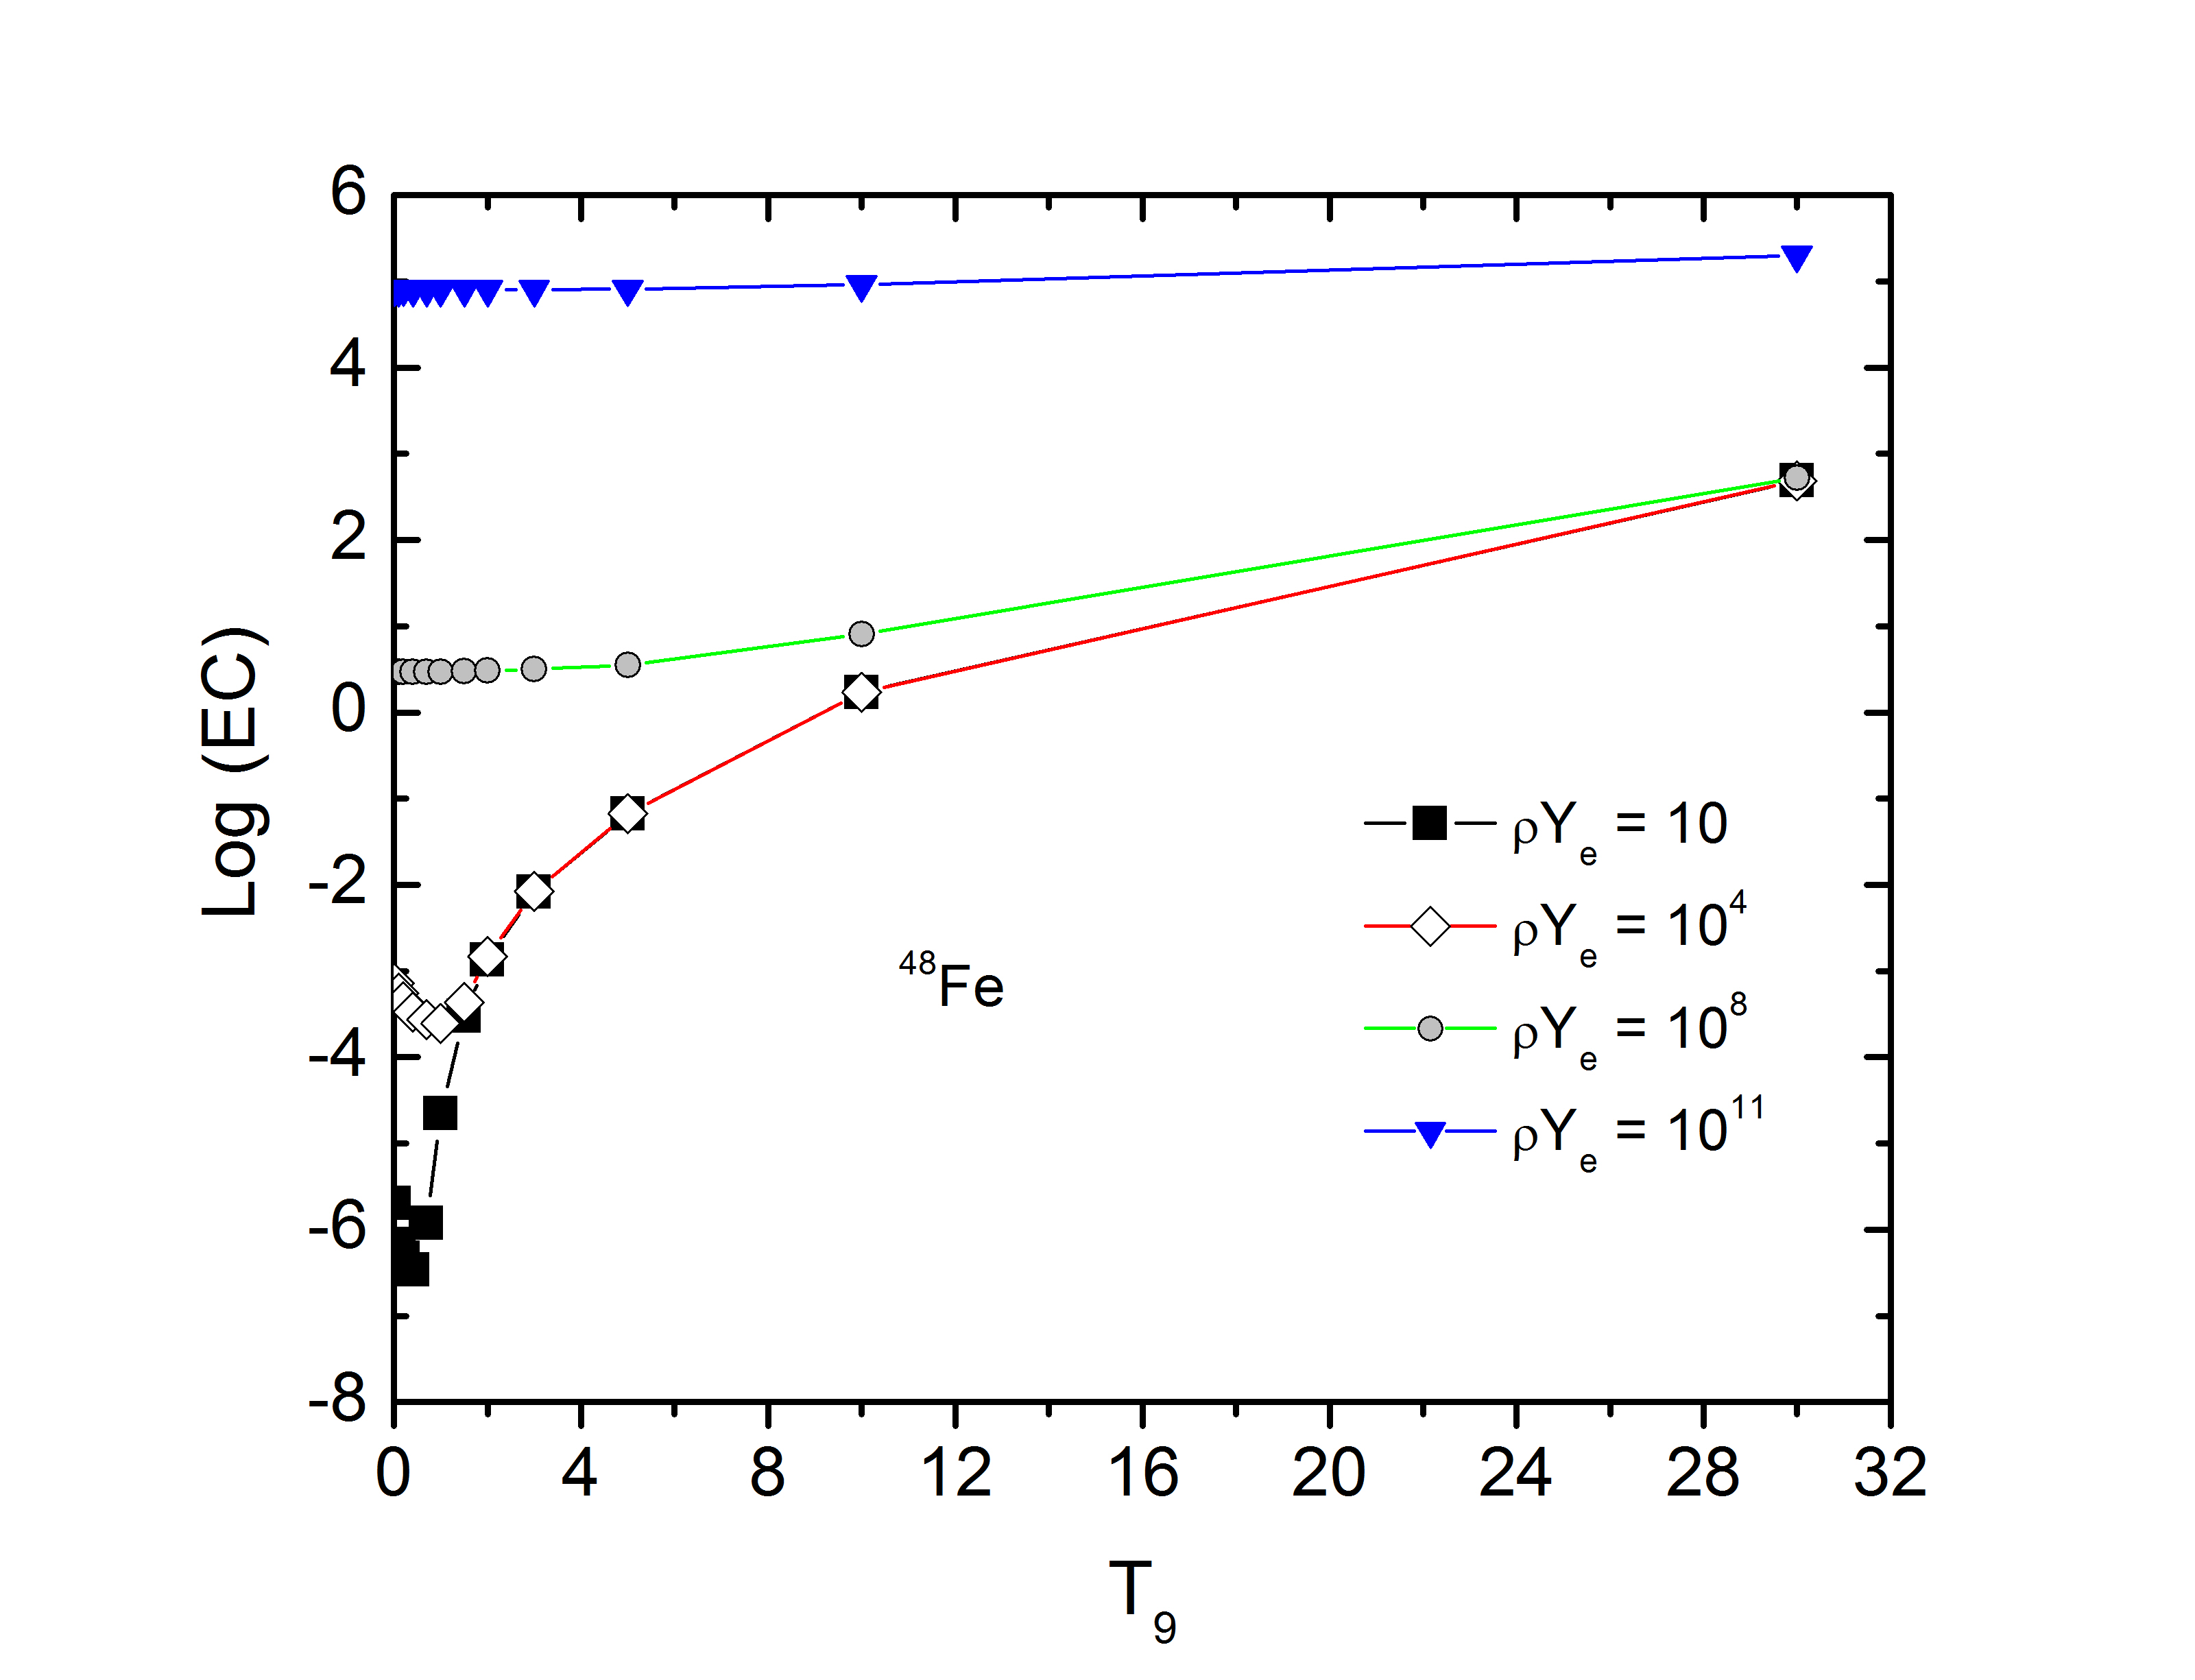
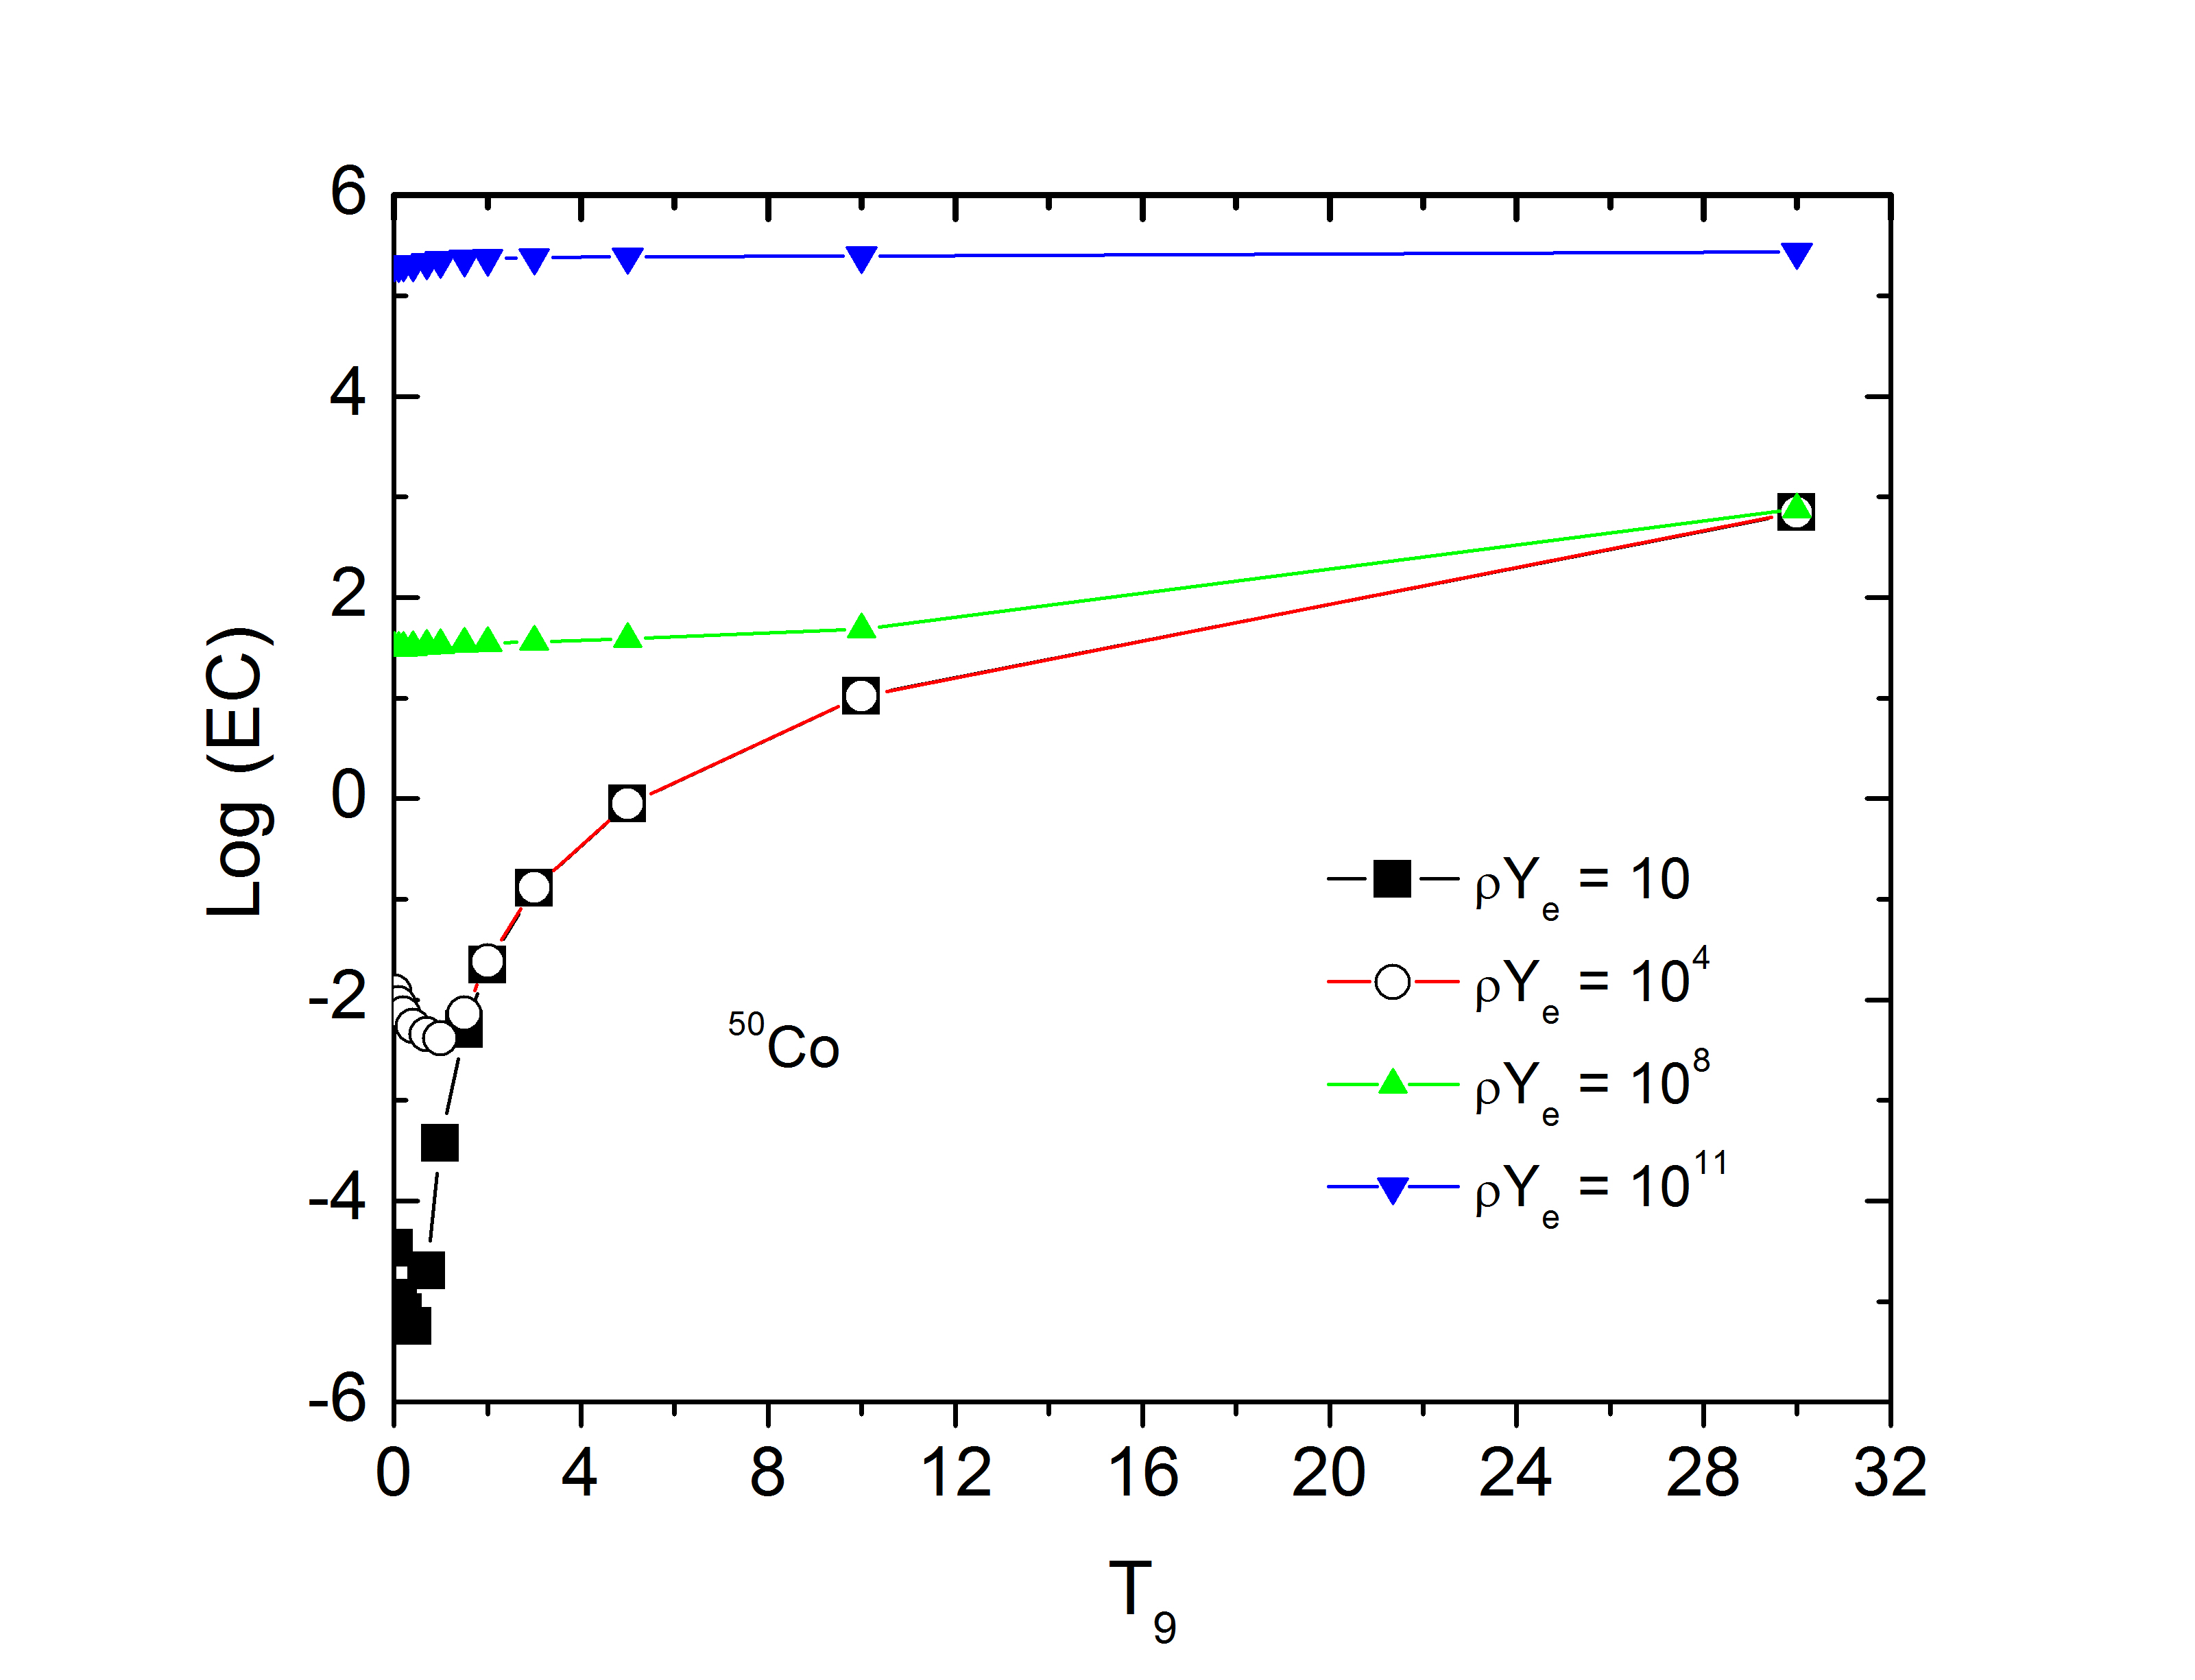
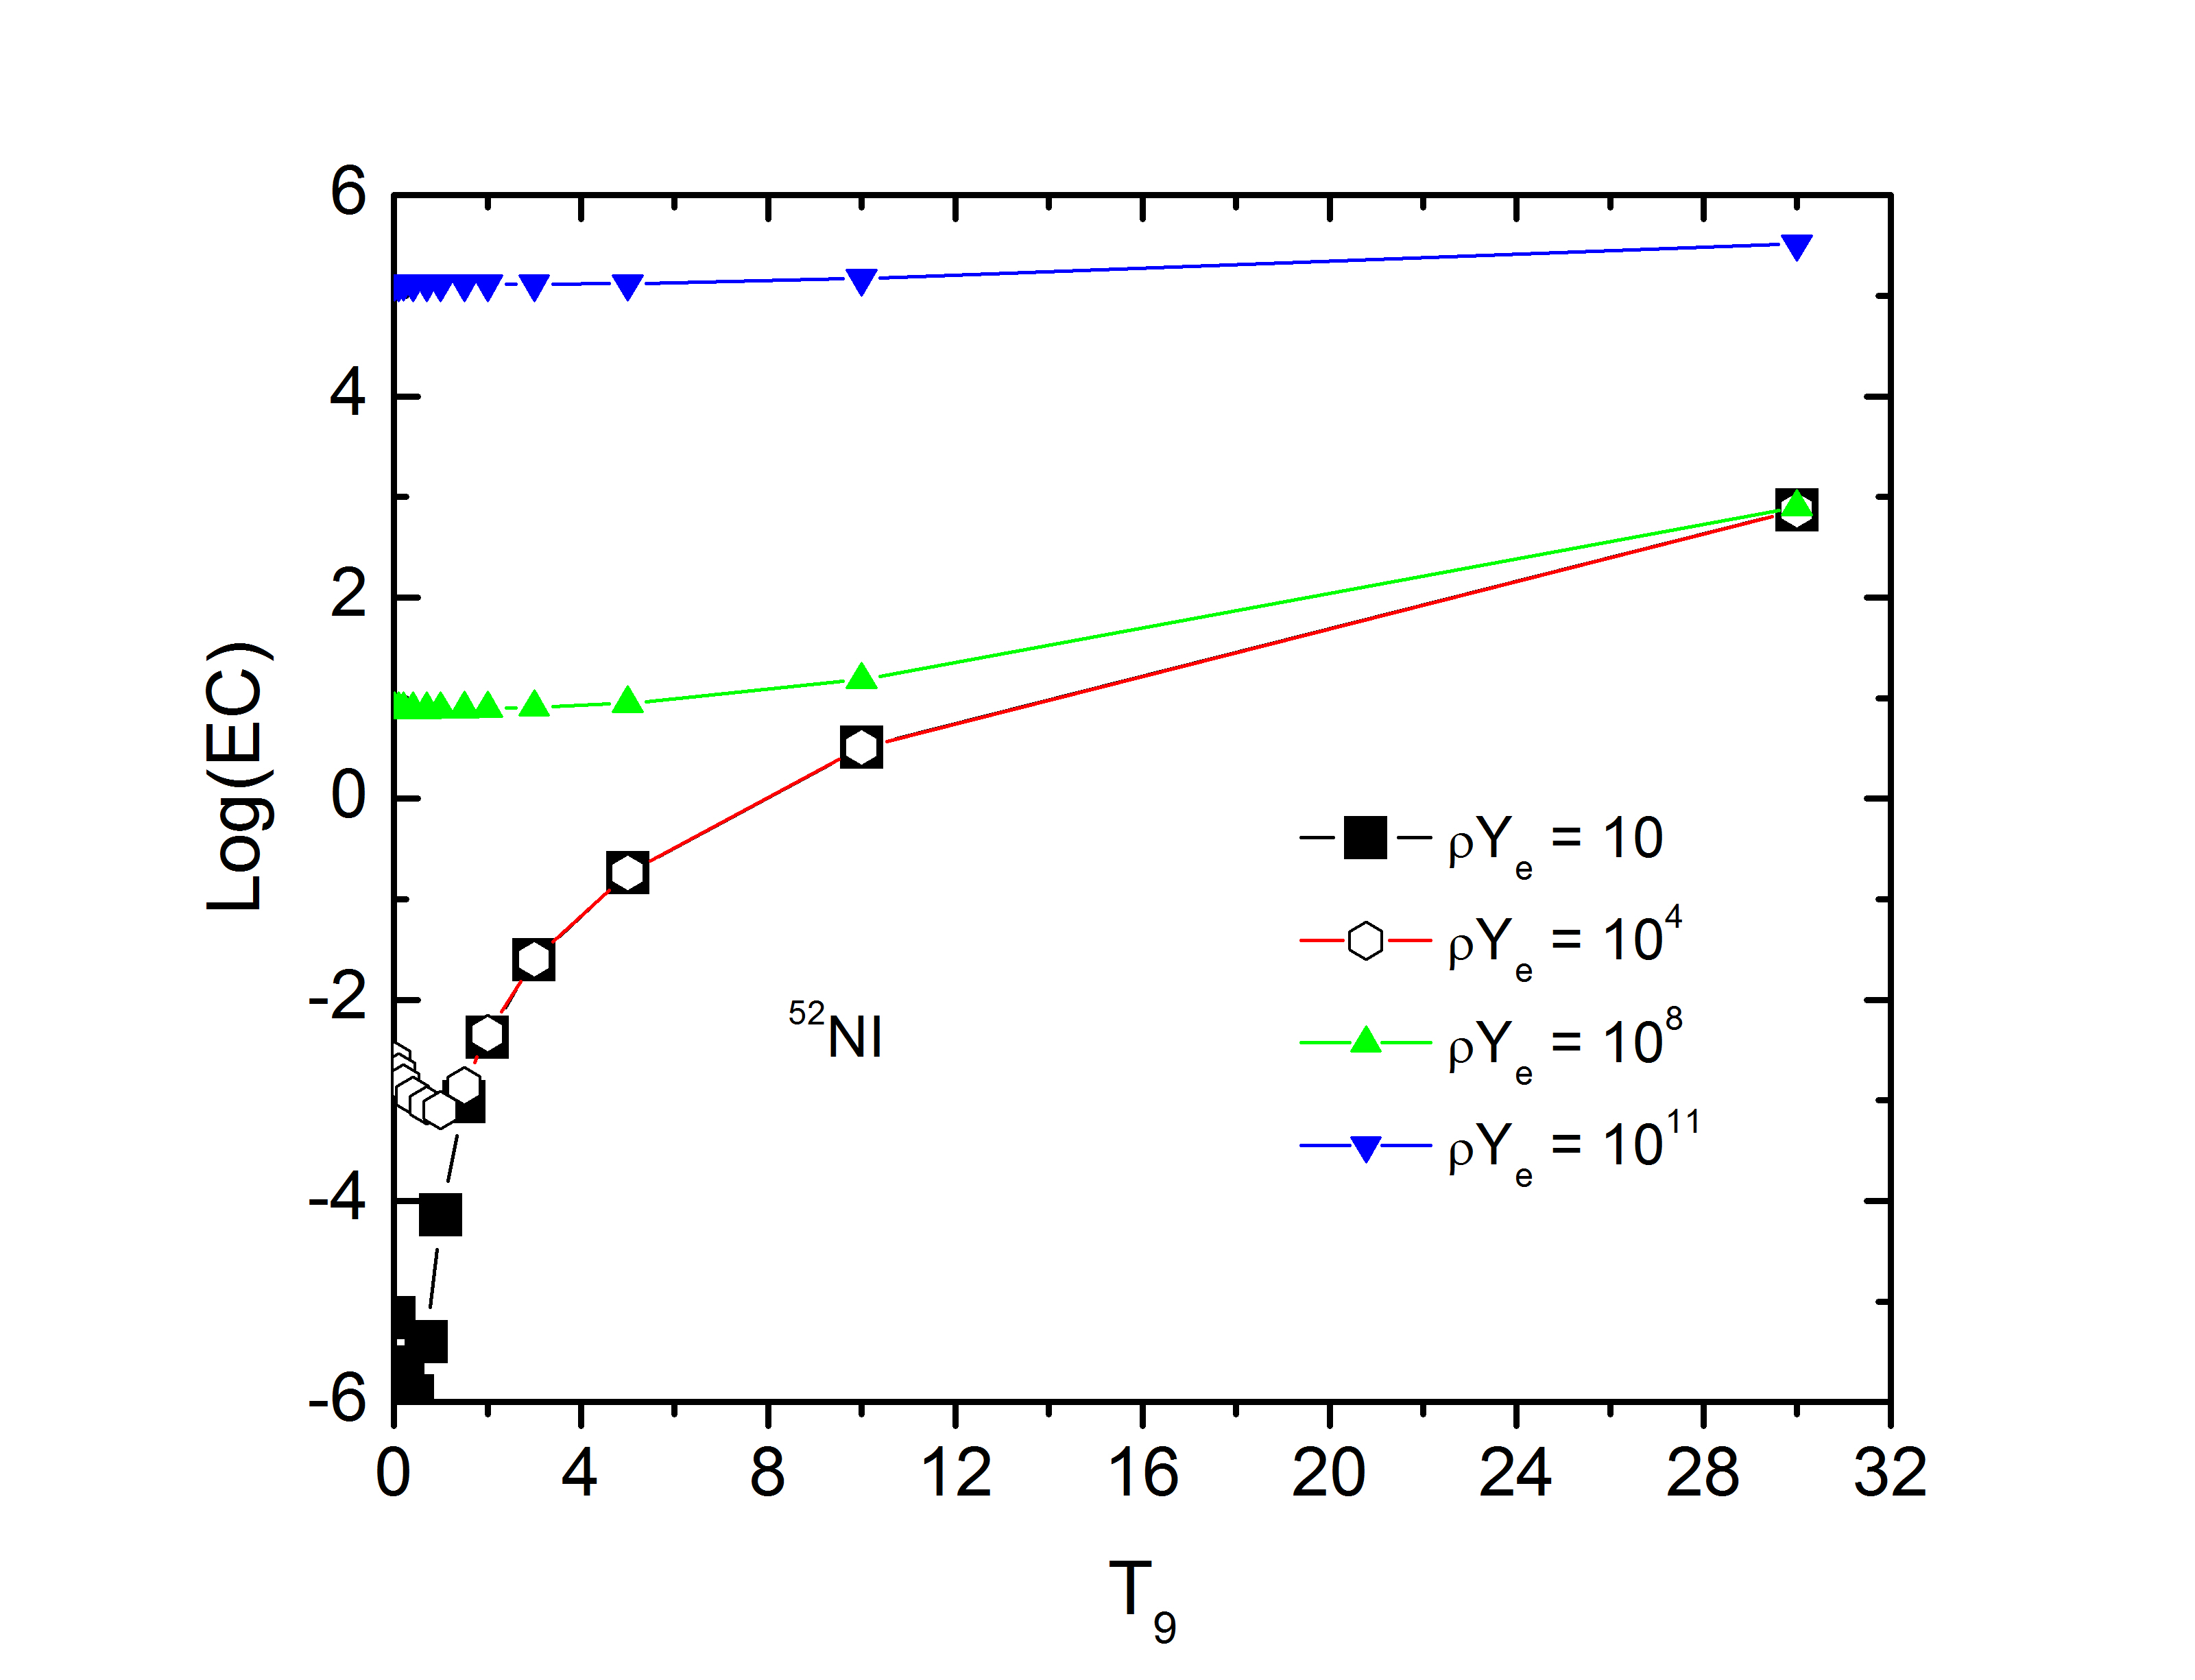
Bethe and coworkers (Bethe et al. 1979) pointed out the importance of GT transitions for electron capture on heavy nuclei in the presupernovae and collapse phases of stellar core. The entropy per baryon in stellar core is very important as it determines the free proton fraction. The proton-rich pf-shell nuclei may be used in the studies of nucleosynthesis and energy generation in X-ray bursts and other rp-process sites (Pruet et al. 2003; Wallace et al. 1981). The authors in (Pruet et al. 2003) argued the need of weak rates on proton-rich nuclei up to mass number 110 for nucleosynthesis in the rp-process.
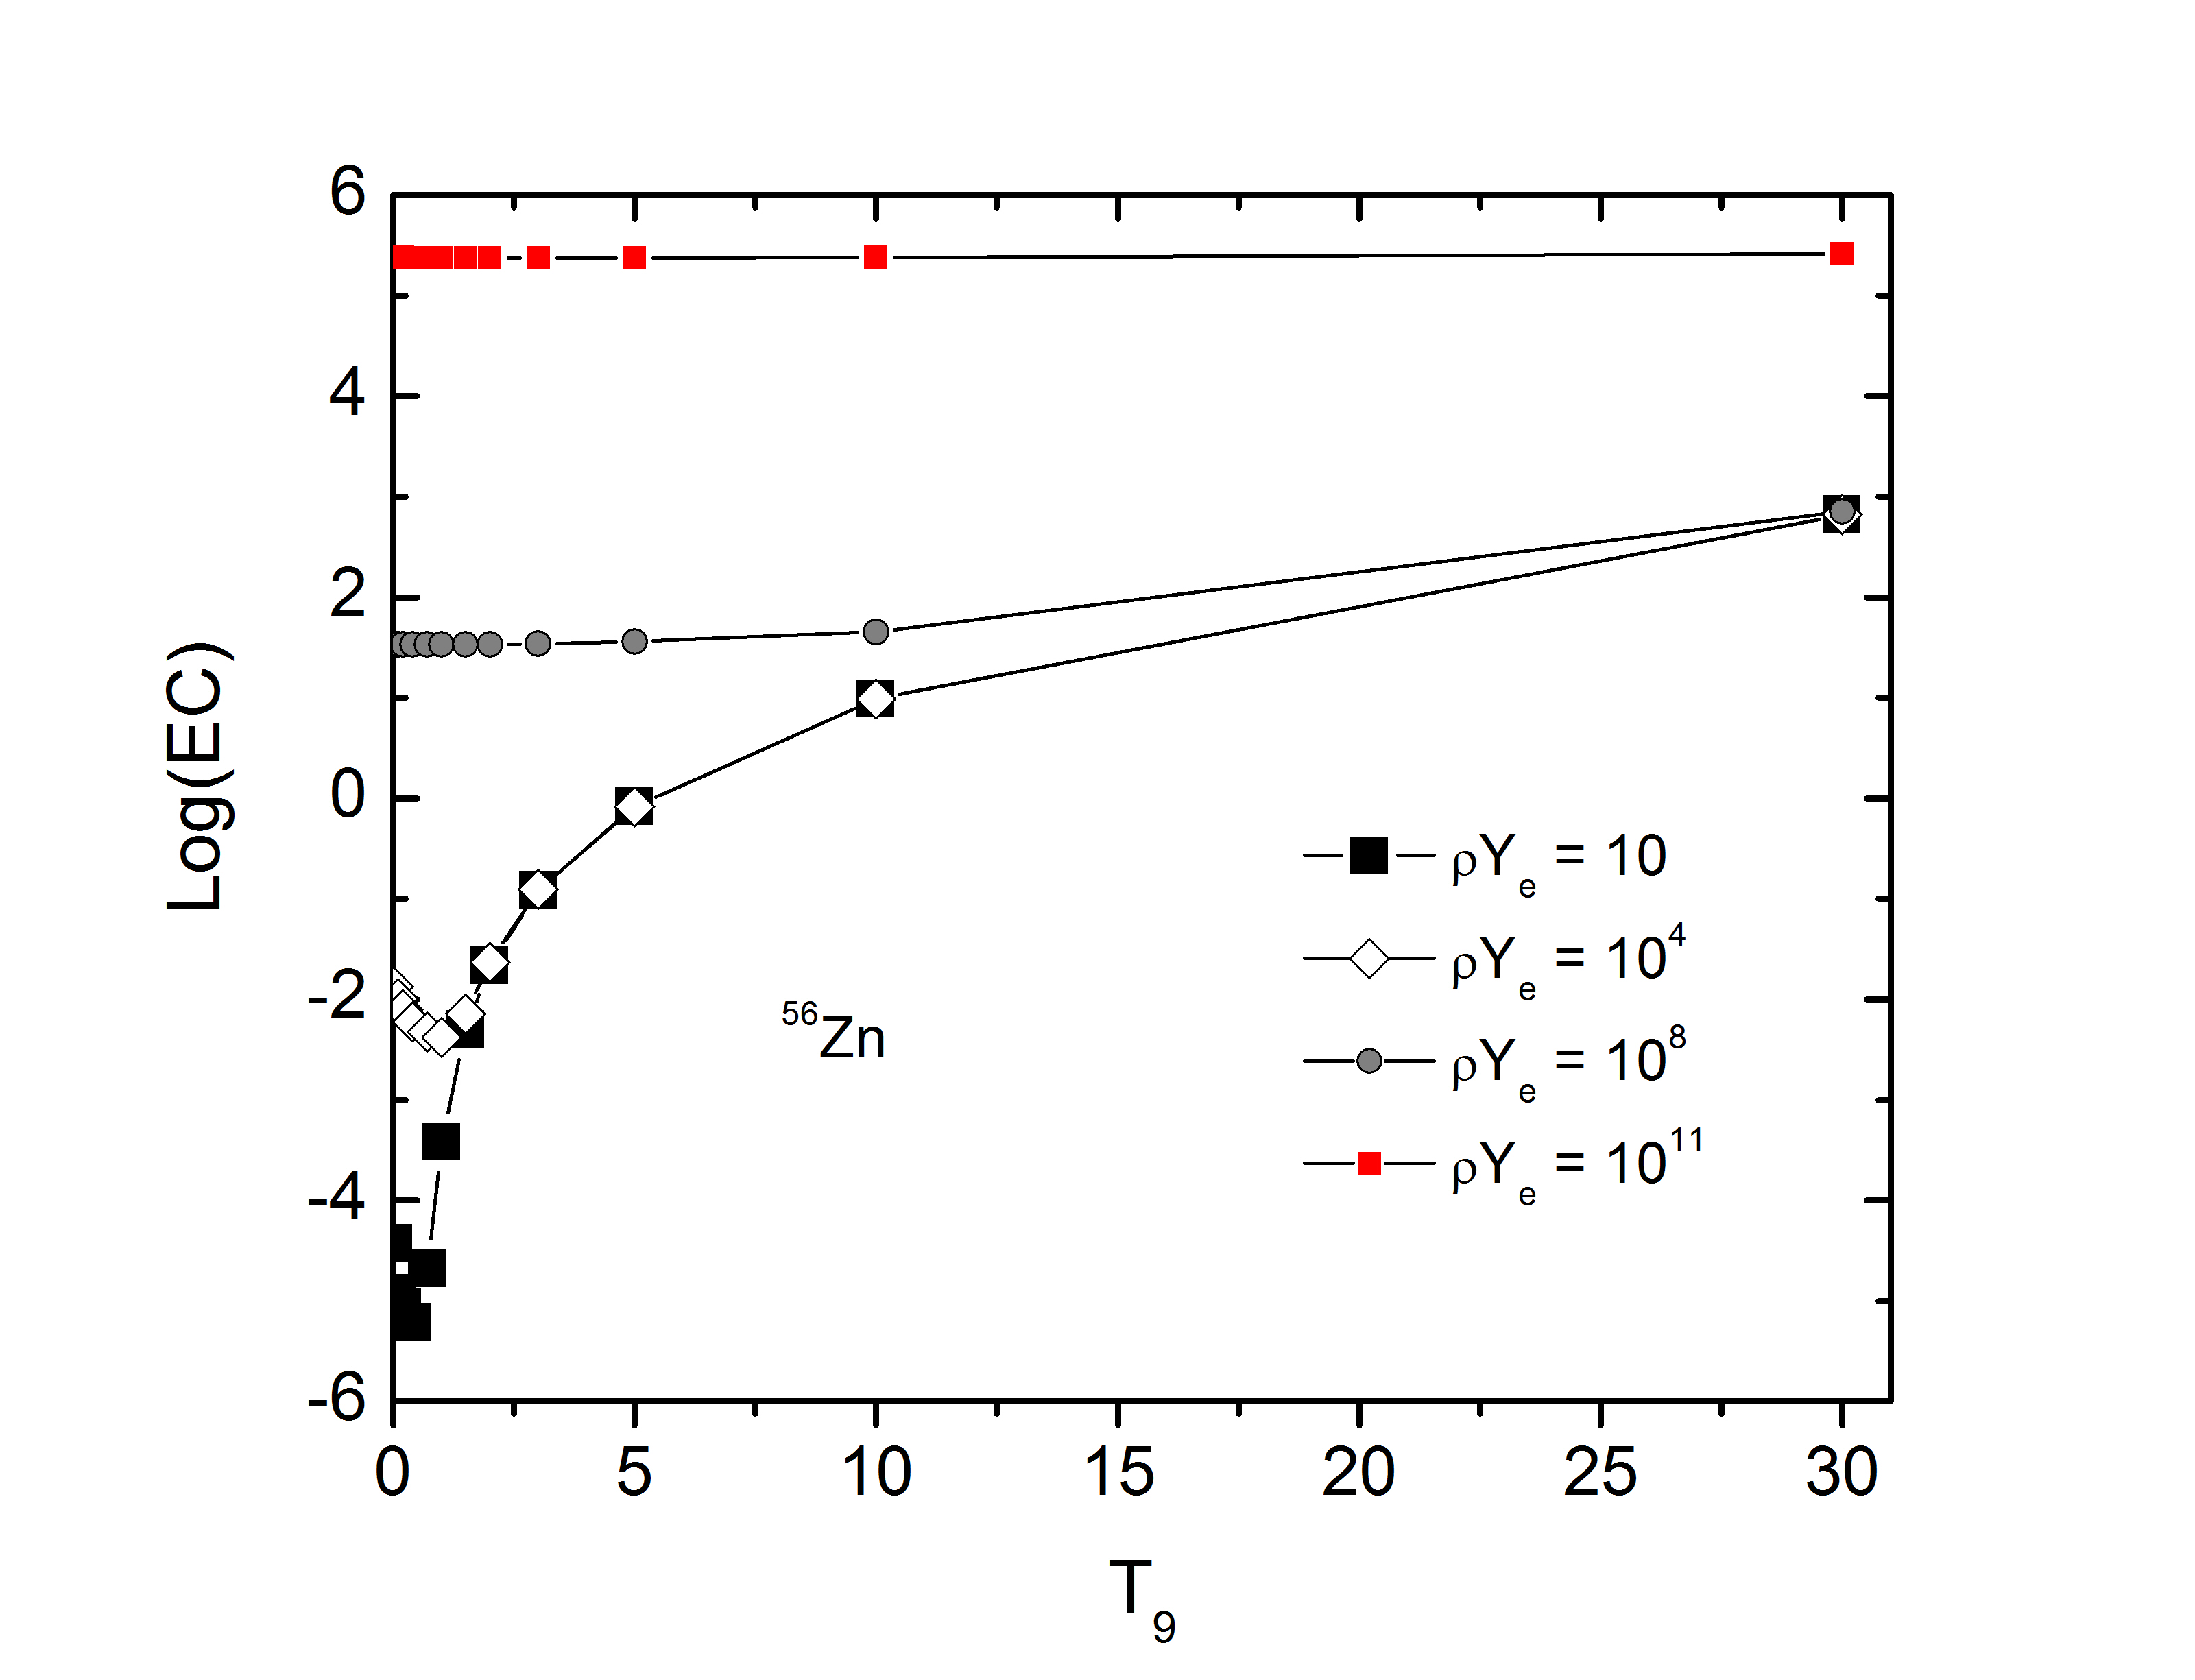
Electron capture rates based on independent particle model led to incorrect conclusions due to the Pauli-blocking of the GT transitions. This Pauli-blocking of the GT transitions is overcome by the correlations effect among the nucleons (Caurier et al. 1999), and temperature effects (Fuller et al. 1980; Cooperstein et al. 1984). This correlation effect is taken into account for calculation of GT transitions in this project. The electron capture and decay rates for proton-rich pf-shell nuclei with in the mass range 46 A 56, at various various densities and temperatures, are given in Tables 2-6. It has been noted that the decay rates dominate the electron capture rates at low temperature and low densities in the stellar interior. However, for densities , the electron capture process dominates even at low temperatures. Stellar electron capture rates for proton-rich pf-shell nuclei 46Mn, 48Fe, 50Co, 52Ni and 56Zn are shown in Figs. 5- 9, respectively. These proton rich nuclei are characterized by their large decay-values of 17.10 MeV, 11.16 MeV, 17.28 MeV, 11.27 MeV, and 12.87 MeV, respectively. On the other hand nuclei, closer to the valley of stability, have usually smaller decay-values. The electron capture rates for all five cases (Figs. 5- 9) follow a more or less similar behavior which we explain below. It is evident from discussion on GT strength in previous section that a fair proportion of the GT strength lies at the upper end of the Q-value window. This impedes the electron capture rates in the low temperature and density regions of the stellar core. As the temperature of the stellar matter increases in low density regions the participant nucleon will get a fair chance of occupying higher energy levels and in turn assists the electron captures on the nucleon. For densities , the stellar weak rates are dominated by Fermi (applicable to beta decay only) and GT transitions. There are two quantities that drive the electron capture rates: the chemical potential of the electrons and the nuclear Q-value. Chemical potential grows like (Nabi and Rahman 2005) and this growth of the chemical potential is much faster than the Q-value of the nuclei in the stellar core. Thus, the impedance posed by large Q-values of the reactions for these nuclei is overcome by the fast growth of the chemical potential of the electrons and consequently led to the enhancement of the electron capture rates. At low densities, where the chemical potential approximately equals nuclear Q-value, the capture rates are very sensitive to the available phase space and detailed description of the GT strength distribution is then desirable. It is noted that in the low density region the beta decays compete with the electron capture rates. These beta decays during and after silicon shell burning increase the value of in the stellar core and cool the core efficiently as against competing electron capture rates. The sensitivity to the phase space and details of the GT strength distribution is less important as a result of fast growth in chemical potential at high densities. The capture rates are no more dependent on the details of GT strength distribution. They rather depend on the total GT strength. In this scenario crude nuclear models might also be able to give an estimate of the stellar capture rates.
The experimentally measured and calculated half-lives for proton-rich pf-shell nuclei with in the mass range 46 A 56 are mutually compared in Table 7. The pn-QRPA results are also compared with the results of the gross theory of beta decay of (Tachibana et al. 1988) and (Möller et al. 1997). In addition our calculated half-lives are also compared with the shell model calculation (Caurier et al. 1998). The results of the pn-QRPA, for cases of 50Co and 56Zn, are in good agreement with the shell model results and deviations are found for the rest of the cases.
5 Discussion and Conclusions
Recent advancements in the accelerator driven technology has led to noticeable improvement in nuclear inputs for core-collapse supernova models. It has been noted that the collapse phase is dominated by electron capture rates on nuclei rather than on free protons. The GT+ strength and associated electron capture/-decay rates were calculated within the domain of the pn-QRPA model. These weak interaction mediated rates are key nuclear physics input to simulation codes and a reliable and microscopic calculation of these rates from ground-state and excited states is desirable. The transitions in GT+ direction and associated electron capture/-decay rates for pf-shell nuclei are important from astrophysical point of view because these nuclei are key input in the modeling of the explosion dynamics of massive stars. Our calculation shows that -decay rates dominate electron capture rates at low stellar temperatures and densities.
The pn-QRPA theory with improved model parameters was used to calculate weak-interaction mediated rates for the proton drip-line nuclei. These calculations were carried out in a luxurious model space of 7. The pn-QRPA calculated half-lives of 50Co and 56Zn are in reasonable agreement with shell model calculation but differ in other cases. The GT strength distribution is important for the description of the electron capture/ rates related to pre-supernova and supernova conditions. The pn-QRPA’s total unquenched and quenched GT strength for proton drip-line nuclei are compared with shell model values and with the available experimental data. The pn-QRPA calculated GT strengths are in reasonable agreement with the shell model and experimental data. This may affect the evolution timescale and dynamics of collapsing supermassive stars as the capture rates are dependent on the total GT strength in the high temperature and density regions in stellar interior. It has been found that total GT strength increases linearly with increase of proton numbers as expected. The electron capture/-decay rates for these proton drip-line nuclei, for density and temperature scale relevant to astrophysical scenario, may be requested from the authors as ASCII files. Core-collapse simulators are encouraged to employ these rates in simulation codes to check for possible interesting outcomes.
References
- Anderson et al. (1990) Anderson, B.D., Lebo, C., Baldwin, A.R., Chittrakarn, T., Mandey, R., Watson, J.W. 1990, Phys. Rev. C, 41, 1474
- Aufderheide et al. (1996) Aufderheide, M.B., Bloom, S.D., Mathews, G.J., Resler, D.A. 1996, Phys. Rev. C, 53(6), 3139-3142
- (3) Audi, G., Wapstra, A.H., Thibault, C. 2003, Nucl. Phys. A, 729, 337
- (4) Audi, G., Bersillon, O., Blachot, J., Wapstra, A.H. 2003, Nucl. Phys. A, 729, 3-128
- Bethe et al. (1979) Bethe, H.A., Brown, G.E., Applegate, J., Lattimer, J. 1979, Nucl. Phys. A, 324, 487
- Bethe (1990) Bethe, H.A. 1990, Rev. Mod. Phys., 62, No. 4, 801-866
- Borrel et al. (1992) Borrel, V., Anne, R., Bazin, D., Borcea, C. Chubarian, G. G., Del Moral, R., D traz, C., Dogny, S., Dufour, J.P., Faux, L., Fleury, A., Fifield, L.K., Guillemaud-Mueller, D., Hubert, F., Kashy, E., Lewitowicz, M., Marchand, C., Mueller, A.C., Pougheon, F., Pravikoff, M.S., Saint-Laurent, M.G., Sorlin, O. 1992, Z. Phys. A - Hadrons and Nuclei, 344, 135
- cole et al. (2012) Cole, A.L., Anderson, T.S., Zegers, R.G.T., Austin, Sam M., Brown, B.A., Valdez, L., Gupta, S., Hitt, G.W., Fawwaz, O. 2012, Phys. Rev. C, 86, 015809
- Cooperstein et al. (1984) Cooperstein, J., Wambach, J. 1984, Nucl. Phys. A, 420, 591-620
- Caurier et al (1998) Caurier, E., Didierjean, F., Nowacki, F., Walter, G. 1998, Phys. Rev. C, 57, 2316
- Caurier et al. (1999) Caurier, E., Langanke, K., Martínez-Pinedo, G., Nowacki, F. 1999, Nucl. Phys. A, 653, 439-452
- Dossat et al. (2007) Dossat, C., Blank, B. et al. 2007, Nucl. Phys. A, 792, 18
- El-Kateb et al. (1994) El-Kateb, S., Jackson, K.P., Alford, W.P., Abegg, R., Azuma, R.E., Brown, B.A., Celler, A., Frekers, D., H usser, O., Helmer, R., Henderson, R.S., Hicks, K.H., Jeppesen, R., King, J.D., Shute, G.G., Spicer, B.M., Trudel, A., Raywood, K., Vetterli, M., Yen, S. 1994, Phys. Rev. C, 49, 3129
- Faux et al. (1994) Faux, L., et al., 1994, Phys. Rev. C 49, 2440
- Faux et al. (1996) Faux, L., et al., 1996, Nucl. Phys. A 602, 167
- Fuller et al. (1980) Fuller, G.M., Fowler, W.A., Newman, M.J. 1980, Astrophys. J. Suppl. Ser., 42, 447 (1980).
- (17) Fuller, G.M., Fowler, W.A., Newman, M.J. 1982a, Astrophys. J. Suppl. Ser., 48 279
- (18) Fuller, G.M., Fowler, W.A., Newman, M.J. 1982b, Astrophys. J., 252, 715
- Fuller et al. (1985) Fuller, G.M., Fowler, W.A., Newman, M.J. 1985, Astrophys. J., 293, 1-16
- Gove et al. (1971) Gove, N.B., Martin, M.J. 1971, Nucl. Data Tables, 10, 205
- Hirsch et al. (1993) Hirsch, M., Staudt, A., Muto, K., Klapdor-Kleingrothaus, H.V. 1993, At. Data Nucl. Data Tables, 53, 165
- Heger et al. (2001) Heger, A., Woosley, S.E., Martínez-Pinedo, G., Langanke, K. 2001, The Astrophysical Journal, 560, 307-325
- Jokinen et al. (2002) Jokinen, A., Nieminen, A., yst , J., Borcea, R., Caurier, E., Dendooven, P., Gierlik, M., G rska, M., Grawe, H., Hellstr m, M., Karny, M., Janas, Z., Kirchner, R., La Commara, M., Martínez-Pinedo, G., Mayet, P., Penttil , H., Plochocki, A., Rejmund, M., Roeckl, E., Sawicka, M., Schlegel, C., Schmidt, K., Schwengner, R. 2002, Euro. Phys. J. Direct A 3, 1
- Juodagalvis et al. (2010) Juodagalvis, A., Langanke, K., Hix, W.R., Martínez-Pinedo, G., Sampaio, J.M. 2010, Nucl. Phys. A, 848, 454-478
- Liu (2013) Jin-Jing Liu 2013, Mon. Not. R. Astron. Soc., 433, 1108-1113
- Kar et al. (1994) Kar, K., Ray, A., Sarkar, S. 1994, The Astrophysical Journal, 434, 662-683
- Langanke et al. (1998) Langanke, K., Martínez-Pinedo, G. 1998, Phys. Lett. B, 436, 19
- Langanke (1999) Langanke, K., Martínez-Pinedo, G. 1999, Phys. Lett. B, 453, 187
- Möller et al. (1981) Möller P., Nix J.R. 1981, At. Data Nucl. Data Tables, 26, 165
- Möller et al. (1997) Möller, P., Nix, J.R., Kratz, K.-L. 1997, At. Nucl. Data Tables, 66, 131
- Muto et al. (1992) Muto, K., Bender, E., Oda, T., Klapdor-Kleingrothaus, H. V. 1992, Z. Phys. A, 341, 407
- Martínez-Pinedo et al. (1996) Martínez-Pinedo, G., Poves, A., Caurier, E., Zuker, A.P. 1996, Phys. Rev. C, 53, 2602-2605
- Nilsson (1955) Nilsson, S.G. 1955, Mat. Fys. Medd. Dan. Vid. Selsk, 29, 16
- (34) Nabi J.-Un, Klapdor-Kleingrothaus H.V. 1999a, Eur. Phys. J. A, 5, 337
- Nabi et al. (2004) Nabi J.-Un, Klapdor-Kleingrothaus H.V. 2004, At. Data Nucl. Data Tables, 88, 237
- Nabi and Rahman (2005) Nabi, J.-U., Rahman, M.-U. 2005, Phys. Lett. B, 612, 190-196
- Nabi (2009) Nabi J.-Un. 2009, Eur. Phys. J. A, 40, 223
- Nabi (2012) Nabi J.-Un. 2012, Astrophys. and Space Sci., 339, 305-315
- Nabi et al. (2013) Nabi J.-Un. and Johnson C.W. 2013, J. Phys. G, 40, 065202
- Osterfeld (1992) Osterfeld, F. 1992, Rev. Mod. Phys. 64, 491
- Pougheon et al. (1987) Pougheon, F., Jacmart, J.C., Quiniou, E., Anne, R., Bazin, D., Borrel, V., Galin, J., Guerreau, D., Guillemaud-MueUer, D., Mneller, A.C., Roeckl, E., Saint-Laurent, M.G., D traz, C. 1987, Z. Phys. A - Atomic Nuclei, 327, 17
- Pruet et al. (2003) Pruet, J., Fuller, G.M. 2003, Astrophys. J. Suppl. 149, 189
- Rapaport et al. (1983) Rapaport, J., Taddeucci, T., Welch, T.P., Gaarde, C., Larsen, J., Horen, D.J., Sugarbaker, E., Koncz, P., Foster, C.C., Goodman, C.D., Goulding, C.A., Masterson, T. 1983, Nucl. Phys. A, 410, 371
- Ronnqvist et al. (1993) Ronnquist, T., Condé, H., Olsson, N., Remstrm, E., Zorro, R., Blomgreen, J., Hkansson, A., Ringbom, A., Tibell, G., Jonsson, O., Nilsson, L., Renberg, P. U., Van der Werf, S.Y., Unkelbach, W., Brady, F.P. 1993, Nucl. Phys. A, 563, 225
- Rahman et al. (2013) Rahman, M.-U, Nabi J.-U. 2013, Astrophys. and Space Sci., 348, 427-435
- Rahman et al. (2014) Rahman, M.-U, Nabi, J.-U. 2014, Astrophys. Space Sci., 351, 235-242, DOI:10.1007/s10509-014-1831-0.
- Sarriguren (2013) Sarriguren, P., 2013, Phys. Rev. C, 87, 045801
- Staudt et al. (1990) Staudt, A., Hirsch, M., Muto, K., Klapdor-Kleingrothaus, H. V. 1990, Phys. Rev. Lett., 65, 1543
- Tachibana et al. (1988) Tachibana, T., Yamada, M., Nakata, K., Report of Sci. and Res. Lab., Waseda University, No. 88-3 (1988)
- Timmes et al. (1996) Timmes, F.X., Woosley, S.E., Weaver, T.A. 1996, Astrophys. J., 457, 834
- Vetterli et al. (1989) Vetterli, M.C., Husser, O., Abegg, R., Alford, W.P., Celler, A., Frekers, D., Helmer, R., Henderson, R., Hicks, k.H., Jackson, K.p., Jappesen, R.G., Miller, C.A, Raywood, K., Yen, S. 1989, Phys. Rev. C, 40, 559
- Wallace et al. (1981) Wallace, R.K., Woosley, S.E. 1981, Astrophys. J. Suppl., 45, 389-420
- Wang et al. (1988) Wang, D., Rapaport, J., Horen, D.J., Brown, B.A., Gaarde, C., Goodman, C.D., Sugarbaker, E., Taddeucci, T.N. 1988, Nucl. Phys. A, 480, 285
| Nucleus | Unquenched | Unquenched | Quenched | Quenched | experimental |
|---|---|---|---|---|---|
| (mirror nuclei) | |||||
| 46Mn | 12.45 | 12.89 | 6.82 | 6.98 | |
| 48Fe | 12.62 | 13.26 | 6.91 | 7.18 | |
| 50Co | 16.73 | 14.68 | 9.16 | 7.95 | |
| 52Ni | 17.51 | 15.33 | 9.59 | 8.30 | 5.9 1.5 (Wang 88) |
| 56Zn | 21.91 | 16.69 | 11.99 | 9.04 | 9.9 2.4 (Rapaport 83) |
| 10 | 0.01 | 0.852 | -5.000 | 0.01 | 0.852 | -0.040 | |
|---|---|---|---|---|---|---|---|
| 10 | 1 | 0.851 | -3.975 | 1 | 0.851 | -0.044 | |
| 10 | 3 | 0.915 | -1.411 | 3 | 0.915 | 0.008 | |
| 10 | 5 | 0.968 | -0.542 | 5 | 0.969 | 0.090 | |
| 10 | 10 | 1.009 | 0.588 | 10 | 1.011 | 0.681 | |
| 10 | 30 | 0.977 | 2.536 | 30 | 0.977 | 2.540 | |
| 0.01 | 0.852 | -3.152 | 0.01 | 0.852 | 2.213 | ||
| 1 | 0.851 | -3.748 | 1 | 0.851 | 2.213 | ||
| 3 | 0.915 | -1.410 | 3 | 0.915 | 2.259 | ||
| 5 | 0.968 | -0.542 | 5 | 0.970 | 2.301 | ||
| 10 | 1.009 | 0.588 | 10 | 1.019 | 2.376 | ||
| 30 | 0.977 | 2.536 | 30 | 1.012 | 2.849 | ||
| 0.01 | 0.852 | -1.752 | 0.01 | 0.852 | 5.040 | ||
| 1 | 0.851 | -1.942 | 1 | 0.851 | 5.032 | ||
| 3 | 0.915 | -1.353 | 3 | 0.915 | 5.083 | ||
| 5 | 0.968 | -0.533 | 5 | 0.970 | 5.121 | ||
| 10 | 1.009 | 0.589 | 10 | 1.019 | 5.156 | ||
| 30 | 0.977 | 2.536 | 30 | 1.048 | 5.216 |
| 10 | 0.01 | -0.020 | -5.695 | 0.01 | -0.020 | -0.689 | |
|---|---|---|---|---|---|---|---|
| 10 | 1 | -0.020 | -4.656 | 1 | -0.020 | -0.684 | |
| 10 | 3 | -0.020 | -2.08 | 3 | -0.020 | -0.637 | |
| 10 | 5 | -0.002 | -1.175 | 5 | -0.001 | -0.534 | |
| 10 | 10 | 0.714 | 0.232 | 10 | 0.715 | 0.325 | |
| 10 | 30 | 1.637 | 2.687 | 30 | 1.638 | 2.691 | |
| 0.01 | -0.020 | -3.847 | 0.01 | -0.020 | 1.819 | ||
| 1 | -0.020 | -4.428 | 1 | -0.020 | 1.826 | ||
| 3 | -0.020 | -2.079 | 3 | -0.020 | 1.836 | ||
| 5 | -0.002 | -1.175 | 5 | 0.000 | 1.857 | ||
| 10 | 0.714 | 0.232 | 10 | 0.720 | 2.065 | ||
| 30 | 1.637 | 2.688 | 30 | 1.661 | 2.997 | ||
| 0.01 | -0.020 | -2.445 | 0.01 | -0.020 | 4.911 | ||
| 1 | -0.020 | -2.622 | 1 | -0.020 | 4.908 | ||
| 3 | -0.020 | -2.022 | 3 | -0.020 | 4.908 | ||
| 5 | -0.002 | -1.166 | 5 | 0.000 | 4.910 | ||
| 10 | 0.714 | 0.233 | 10 | 0.720 | 4.961 | ||
| 30 | 1.637 | 2.688 | 30 | 1.685 | 5.302 |
| 10 | 0.01 | 1.510 | -4.473 | 0.01 | 1.510 | 0.462 | |
|---|---|---|---|---|---|---|---|
| 10 | 1 | 1.544 | -3.427 | 1 | 1.544 | 0.489 | |
| 10 | 3 | 1.580 | -0.890 | 3 | 1.580 | 0.523 | |
| 10 | 5 | 1.594 | -0.055 | 5 | 1.595 | 0.574 | |
| 10 | 10 | 1.600 | 1.020 | 10 | 1.602 | 1.113 | |
| 10 | 30 | 1.550 | 2.842 | 30 | 1.550 | 2.846 | |
| 0.01 | 1.510 | -2.625 | 0.01 | 1.510 | 2.644 | ||
| 1 | 1.544 | -3.200 | 1 | 1.544 | 2.681 | ||
| 3 | 1.544 | -0.889 | 3 | 1.580 | 2.709 | ||
| 5 | 1.594 | -0.054 | 5 | 1.595 | 2.726 | ||
| 10 | 1.600 | 1.020 | 10 | 1.608 | 2.769 | ||
| 30 | 1.550 | 2.842 | 30 | 1.583 | 3.151 | ||
| 0.01 | 1.510 | -1.228 | 0.01 | 1.510 | 5.310 | ||
| 1 | 1.544 | -1.395 | 1 | 1.544 | 5.348 | ||
| 3 | 1.580 | -0.833 | 3 | 1.580 | 5.379 | ||
| 5 | 1.594 | -0.046 | 5 | 1.595 | 5.387 | ||
| 10 | 1.600 | 1.021 | 10 | 1.608 | 5.396 | ||
| 30 | 1.550 | 2.842 | 30 | 1.617 | 5.435 |
| 10 | 0.01 | 0.810 | -5.162 | 0.01 | 0.810 | -0.207 | |
|---|---|---|---|---|---|---|---|
| 10 | 1 | 0.810 | -4.141 | 1 | 0.810 | -0.206 | |
| 10 | 3 | 0.809 | -1.604 | 3 | 0.810 | -0.178 | |
| 10 | 5 | 0.813 | -0.740 | 5 | 0.814 | -0.105 | |
| 10 | 10 | 0.972 | 0.507 | 10 | 0.973 | 0.601 | |
| 10 | 30 | 1.549 | 2.866 | 30 | 1.549 | 2.870 | |
| 0.01 | 0.810 | -3.314 | 0.01 | 0.810 | 2.155 | ||
| 1 | 0.810 | -3.913 | 1 | 0.810 | 2.161 | ||
| 3 | 0.809 | -1.603 | 3 | 0.810 | 2.169 | ||
| 5 | 0.813 | -0.740 | 5 | 0.814 | 2.186 | ||
| 10 | 0.972 | 0.508 | 10 | 0.978 | 2.327 | ||
| 30 | 1.549 | 1.549 | 30 | 1.574 | 3.178 | ||
| 0.01 | 0.810 | -1.917 | 0.01 | 0.810 | 5.120 | ||
| 1 | 0.810 | -2.108 | 1 | 0.810 | 5.116 | ||
| 3 | 0.809 | -1.546 | 3 | 0.810 | 5.117 | ||
| 5 | 0.813 | -0.731 | 5 | 0.814 | 5.119 | ||
| 10 | 0.972 | 0.508 | 10 | 0.978 | 5.170 | ||
| 30 | 1.549 | 2.866 | 30 | 1.598 | 5.517 |
| 10 | 0.01 | 1.399 | -4.429 | 0.01 | 1.399 | 0.489 | |
|---|---|---|---|---|---|---|---|
| 10 | 1 | 1.399 | -3.421 | 1 | 1.399 | 0.488 | |
| 10 | 3 | 1.399 | -0.913 | 3 | 1.399 | 0.499 | |
| 10 | 5 | 1.398 | -0.085 | 5 | 1.399 | 0.544 | |
| 10 | 10 | 1.390 | 0.989 | 10 | 1.392 | 1.082 | |
| 10 | 30 | 1.331 | 2.822 | 30 | 1.332 | 2.826 | |
| 0.01 | 1.399 | -2.581 | 0.01 | 1.399 | 2.685 | ||
| 1 | 1.399 | -3.194 | 1 | 1.399 | 2.691 | ||
| 3 | 1.399 | -0.912 | 3 | 1.399 | 2.695 | ||
| 5 | 1.398 | -0.085 | 5 | 1.399 | 2.705 | ||
| 10 | 1.390 | 0.990 | 10 | 1.399 | 2.745 | ||
| 30 | 1.331 | 2.822 | 30 | 1.365 | 3.132 | ||
| 0.01 | 1.399 | -1.188 | 0.01 | 1.399 | 5.379 | ||
| 1 | 1.399 | -1.389 | 1 | 1.399 | 5.376 | ||
| 3 | 1.399 | -0.855 | 3 | 1.399 | 5.376 | ||
| 5 | 1.398 | -0.076 | 5 | 1.399 | 5.377 | ||
| 10 | 1.390 | 0.991 | 10 | 1.399 | 5.381 | ||
| 30 | 1.331 | 2.822 | 30 | 1.399 | 5.417 |
| Nucleus | [T | [T | [T | [T | [T | [T |
|---|---|---|---|---|---|---|
| 46Mn | 37 | 97.4 | 29 | 53 | 15 | |
| 48Fe | 44 | 125.8 | 53 | 48 | 60 | |
| 50Co | 44 | 21.4 | 27 | 36 | 47 | |
| 52Ni | 38 | 107.3 | 50 | 35 | 77 | |
| 56Zn | 36 | 27.6 | 24 | 24 | 83 |