The Extended Spatial Distribution of Globular Clusters in the Core of the Fornax Cluster
Abstract
We report the discovery of a complex extended density enhancement in the Globular Clusters (GCs) in the central ( Mpc2) of the Fornax cluster, corresponding to of the area within 1 core radius. This overdensity connects the GC system of NGC1399 to most of those of neighboring galaxies within ( kpc) along the W-E direction. The asymmetric density structure suggests that the galaxies in the core of the Fornax cluster experienced a lively history of interactions that have left a clear imprint on the spatial distribution of GCs. The extended central dominant structure is more prominent in the distribution of blue GCs, while red GCs show density enhancements that are more centrally concentrated on the host galaxies. We propose that the relatively small-scale density structures in the red GCs are caused by galaxy-galaxy interactions, while the extensive spatial distribution of blue GCs is due to stripping of GCs from the halos of core massive galaxies by the Fornax gravitational potential. Our investigations is based on density maps of candidate GCs extracted from the multi-band VLT Survey Telescope (VST) survey of Fornax (FDS), identified in a three-dimensional color space and further selected based on their -band magnitude and morphology.
Subject headings:
galaxies: clusters: individual (Fornax) - galaxies: evolution - galaxies: individual (NGC1399)1. Introduction
In the hierarchical CDM paradigm the most massive galaxies grow through mergers and accretions of multiple smaller galaxies (Springel et al., 2005). These interactions leave their footprints in the galaxies’ dynamics, kinematics, chemistry and morphology, and in particular in galaxy halos (e.g. Zolotov et al., 2010) where dynamical timescales are longer than at small galactocentric distances. In this context, historically much attention has been paid to the properties of the globular cluster systems (GCSs) of the galaxies (Brodie & Strader, 2006). In the framework of the two-phase galaxy formation model (e.g. Oser et al., 2010; Rodriguez-Gomez et al., 2015), GCs trace both the in situ star formation and the accretion phases. Recently it has been shown that the spatial distribution of the GC systems of massive early-type galaxies (e.g. D’Abrusco et al., 2015; Blom et al., 2014; D’Abrusco et al., 2014a, b, 2013b) has inhomogeneities that may reflect the host’s accretion history. This approach complements the study of the GCS kinematics (e.g. Strader et al., 2011; Coccato et al., 2013; Napolitano et al., 2014; Pota et al., 2015a, b).
Deep, multi-band optical imaging data covering large areas of the sky can be used to reconstruct the projected 2D distribution of GCs within nearby clusters of galaxies. The spatial distribution of GCs in the Virgo cluster, for instance, has been studied using both Sloan Digital Sky Survey (Lee et al., 2010) and the Canada-France-Hawaii Telescope data (Durrell et al., 2014, Next Generation Virgo Survey collaboration). In this paper we discuss the properties of the 2D spatial distribution of candidate GCs in the central region of the Fornax cluster using Fornax Deep Survey (FDS) data taken with the VST.
2. The Data and Catalog Extraction
The FDS data analyzed in this letter were acquired as Guaranteed Time Observations for the surveys FOrnax Cluster Ultra-deep Survey (FOCUS; P.I. R. Peletier) and VST Early-type GAlaxy Survey (VEGAS; P.I. M. Capaccioli), based on observations taken at the ESO La Silla Paranal Observatory. Imaging in the , , and filters was performed with the 2.6-m ESO VLT Survey Telescope (VST) at Cerro Paranal in Chile (Schipani et al., 2012). VST is equipped with the wide field camera OmegaCAM (Kuijken, 2011), whose field of view covers in the [0.3, 1.0] m wavelength range, with mean pixel scale of /pixel.
The images used in this letter cover 7 partially overlapping fields centered on the core of the Fornax cluster, for a total of . Images were acquired using the step-dither strategy, consisting of a cycle of short exposures alternately centered on the field and on contiguous regions adjacent to the field. This approach, adopted in other photometric surveys (e.g. Ferrarese et al., 2012), allows an accurate estimate of the sky background around bright and extended galaxies. For each field, we obtained 76 exposures of 150s in the -band, 54s in the and bands and 35s in the -band, for a total exposure time of 3.17, 2.25 and 1.46 hours respectively, reaching S/N10 at magnitudes for point-like sources in the , , and , respectively, with no significant spatial variations. The average seeing and the field-to-field standard deviation are 117008 in the -band and 087007 in the band. Other bands display comparable variations over the observed fields.
The image reduction was performed with the VST-Tube imaging pipeline (see Capaccioli et al. 2015 and Iodice et al. 2016 for descriptions of the pipeline and the observing strategy). The photometric analysis of the images followed the prescriptions in Cantiello et al. (2015). We extracted the catalog of all sources by independently running SExtractor (Bertin & Arnouts, 1996) in each filter. To improve the detection of sources around bright galaxies, we modeled and subtracted the galaxies using the IRAF ellipse routine and ran SExtractor on a cutouts of the frame centered on the extended sources. We obtained aperture magnitudes within a 8-pixel diameter ( at OmegaCAM resolution), and applied aperture corrections to infinite radius calculated with the growth curves of bright isolated point-like sources, independently for each band and pointing (Cantiello et al., 2015).
The catalogs in the four bands were matched with a radius, larger than the rms on the residuals of the differences between coordinates of overlapping detections (Capaccioli et al., 2015), producing a matched catalog of sources. The techniques used to obtain the catalog of sources will be described in a forthcoming paper (Cantiello et al., 2016). Corrections for Galactic foreground extinction were applied following Draine (2003) and the Schlafly & Finkbeiner (2011) reddening map.
3. Selection of Candidate GCs
We designed a new method that employs multi-wavelength photometry and a sample of bona fide confirmed GCs for the selection of candidate GCs. The confirmed GCs are used to model the region of the three-dimensional (3D) color space occupied by GCs (hereinafter, the locus). The main steps required to extract the candidate GCs from the general catalog of sources are:
-
•
Select sources located within the GC 3D color space locus;
-
•
Apply magnitude cuts to the color-selected sources and discard extended sources;
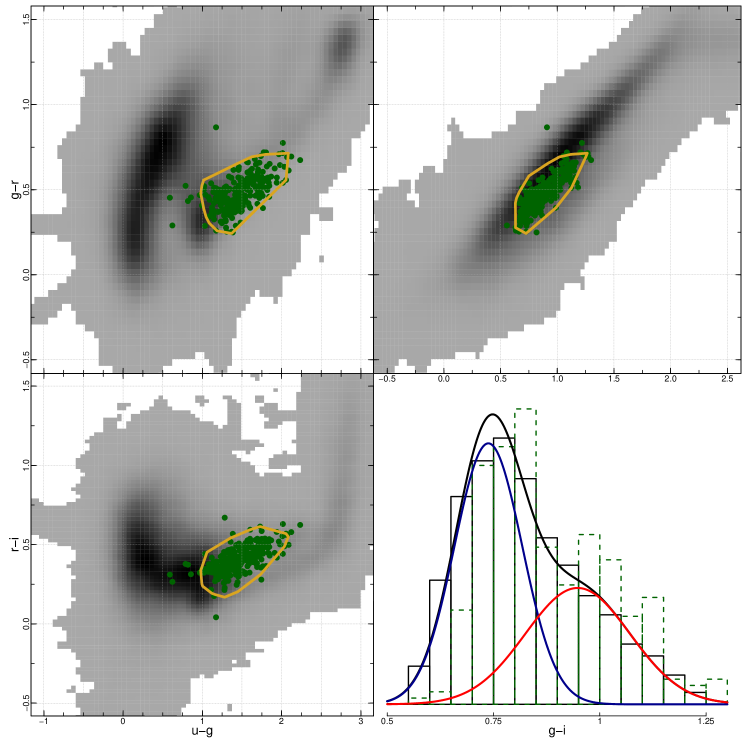
GCs occupy a well-defined region in the optical color space (Rhode & Zepf, 2001; Pota et al., 2013). We define the locus as the smallest compact region in the 3D space generated by the Principal Components (PCs) associated with their optical colors , and (zero centered and scaled to unity variance), containing a fixed fraction of training set GCs. Modeling the GC locus in the PC space ensures the simplest possible geometry by virtue of the definition of PCs itself (see D’Abrusco et al., 2013b). Only photometric sources detected in all bands located within the PC space locus are considered. Moreover, we select only sources whose “color-error ellipsoid” (ellipsoids with semi-axes equal to the PC-transformed uncertainties on each color) intersects the locus for of its volume.
The training set used in this letter is the sample of NGC1399 spectroscopically confirmed GCs (Schuberth et al., 2010, A and B), covering around the host. The GCs locus contains all the contiguous cells of a regular lattice with at least one training set member. The number of cells of the lattice, i.e. the spatial resolution of the grid along each PC axis is set such that the average density per cell over the region of the PC space considered is . Empty cells surrounded by cells containing members of the training set are included in the locus to obtain a simply connected geometry. Figure 1 shows the projections of the PC space GC locus on three color-color diagrams.
We apply a brightness selection on the -band magnitude and a size selection to the color-selected sources. We exclude sources brighter than to avoid contamination by stars and ultra-compact dwarf galaxies (cp. Mieske et al., 2008). Sources fainter than , the faintest -band magnitude of the FDS counterparts of the training set GCs, are also discarded. Since GCs at the distance of the Fornax cluster appear mostly as unresolved sources with the VST spatial resolution, we employ the SExtractor parameter to select star-like sources111The CLASS_STAR parameter is estimated by a neural network trained on 10 photometric parameters extracted from simulated images. The extension index produced by the neural network ranges between 0 and 1 (Bertin & Arnouts, 1996).. Based on the distribution of the Schuberth et al. (2010) GCs, we required that candidate GCs have . We checked that our selection is consistent with the different technique based on the position of the sources in the vs plane (see Jennings et al., 2014), where the -band magnitudes are measured within fixed apertures of 4 and 8 pixels. We found differences for less than of the candidate GCs selected.
| PC1 | PC2 | PC3 | Parameter | Lower | Upper | Blue | Red | ||
|---|---|---|---|---|---|---|---|---|---|
| boundary | boundary | ||||||||
| 0.579 | 0.555 | 0.597 | PC1 | -1.56 | 1.92 | NGCs | |||
| 0.551 | -0.806 | 0.215 | PC2 | -0.47 | 0.41 | 0.74 | 0.95 | ||
| 0.597 | 0.215 | -0.773 | PC3 | -0.12 | 0.11 | 0.08 | 0.12 | ||
| 1.66 | 0.49 | 0.13 | 20 | 23 | |||||
| (%) | 0.71 | 0.18 | 0.11 | CLASS_STAR | 0.3 | - |
We required the PC locus to contain 95% of the training set. The “observed” recovery rate is slightly smaller () because of the selections on the -band magnitude and “CLASS_STAR” parameter. We estimate the background of our selection as the density of all sources in two regions of located along the borders of the observed frame and devoid of bright galaxies. Since these regions are placed within 1 Fornax virial radius (Drinkwater et al., 2001), the background population is likely composed of both contaminants (stars and galaxies) and GCs. The average total density of background sources is 0.050.01 objects arcmin-2 (0.030.01 and 0.020.01 selected as blue and red candidate GCs respectively).
4. The Catalog of Candidate GCs
The catalog of candidate GCs contains sources. Using the Gaussian Mixture Modeling code (GMM, Muratov & Gnedin, 2010), we determined that the candidate GCs histogram is bimodal (as expected given the training set color distribution). The best-fit parameter of the two Gaussians are shown in Table LABEL:tab:table (right). We adopted the threshold to separate red from blue candidate GCs, yielding red candidate GCs ( of the total) and blue candidate GCs (). A fixed color threshold is employed because we focus on the intracluster population, whose properties are considered to be independent of individual galaxies. Hence, the variations of the GC color distribution as function of the distance from the centers of the host galaxies (Kim et al., 2013; Cantiello et al., 2015) and the differences of the red/blue bimodality of the individual GCSs of (cp. Jordán et al., 2015) are not considered.
Using a sample of GCs extracted from Hubble data around NGC1399 (Puzia et al., 2014), we find that the completeness magnitude of our population of candidate GCs is , 1.5 magnitudes brighter than the average -band turnover of the GCLF (Villegas et al., 2010; Jordán et al., 2007). While the distribution (bottom-right panel in Figure 1) is consistent with those in Bassino et al. (2006) and Kim et al. (2013), our catalog is dominated by the blue component of the GCs population because the FDS data, unlike the Schuberth et al. (2010) training set, cover a wide area of the cluster at large distances from the hosts, where GCs are overwhelmingly blue (cp. Durrell et al., 2014). The crossmatch of our catalog with the deeper () Kim et al. (2013) sample of -photometry selected candidate GCs in a region around NGC1399 returns of common GCs. We also recover of the kinematically confirmed GCs from Bergond et al. (2007).
5. Maps of the Spatial Distribution of GCs
We determined the density maps of the spatial distribution of candidate GCs applying the K-Nearest Neighbor (KNN) method (see Dressler, 1980; D’Abrusco et al., 2013a) on a regular grid covering the observed region. KNN density, defined as , is directly proportional to the neighbor index and inversely proportional to the area of the circle defined by the distance of the -th closest source to the center of the grid cells, where the density is calculated. The parameter was varied over the interval (see D’Abrusco et al., 2015, for a discussion on the choice of ). This strategy provides a non-zero density in each cell of the grid, including those not containing candidate GCs. is a measure of the richness and size expressed in number of members, of the structures to which the density map is sensitive to. Maps with small are dominated by compact density structures, while large ’s highlight more extended structures. In the following, we will discuss maps to focus on the features of the distribution of candidate GCs on large spatial scales. Since background contribution to the catalog of candidate GCs is only known statistically, the shapes and areas of the density structures discussed henceforth are to be considered approximations.
The significance of the density structures is calculated as the complement to the probability of the number of candidate GCs observed within the structure of being caused by fluctuations of the background population, which we assume to follow the Poisson statistics. For density structures located within other overdensities, the significance has been determined relative to poissonian fluctuations of a population with density equal to the density of all candidate GCs in the underlying density structure. By assuming that background sources are independent, our estimates are lower limits to the real significances of the density structures. In the case of enhancements including compact GCSs, the contribution of the hosts’ GC population is accounted for by removing all the sources within a circle containing 95% of the GCS population centered on each galaxy. We assume a power-law radial density profile with slope from the literature when available or fixed to otherwise.
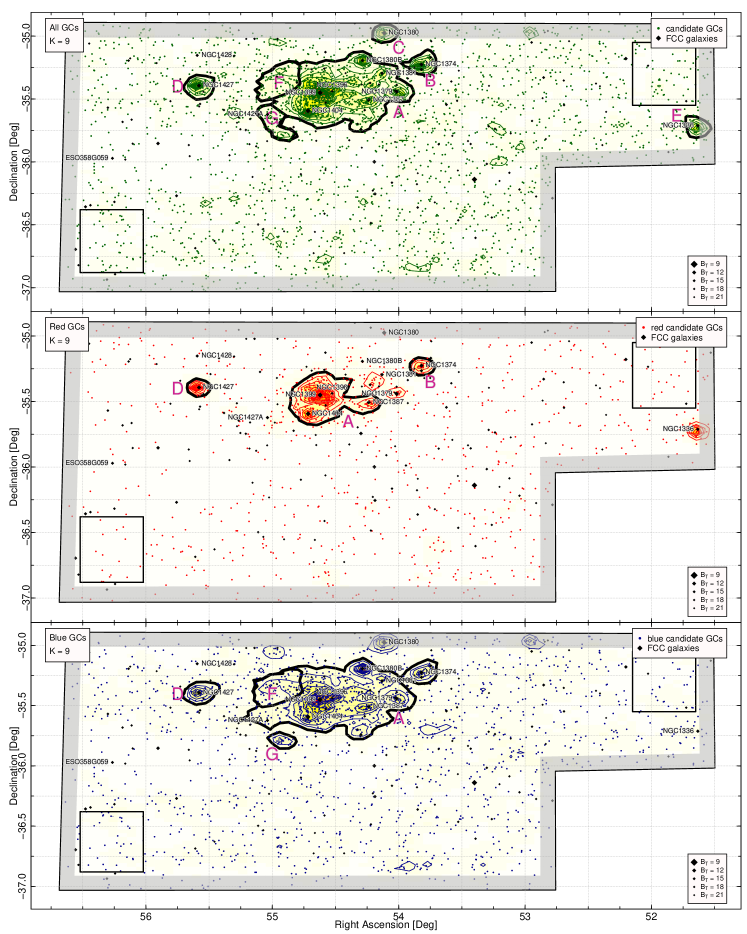
Figure 2 shows the density maps for (top to bottom) all, red and blue candidate GCs. The distribution of all candidate GCs is dominated by a large, irregularly shaped overdensity roughly centered on NGC1399 and extended along the W-E axis, within a region of (A). The significance of this structure is . This structure stretches out to connect NGC1399 with most of the nearby galaxies (NGC1404, NGC1387, NGC1396, NGC1380B, NGC1381), and contains of all candidate GCs, ( red/blue), corresponding to of total number of blue candidate GCs and of total number of red candidate GCs in our catalog.
Other galaxies associated with noticeable overdensities are NGC1374 (B), NGC1380 (C), NGC1427 (D) and NGC1336 (E) in agreement with earlier works on their GCSs (Kissler-Patig et al., 1997a, b), while ESO358G059 and NGC1428 lack visible density enhancements. Two spatial features not associated to bright galaxies are clearly visible in the density map of all candidate GCs: a large enhancement of circular shape (F, ) NE of NGC1399; and a hook-shaped structure (G, ) at SE of the NGC1404 overdensity and seemingly connected to the structure A through the NGC1427A density enhancement. Outside the core region, excluding the structures of the NGC1427, NGC1336 and NGC1380 GCSs, the distribution of candidate GCs is featureless and homogeneous on spatial scales , except for a region centered on R.A. and Dec almost devoid of candidate GCs (). We checked the photometric quality in this area, but did not notice differences with the other regions of the observed frame.
The central overdensity associated with NGC1399 is significantly more compact for red than for blue GCs. Although the accuracy of the density maps deteriorates with smaller sample size, this difference is still evident for brighter magnitude-selected subsets of red and blue candidate GCs. The structures F and G are not visible in the density map of red candidate GCs but are still detected in the blue GC density map (with and significance, respectively), hinting to a possible accretion-related origin (e.g. Côté et al., 1998). The notable differences of the NGC1380 and NGC1336 density structures for red and blue candidate GCs are caused by the combined effects of the fixed color threshold, the low number of candidate GCs due to high galaxy background levels, and the relative shallowness of the -band images that favors the selection of blue candidate GCs. Moreover, near the edges of the surveyed region the KNN with may underestimate the density of compact, numerically small or extended, only partially covered GC subpopulations.
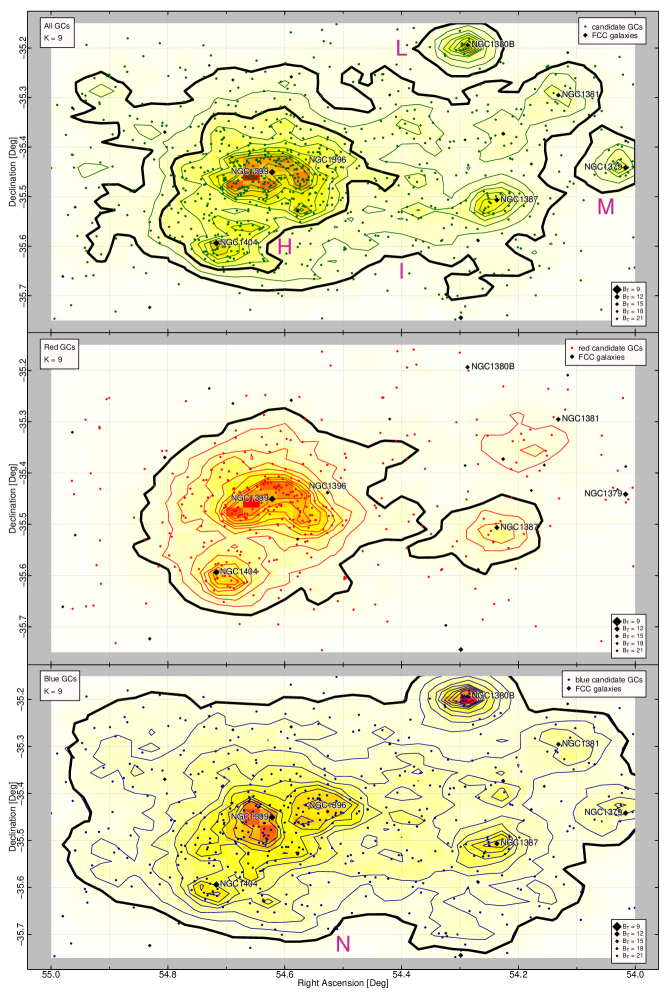
We produced additional density maps for the cluster core, using a finer grid. Figure 3 shows the maps for all, red and blue candidate GCs in a box roughly centered on NGC1399. The strong overdensity connecting NGC1399 and NGC1404 along the SE-NW direction (H, ), has peaks associated with the galaxies centers. The investigation of the morphology of the NGC1399-NGC1404 complex, interpreted by Bekki et al. (2003) with NGC1399 stripping GCs from NGC1404, requires the modeling of the radial profiles of these GCSs and is not discussed here. While Kim et al. (2013) reported a displacement between the optical center of NGC1399 and the center of its GC distribution, attributed to recent interactions, our analysis of the spatial distribution of candidate GCs in the central region of NGC1399 is constrained by the completeness of our catalog of candidate GCs. Using samples of bona fide HST GCs in the central region of NGC1399 (Puzia et al., 2014; Jordán et al., 2015), we find that the completeness of our catalog of candidate GCs increases from a minimum of within 05 from the center of the galaxy, corresponding to a -band surface brightness , to at 15 (), and remains constant between and with no evident trend up to (). For this reason, we cannot determine the nature of the deficit observed in Figure 3. Comparable completeness is measured near the centers of NGC1380, NGC1336 and NGC1387.
On large spatial scales, the main NGC1399-NGC1404 overdensity extends to the W joining with the density enhancements associated with NGC1387 and NGC1381 (I, ). The bridge connecting the NGC1399 overdensity to the NGC1387 GCS has been reported by Bassino et al. (2006) in the spatial distribution of blue candidate GCs within around NGC1399 and, independently, by Kim et al. (2013). The NGC1380B (L) and NGC1379 (M) density enhancements are isolated. The density map of red candidate GCs (Figure 3, mid) still shows a large overdensity in the core of the Fornax cluster composed by two sub-concentrations centered on NGC1399 and NGC1404, connected by a lower density valley. The other bright galaxies in the field are not associated with clear density enhancements. In the density maps of blue candidate GCs, the central structure (N, ) is similar to structure I, but also includes the NGC1380B and NGC1379 enhancements.
6. Discussion
We report a density structure in the spatial distribution of candidate GCs in a region within the core of the Fornax cluster of galaxies, connecting NGC1399 to the surrounding galaxies NGC1404, NGC1387, NGC1381 and NGC1380B. Our findings expand on the discovery by Bassino et al. (2006) of a GC bridge between NGC1399 and NGC1404. We used candidate GCs extracted from VST images covering the central of the cluster. The method employed for the selection of candidate GCs relies on the modeling of the locus occupied by confirmed GCs in the 3D color space generated by -bands photometry, and the application of cuts on -band magnitude and morphology.
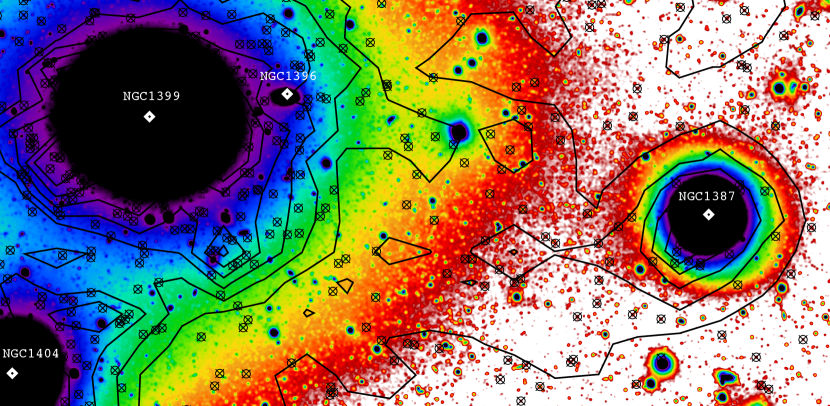
The dominant GC overdensity displays an intricate morphology and is elongated on the WE direction. A similar asymmetry was observed, on scales of kpc, in the NGC1399 X-ray halo emission (Paolillo et al., 2002), due to the presence of three distinct components with different centers and sizes. The diffuse spatial structures not associated with galaxies suggest a long and active history of interactions which have shaped the spatial distribution of GCs. We re-observe the GC bridge connecting the NGC1399-NGC1404 complex to NGC1387 (Bassino et al., 2006; Kim et al., 2013), that seems to support the Iodice et al. (2016) claim of a low surface brightness stream in the FDS -band light distribution (Figure 4). This evidence suggests that the more massive NGC1399 may have stripped GCs from NGC1387. We also highlighted two isolated density structures (F and G) with complex shapes mostly formed by blue GCs, whose origins could be related to accretion or stripping events. Other isolated galaxies (NGC1380, NGC1427, NGC1379 and NGC1336) are associated with distinct, compact enhancements. On larger spatial scales we observe a featureless distribution of candidate GCs, barring few compact GCSs and one underdensity.
The zoomed in density map of blue GCs (Figure 3, bottom) shows that NGC1381, NGC1379 and NGC1380B are also connected to the main overdensity centered on NGC1399. This result indicates that GC stripping may not have been limited to NGC1387, as proposed by Bassino et al. (2006). Since the shapes of the density enhancements in the map of red GCs, barring the evident central overdensities associated to the GCSs of the single galaxies, are reminiscent of the structure linking the NGC1399-NGC1404 region to NGC1387, one may speculate that these galaxies have experienced strong interactions which may have disrupted the GCSs of nearby satellites and/or gravitationally trapped relatively red intra-cluster GCs. The large-scale morphology of blue GCs observed in both the general and the zoomed density maps may be explained with a different mechanism, namely the trapping in the potential well in the Fornax core of mostly blue GCs stripped by the tidal field of the cluster from hosts at small cluster-centric distances, as predicted by simulations (Ramos et al., 2015).
Our conclusions are constrained by the limits of the training set and the depth of the photometric data. As the survey nears completion, the new data acquired will be used to improve our analysis and provide a detailed assessment of the performance of our selection using a larger, more homogenous sample of spectroscopically selected (P.I. Capaccioli, ID 094.B-0687; Pota et al. 2016) GCs covering around NGC1399, observed in the context of the FDS project. Additional insights into the properties of the spatial distribution of GCs in Fornax will be obtained by comparing the features of the GC structures with the phase-space properties of the Pota et al. (2016) sample, and by modeling the distinct spatial components of the candidate GCs population (D’Abrusco et al., 2015, 2014a, 2014b, 2013a, 2013b).
References
- Bassino et al. (2006) Bassino, L. P., Faifer, F. R., Forte, J. C., et al. 2006, A&A, 451, 789
- Bekki et al. (2003) Bekki, K., Forbes, D. A., Beasley, M. A., & Couch, W. J. 2003, MNRAS, 344, 1334
- Bergond et al. (2007) Bergond, G., Athanassoula, E., Leon, S., et al. 2007, A&A, 464, L21
- Bertin & Arnouts (1996) Bertin, E., & Arnouts, S. 1996, A&AS, 117, 393
- Blom et al. (2014) Blom, C., Forbes, D. A., Foster, C., Romanowsky, A. J., & Brodie, J. P. 2014, MNRAS, 439, 2420
- Brodie & Strader (2006) Brodie, J. P., & Strader, J. 2006, ARA&A, 44, 193
- Cantiello et al. (2015) Cantiello, M., Capaccioli, M., Napolitano, N., et al. 2015, A&A, 576, A14
- Cantiello et al. (2016) Cantiello, M., et al. in prep.
- Capaccioli et al. (2015) Capaccioli, M., Spavone, M., Grado, A., et al. 2015, A&A, 581, A10
- Coccato et al. (2013) Coccato, L., Arnaboldi, M., & Gerhard, O. 2013, MNRAS, 436, 1322
- Côté et al. (1998) Côté, P., Marzke, R. O., & West, M. J. 1998, ApJ, 501, 554
- D’Abrusco et al. (2013a) D’Abrusco, R., Massaro, F., Paggi, A., et al. 2013, ApJS, 206, 12
- D’Abrusco et al. (2013b) D’Abrusco, R., Fabbiano, G., Strader, J., et al. 2013, ApJ, 773, 87
- D’Abrusco et al. (2014a) D’Abrusco, R., Fabbiano, G., Mineo, S., et al. 2014, ApJ, 783, 18
- D’Abrusco et al. (2014b) D’Abrusco, R., Fabbiano, G., & Brassington, N. J. 2014, ApJ, 783, 19
- D’Abrusco et al. (2015) D’Abrusco, R., Fabbiano, G., & Zezas, A. 2015, ApJ, 805, 26
- Draine (2003) Draine, B. T. 2003, ARA&A, 41, 241
- Dressler (1980) Dressler, A. 1980, ApJ, 236, 351
- Drinkwater et al. (2001) Drinkwater, M. J., Gregg, M. D., & Colless, M. 2001, ApJ, 548, L139
- Durrell et al. (2014) Durrell, P. R., Côté, P., Peng, E. W., et al. 2014, ApJ, 794, 103
- Ferguson (1989) Ferguson, H. C. 1989, AJ, 98, 367
- Ferrarese et al. (2012) Ferrarese, L., Côté, P., Cuillandre, J.-C., et al. 2012, ApJS, 200, 4
- Iodice et al. (2016) Iodice, E., accepted for publication in ApJ
- Jennings et al. (2014) Jennings, Z. G., Strader, J., Romanowsky, A. J., et al. 2014, AJ, 148, 32
- Jordán et al. (2007) Jordán, A., McLaughlin, D. E., Côté, P., et al. 2007, ApJS, 171, 101
- Jordán et al. (2015) Jordán, A., Peng, E. W., Blakeslee, J. P., et al. 2015, ApJS, 221, 13
- Kim et al. (2013) Kim, H.-S., Yoon, S.-J., Sohn, S. T., et al. 2013, ApJ, 763, 40
- Kissler-Patig et al. (1997a) Kissler-Patig, M., Kohle, S., Hilker, M., et al. 1997, A&A, 319, 470
- Kissler-Patig et al. (1997b) Kissler-Patig, M., Richtler, T., Storm, J., & della Valle, M. 1997, A&A, 327, 503
- Kuijken (2011) Kuijken, K. 2011, The Messenger, 146, 8
- Lee et al. (2010) Lee, M. G., Park, H. S., & Hwang, H. S. 2010, Science, 328, 334
- Mieske et al. (2008) Mieske, S., Hilker, M., Jordán, A., et al. 2008, A&A, 487, 921
- Muratov & Gnedin (2010) Muratov, A. L., & Gnedin, O. Y. 2010, ApJ, 718, 1266
- Napolitano et al. (2014) Napolitano, N. R., Pota, V., Romanowsky, A. J., et al. 2014, MNRAS, 439, 659
- Oser et al. (2010) Oser, L., Ostriker, J. P., Naab, T., Johansson, P. H., & Burkert, A. 2010, ApJ, 725, 2312
- Paolillo et al. (2002) Paolillo, M., Fabbiano, G., Peres, G., & Kim, D.-W. 2002, ApJ, 565, 883
- Pearson (1901) Pearson, K. 1901, Philosophical Magazine 2 (11): 559 572
- Pota et al. (2013) Pota, V., Forbes, D. A., Romanowsky, A. J., et al. 2013, MNRAS, 428, 389
- Pota et al. (2015a) Pota, V., Brodie, J. P., Bridges, T., et al. 2015, MNRAS, 450, 1962
- Pota et al. (2015b) Pota, V., Romanowsky, A. J., Brodie, J. P., et al. 2015, MNRAS, 450, 3345
- Pota et al. (2016) Pota, V., et al. in prep.
- Puzia et al. (2014) Puzia, T. H., Paolillo, M., Goudfrooij, P., et al. 2014, ApJ, 786, 78
- Ramos et al. (2015) Ramos, F., Coenda, V., Muriel, H., & Abadi, M. 2015, ApJ, 806, 242
- Rhode & Zepf (2001) Rhode, K. L., & Zepf, S. E. 2001, AJ, 121, 210
- Rodriguez-Gomez et al. (2015) Rodriguez-Gomez, V., Pillepich, A., Sales, L. V., et al. 2015, arXiv:1511.08804
- Schipani et al. (2012) Schipani, P., Noethe, L., Arcidiacono, C., et al. 2012, Journal of the Optical Society of America A, 29, 1359
- Schlafly & Finkbeiner (2011) Schlafly, E. F., & Finkbeiner, D. P. 2011, ApJ, 737, 103
- Schuberth et al. (2010) Schuberth, Y., Richtler, T., Hilker, M., et al. 2010, A&A, 513, A52
- Springel et al. (2005) Springel, V., White, S. D. M., Jenkins, A., et al. 2005, Nature, 435, 629
- Strader et al. (2011) Strader, J., Romanowsky, A. J., Brodie, J. P., et al. 2011, ApJS, 197, 33
- Villegas et al. (2010) Villegas, D., Jordán, A., Peng, E. W., et al. 2010, ApJ, 717, 603
- Zolotov et al. (2010) Zolotov, A., Willman, B., Brooks, A. M., et al. 2010, ApJ, 721, 738