Folding and escape of nascent proteins at ribosomal exit tunnel
Abstract
We investigate the interplay between post-translational folding and escape of two small single-domain proteins at the ribosomal exit tunnel by using Langevin dynamics with coarse-grained models. It is shown that at temperatures lower or near the temperature of the fastest folding, folding proceeds concomitantly with the escape process, resulting in vectorial folding and enhancement of foldability of nascent proteins. The concomitance between the two processes, however, deteriorates as temperature increases. Our folding simulations as well as free energy calculation by using umbrella sampling show that, at low temperatures, folding at the tunnel follows one or two specific pathways without kinetic traps. It is shown that the escape time can be mapped to a one-dimensional diffusion model with two different regimes for temperatures above and below the folding transition temperature. Attractive interactions between amino acids and attractive sites on the tunnel wall lead to a free energy barrier along the escape route of protein. It is suggested that this barrier slows down the escape process and consequently promotes correct folding of the released nascent protein.
I Introduction
A majority of nascent proteins must be folded into their native states shortly after emerging from the ribosome in order to avoid aggregation in the complex and crowded environment of the cell Dobson2003 . This task is partially fulfilled thanks to a variety of molecular chaperones that assist folding, as well as help preventing and repairing misfolded proteins Frydman . Another factor, that has been under intense research, is the effects of the ribosome on folding of nascent proteins Dobson2010 ; Baldwin ; Deutsch2005 ; Deutsch2009 ; Bustamante ; Ugrinov ; Evans ; Sanchez . Several studies have demonstrated that the ribosome facilitates correct folding of nascent proteins Bustamante ; Ugrinov . The effects of the ribosome on nascent protein folding could be classified as due to two reasons: a) the elongation of polypeptide chain during translation and b) the confinement of ribosomal exit tunnel and its interactions with nascent proteins. The first one is associated with the hypothesis of cotranslational protein folding, namely folding that occurs during protein synthesis, which receives now a substantial experimental support Deutsch2005 ; Deutsch2009 . A basic feature of cotranslational protein folding is vectorial folding Baldwin , which begins from the N-terminus and proceeds to the C-terminus of protein, as a result of vectorial synthesis. This folding mechanism is quite different from that of refolding Anfinsen of a free denatured protein in solution. The impact of vectorial folding on folding efficiency is expected to be much stronger in multi-domain proteins than in single domain proteins as it minimizes the chance of interdomain misfolding Frydman99 . Another feature of cotranslational protein folding is that it is influenced by translation rates, both locally Zhang and globally Siller . It has been shown that changing local translation rates by using alternative RNA codons leads to a significant effect EPO1 , and may coordinate cotranslational folding EPO2 . On the other hand, protein structures may have evolved to exploit the effects of cotranslational folding. It has been found that the propensity to form an -helix, obtained by analysis of PDB structures, is significantly higher near the C-terminus than near the N-terminus of proteins, in agreement with a non-equilibrium effect found in the folding of a growing chain HoangPRL .
The ribosomal polypeptide exit tunnel Voss is a narrow passage, through which nascent proteins are secreted into cellular environment. Originated at the peptidyl transferase center (PTC), where peptide bond formation takes place, the tunnel traverses through the body of ribosome large unit, and exits at the ribosome outer surface on the opposite side. It is constructed by aligned segments of the 23S rRNA molecule and several ribosomal proteins Pande2008 . The length of ribosomal tunnel is 100 , whereas its diameter varies in a range of approximately 10–20 Deutsch2009 . The tunnel is narrowest and also slightly bended at the constriction site of about 20 distal from the PTC. The narrow confinement of the tunnel would hinder the formation of tertiary structures Voss , whereas simple structural units such as -helices and -hairpin have been reported to form inside the tunnel Deutsch2005 ; Deutsch2009 . Experimental studies also have indicated that the ribosomal tunnel is a peptide-sensitive tunnel Ito2002 and may play an active role in modulation of translation and folding of nascent proteins Ito2004 ; Dresios . Simulations of cotranslational protein folding revealed closer details of the folding process at the exit tunnel, and suggest that the impact of the tunnel on folding is rather not universal, but secondary structure dependent Thirumalai ; Makarov and protein dependent Elcock ; Marek .
In this study, we investigate the effects of ribosomal exit tunnel on folding of nascent proteins with a focus on what going on after the translation is complete and the polypeptide chain is no longer bound to the PTC. In contrast to the growth of the polypeptide chain during translation, which is, to some extent, quite steady and predetermined, the subsequent process in which the full length protein escapes from the exit tunnel is stochastic with much less controls by the ribosome. We are interested in how the confined geometry of the exit tunnel and its interaction with nascent proteins influence their escape and folding processes. The aim is also to elucidate the interplay between these two processes and its dependence on temperature. With an attempt to map the dynamics of the escape process to one-dimensional diffusion model, we would like to make the problem general and predictable. We will confine ourself to an idealized model of the ribosomal tunnel, in the form of a hollow cylinder, with an assessment that the detailed shape of the tunnel also plays some role but is less substantial. The proteins are considered in a coarse-grained Go-like model Go . These simplified models and molecular dynamics method combined with umbrella sampling Torrie allow us to obtain a comprehensive picture of the non-equilibrium characteristics of the folding and the escape processes, as well as equilibrium characteristics such as effective free energy along the tunnel axis. We will consider two small single-domain proteins of approximately the same size but different native state topology for comparison. The interaction of the tunnel with proteins will be modeled by putting attractive sites on the tunnel wall with a potential homologous for all amino acids, as a first order approximation.
The remaining of the paper is organized as follows. Section 2 provides a detailed description of the coarse-grained models used for the proteins and for the exit tunnel. Section 3 provides the results on folding and escape of nascent proteins at the exit tunnel along with a diffusion description for the escape process and the effects of attractive sites. Section 4 contains a discussion of the results. Section 5 provides a conclusion. Details of the simulation methods are given in Appendices A and B.
II Models
In spite of their simplicity, Go-like models Go have been surprisingly successful in capturing the protein folding mechanism HoangJCP1 ; HoangJCP ; Clementi ; Baker . In the version of Go-like model considered in the present study, each amino acid is represented by a single bead located at position of Cα atom. The potential energy of a given protein conformation is given by:
| (1) | |||||
where is the number of beads; is the distance between beads and ; and are bond and dihedral angles associated with the residues; the star superscript corresponds to the native state; is equal to 1 if there is a native contact between and and equal to 0 otherwise. A native contact is defined if the distance between two residues in the native state is less than 7.5 . The first three terms of Eq. (1) correspond to the bonding potentials, bond angle potentials and dihedral angle potentials, respectively. The last two terms correspond to Lennard-Jones (LJ) potentials for native contacts and repulsive potentials for non-native contacts. The choice of LJ potential is such that the native distance between residues in a native contact corresponds to the potential minimum, i.e. . In simulations, a native contact is said to be formed if . is the depth of the LJ potential and sets the energy unit. Following Ref. Clementi , the parameters chosen for our model are , , , , , and .
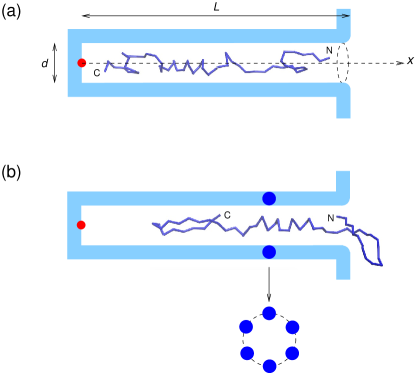
We model the exit tunnel as a half-close cylinder of length and diameter with an open bottom attached to a planar wall Thuy (Fig. 1). The latter mimics the ribosome outer surface and is repulsive to all amino acids. The tunnel is assumed to be centered along the axis, whose origin is also the position of the peptidyl transferase center (PTC). The nascent chain is grown to its full length from the PTC, and escapes from the tunnel through the open bottom. We will consider two models of the tunnel: a purely repulsive one and the one with attractive sites. In the first model (Fig. 1a), the interaction between the tunnel wall and an amino acid residue is given by a repulsive truncated soft-core potential:
| (2) |
where and is equal to the shortest (radial) distance from the residue to the cylinder’s wall plus 2.5 . The added distance of 2.5 corresponds to the Van der Waals (VdW) radius of a virtual ‘residue’ embedded in the tunnel’s wall, assumed to be approximately of the same size as that of amino acid. The same potential as given in Eq. (2) is used for the amino acid repulsion by the planar wall and the tunnel exit port. In the second model (Fig. 1b), attractive sites are occupied by residues of VdW radius of 2.5 tangent to the tunnel wall’s inner surface and equally spaced on a ring perpendicular to the tunnel axis at . The number of attractive sites, , is equal to either 4 or 6 in the present study. The residues at the attractive sites interact with amino acids via LJ potential:
| (3) |
where is the distance between an attractive site and an amino acid.
The Langevin equations of motion for amino acids are integrated by using Molecular Dynamics (MD) method with Verlet algorithm (Appendix A). In the simulations, the unit of time is , where is the mass of amino acid (supposed to be uniform for all amino acids). Temperature is given in units of . The friction coefficient of an amino acid is given in units of . The free energy profiles of protein at the exit tunnel are calculated by using the combined umbrella sampling technique Torrie with the weighted histogram method Ferrenberg ; Kumar (see Appendix B). In the free energy calculation, a periodic boundary condition with a box size equal to 10 is applied in directions perpendicular to the axis for (the space outside the tunnel).
The folding time and the escape time of protein are measured from the moment the full length protein is released from the PTC. The protein is said to be folded when all the native contacts are formed, and to be escaped when the number of amino acids out side the tunnel, , is equal to the total number of residues, . The median folding time, , and the median escape time, , at a given temperature are determined from multiple independent simulations (500-1000 trajectories).
III Results
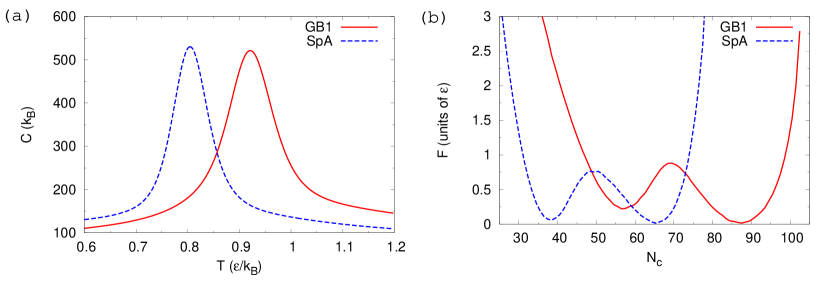
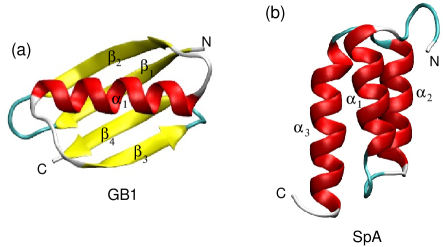
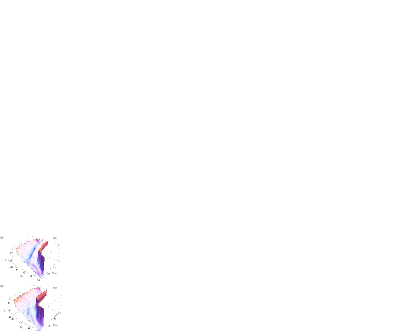
We will consider two small proteins: the B-1 domain of protein G (GB1) of length , and the Z domain of Staphylococcal protein A (SpA) of length . The native states of these two proteins are shown in Fig. 2. Our equilibrium simulations for GB1 and SpA without the tunnel indicate that they both have a two-state folding transition as displayed by a sharp specific heat peak and a bimodal free energy profile near the folding transition temperature (Fig. S1 of supplemental material supp ). The folding temperature, , defined as the temperature of the maximum of the specific heat peak, is found to be equal to 0.922 and 0.804 for GB1 and SpA, respectively, in units of .
III.1 Folding and escape at a purely repulsive tunnel
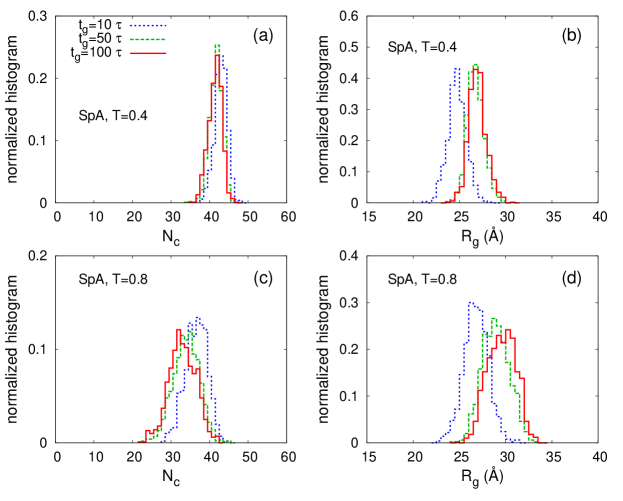
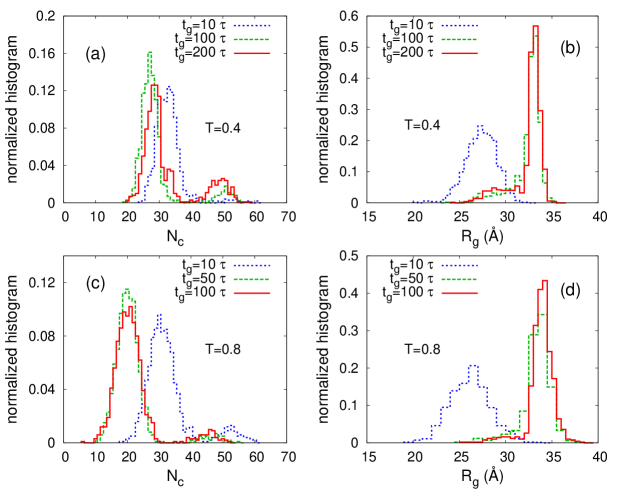
We first study folding and escape of the proteins at a purely repulsive tunnel. The simulations start with a cotranslational protein folding inside the tunnel with a steady growth of the polypeptide chain. The translation speed is set by – the time needed for the chain elongation of one amino acid. Protein synthesis in vivo typically takes times of several orders of magnitude longer than the refolding time of a free protein in solution. Such a realistic translation time cannot be reached by our simulations. Yet, we find that moderate translation times up to about 10 times of the minimum refolding time are sufficient to yield a protein conformation ensemble similar to that would be obtained by a much slower translation. Fig. 3 shows histograms of conformations as functions of the number of native contacts and the radius of gyration obtained by multiple independent growth simulations for protein GB1 at several growth speeds at two different temperatures lower than . For both temperatures, it is shown that can be considered as a fast translation as it yields conformations that contain more native contacts and are significantly more compact than those obtained with larger . However, the histograms quickly converge as is increased to about 100. At , the histograms are similar for and indicating that the effect of slow translation can be captured already at . At , even is sufficient to yield slow translation conformations. Similar analysis for the helical protein SpA (Fig. S2 of supplemental material supp ) indicates that the growth with can be considered as a slow translation. Note that total growth time for for GB1 is about 12 times larger than its minimum refolding time.
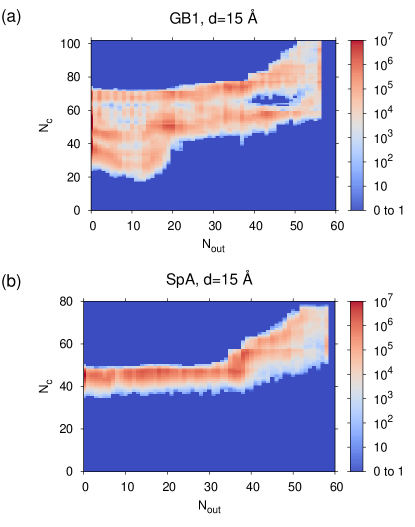
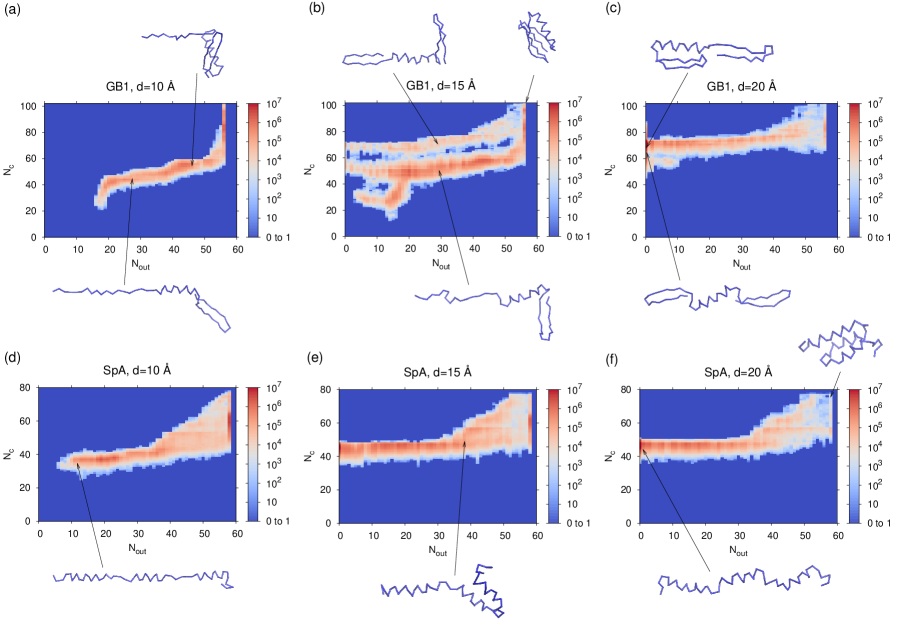
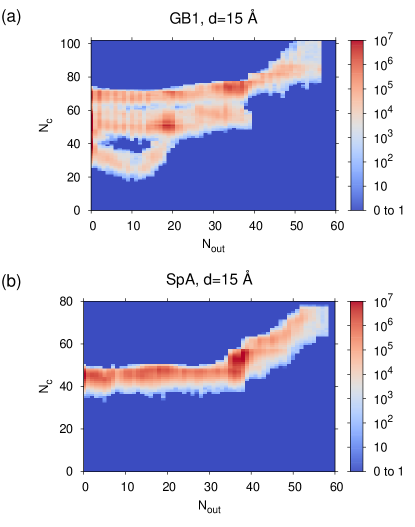
After the translation is complete, the nascent protein is released from the PTC and continues to fold while escaping from the exit tunnel. To elucidate how the folding and the escape take place at the exit tunnel, we calculated two-dimensional histograms of conformations in multiple folding trajectories as a function of the number native contacts, , and the number of amino acid outside the tunnel, . These histograms at a low temperature of are shown in Fig. 4 for the two proteins, GB1 and SpA, and for three different values of tunnel diameter (only in this figure, is varied for comparison). For all cases, it is shown that a large portion of native contacts is formed when the protein is found completely or almost completely inside the tunnel (small ). As increases, the number of native contacts generally also increases indicating a concomitance between folding and escape. The chain is completely folded only when all amino acids are outside the tunnel. For GB1, the folding mechanism is found to be strongly dependent on the tunnel diameter . For , due to the narrow confinement, only the -helix can form inside the tunnel. For , both the -helix and the -hairpin can form inside the tunnel, but the latter is not always seen. For this diameter, folding proceeds through two distinct pathways depending on whether the C-terminal -hairpin is formed inside the tunnel or not (Fig. 4b), as also shown in Ref. Thuy for a different growth rate. For , a partial tertiary structure formed by an -helix and -hairpin is also found inside the tunnel (Fig. 4c). For SpA, the folding mechanism does not depend on . Folding of this protein proceeds through a single pathway, with a formation of all the -helices followed by successive formation of tertiary contacts as the protein gradually escapes from the tunnel. The relatively simpler folding mechanism obtained for SpA comparing to GB1 is due to the fact that SpA has only -helices which can easily form inside the tunnel. We find that as temperature is increased to , the folding mechanisms of the two proteins remain the same but the histograms are more spread indicating an increased stochasticity of the pathways.
Experimental studies have indicated that the -helix and the -hairpin can form inside the ribosomal exit tunnel, while such a possibility is very limited for subdomain tertiary structures Deutsch2005 ; Deutsch2009 . Among the three diameters of the tunnel considered, shows a folding behavior the most consistent with these experimental evidences. is too small for formation of the -hairpin, while is too large to inhibit the formation of tertiary structure inside the tunnel. Thus, for the remaining of our study, we will consider only the case of .
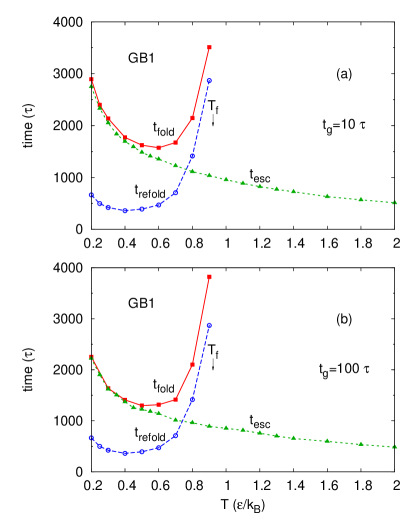
Fig. 5 (a and b) show the temperature dependence of the folding time and the escape time for protein GB1 at the exit tunnel for two different growth speeds of the growth time per amino acid and 100. For comparison, we have calculated also the median refolding time, , from unfolding and refolding simulations without the tunnel. The unfolding was done at yielding extended conformations (). It is shown that is significantly longer than , while both has the characteristic U-shaped dependence on temperature. For refolding without the tunnel, the temperature of the fast folding, , is found to be about 0.4 . For the folding at the tunnel, is about 0.6 and 0.5 for and 100, respectively. Thus, is shifted towards higher temperature in the presence of the tunnel. This shift suggests that the tunnel strongly affects the folding kinetics at low temperatures. The effect of the tunnel can be seen more clearly by comparing the folding time and the escape time. Fig. 5 also shows the temperature dependence of the median escape time, . At low temperatures, the folding time is only slightly larger than the escape time, indicating that folding is concomitant with the escape process. This concomitance means that that most of the native contacts form during the escape process, and the final stage of folding corresponds to an establishment of a few contacts when the last residue gets out from the tunnel. As temperature increases the difference between and also increases, suggesting a deteriorating concomitance between folding and escape. Note that diverges as approaches the folding temperature while continues to decrease monotonically with . Fig. 5 also shows that the slow translation with leads to shorter escape times and folding times than the fast translation with , but the qualitative picture of their temperature dependence is the same for the two cases.
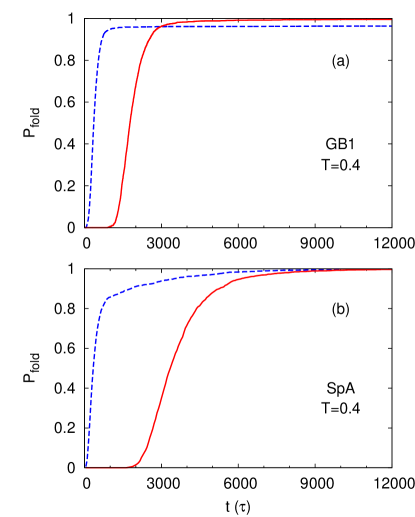
Interestingly, the folding efficiency is enhanced in the presence of the tunnel, at least for one of the proteins considered. Fig. 6a compares the probabilities of successful folding, , as functions of time for GB1 at for two cases: folding at the tunnel and refolding without the tunnel. In the former case, increases more slowly with time but finally reaches a value close to 1 at sufficiently long time. On the other hand, for refolding without the tunnel can only reaches 0.96 at the time limit shown in the figure (). For SpA, reaches 100% for both the folding at the tunnel and refolding without the tunnel, after about (Fig. 6b).
The above dynamical analysis shows that at low temperatures, such as , the folding and the escape processes are concomitant with some variations due to the stochasticity of the two processes. Interestingly, our equilibrium free energy calculations based on umbrella sampling of protein conformations along the exit tunnel also confirm this scenario. Fig. 7a shows a free energy surface as function of number of native contacts and then number of escaped amino acids for GB1 at . One can see that there are two channels separated by a significant barrier on the free energy surface corresponding to the two dynamical pathways shown in Fig. 4b. Remarkably, the free energy landscape also shows that the two pathways are downhill and without kinetic traps. Fig. 7b shows that for SpA, there is single pathway along the steepest descent route in the free energy surface at , consistent with the dynamical pathway shown in Fig. 4e. This pathway is also downhill and contains no kinetic traps.
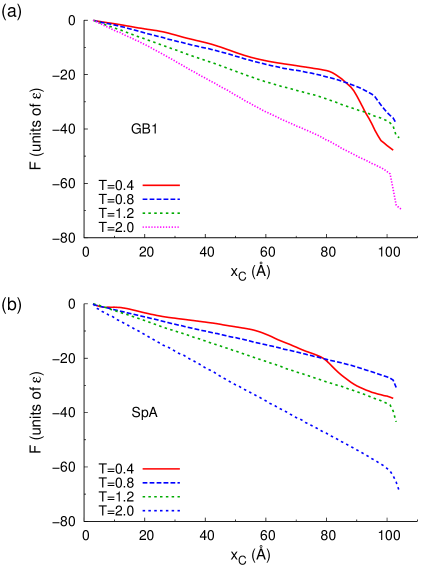
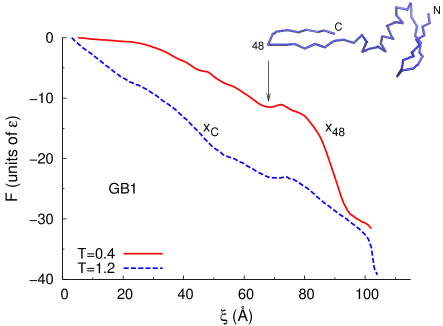
It is convenient to plot the free energy as a function of a single coordinate along a given pathway. For GB1, our choices of such a coordinate are the coordinate of the C-terminus () for the pathway, in which the C-terminal -hairpin is not formed, and that of the 48th residue in the sequence () for the other pathway, in which the -hairpin is formed. These coordinates are chosen because, on average, the selected residues are the latest ones to escape from the tunnel in the two pathways, respectively. For SpA, is chosen as the coordinate for its only pathway. These coordinates are restrained in our umbrella sampling simulations. Fig. 8a shows the free energy profiles for the dominant pathway of GB1, obtained by umbrella sampling at four different temperatures: , 0.8, 1.2 and 2.0 . It is shown that for all temperatures considered, is a smoothly decreasing function of with a slope strongly dependent on temperature. For temperatures higher than , such as and , the dependence of on is almost linear over the range of inside the tunnel. This is due to the fact that the protein is unfolded at these temperatures and the main contribution to the free energy comes from the entropy of the escaped part of the chain. On the other hand, as temperature decreases below , i.e. and , the slope of the curve varies and depends on the position, suggesting an increasing role played by the folding of the protein. At these temperatures, the potential energy of the chain mainly contributes to the free energy. Note that the free energy difference between the fully escaped conformation () and the initial conformation () depends non-monotonically on temperature. For the four temperatures shown, this free energy difference is the smallest for because this temperature is the closest to (0.922), at which the effects of entropy and enthalpy are likely to annihilate each other. Similar scenario is seen for SpA (Fig. 8b).
III.2 Diffusional description of the escape process
The method of mapping complex dynamics into low dimensional diffusion models is a powerful technique traditionally used in physics and chemistry, such as for calculating the rate of chemical reaction Kramers , for the analysis of mean first passage time Zwanzig and for identification of reaction coordinates Edwards ; Peters . The free energy profiles shown in Fig. 8 are the potentials of mean force acting on the C-terminus of nascent protein. Their monotonic behavior suggests that the escape process may be described as a drift in an one-dimensional potential field. Consider diffusion of a particle in a potential field , which is described by one-dimensional Smoluchowski equation given by Nitzan :
| (4) |
where is a conditional probability density of finding the particle at position and at time , given that it was found previously at position at time ; and are partial time and space derivatives, respectively; is diffusion constant, assumed to be position independent; and is the inverse temperature. For conventional diffusion in viscous fluids, satisfies the Einstein-Smoluchowski relation in the form of a fluctuation-dissipation theorem Nitzan :
| (5) |
where is the friction coefficient. If is a linear potential on the position:
| (6) |
then the Eq. (4) has a solution given by:
| (7) |
given that the initial condition is . From the above solution one gets the mean displacement of the particle:
| (8) |
with as diffusion speed. The distribution of escape time of a nascent protein from the tunnel of length can be given as , from which one obtains a mean escape time:
| (9) |
and the standard deviation:
| (10) |
The ratio between and is found to be independent of the diffusion constant:
| (11) |
The median escape time, , is defined by the following equation:
| (12) |
It can be easily shown that , while the dependence of on is not trivial. In the simulations, due to the use of time cut-offs, the median escape time can be calculated more conveniently and more accurately than the mean escape time.
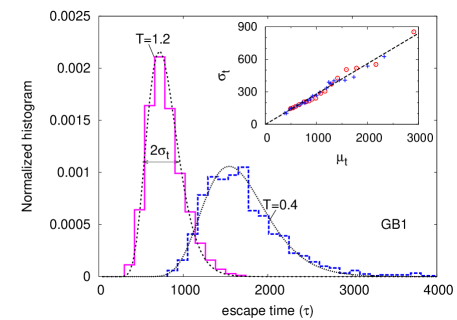
Fig. 9 shows that the distributions of escape time calculated from our simulation data can be fitted well to the theoretical distribution function given in Eq. (7). Interestingly, we have found that the standard deviation of the simulation escape times, , depends linearly on their mean value (Fig. 9, inset). By fitting the data to Eq. (11) with , we find that and is approximately constant for various temperatures, and does not depend on the translation speed (Fig. 9, inset). Thus, is a linear function of . Note that the linear form of as well as its dependence on temperature roughly agree with the shape of the potentials of mean force obtained by umbrella sampling simulations shown in Fig. 8.
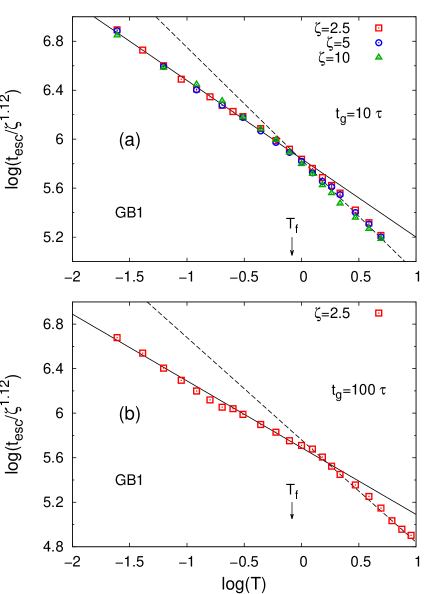
We found that the escape times obtained from the simulations at different temperatures and different friction coefficient follow a common power law dependence given by:
| (13) |
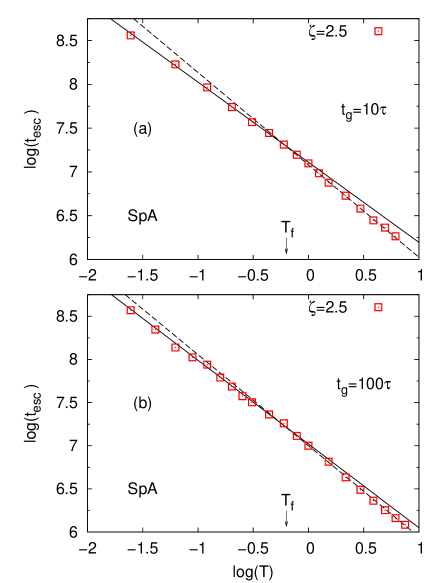
where the exponent depends on the protein and on the temperature regime, which is either lower or higher than the folding temperature . Fig. 10a shows this power law dependence for GB1 with for , and for for fast translation with . The collapse of the data for different values of friction coefficient suggests that the simulations are done in the overdamped limit Klimov . The smaller exponent for temperatures below the folding temperature suggests that diffusion in this regime is facilitated by the folding of the protein. If the protein was unfolded, the escape time in these temperature range would be longer, as can be seen by extrapolation of the power law for the higher temperature regime to the lower temperature regime (dashed line in Fig. 10). Similar results are found for slow translation with (Fig. 10b), in which the exponent in the high temperature regime is the same as in the case of fast translation () while it is somewhat smaller in the low temperature regime (). Fig. 11 confirms the power law dependence for protein SpA with the exponent equal to 0.915 and 1.005 for the low and high temperature regimes, respectively, in the case of fast translation. For slow translation, is equal to 0.97 and 1.005, respectively. Again, the diffusion of SpA at low temperatures is also facilitated by the folding of this protein, but not as much as for GB1. The larger exponents found for SpA than for GB1 suggest that diffusion of helical proteins is slower than -sheet containing proteins. This reflects the fact that -sheets, particularly hairpins, are much more difficult to form inside the tunnel than -helices. Therefore, -sheets are much more favorable when found outside the tunnel, leading to an increased escape rate in comparison to -helices.
The data on escape times reveal the dependence of diffusion constant on temperature and friction coefficient. Because the diffusion speed should be proportional to the inverse of escape time, one obtains:
| (14) |
Since is approximately constant in the present case of a purely repulsive tunnel, the behavior of is expressed as in the r.h.s. of Eq. (14). The variation of the exponent from the Einstein’s value of one underscores for the change of protein conformation during the escape process. Note that the dependence of on friction coefficient is slightly stronger than that of the Einstein-Smoluchowski relation. This enhancement in the exponent of can be understood as due to additional friction between nascent protein and the tunnel wall.
III.3 Effects of attractive sites
We proceed now to consider the tunnel with attractive sites. Remind that our model has several attractive sites located on the tunnel’s wall at 30 inwards from the tunnel exit (Fig. 1b). The positions of the attractive sites were chosen such that they roughly coincide with the position of the free energy minimum calculated for amino acids along the tunnel as shown in Fig. 3 of Ref. Pande2008 . In our model, these attractive sites attract all amino acids, therefore will certainly slow down the escape of nascent protein from the tunnel. The question we ask is how the folding of protein at the exit tunnel and how the diffusion characteristics of the escape process are affected by attractive sites. For simplicity, we consider only the case of fast translation with for the proteins at the tunnel with attractive sites, with an assessment that the results of slow translation are qualitatively similar.
Our simulations show that the attractive sites can change the folding pathway of GB1 while they have no such effect on SpA. Fig. 12a shows the histogram of conformations obtained in multiple folding trajectories at the tunnel with 6 attractive sites for GB1 at . In contrast to the two distinct pathways found for the case of a purely repulsive tunnel (Fig. 4b), one can see that in Fig. 12a, there is only one pathway that exits from the tunnel. This pathway corresponds to conformations in which the C-terminal -hairpin of GB1 is formed within the tunnel. For the tunnel with 4 attractive sites (Fig. S3 of supplemental material supp ), the second pathway, in which the C-terminal -hairpin is not formed in the tunnel, still exists but is populated by fewer trajectories than in the case of a purely repulsive tunnel. Thus, the attractive sites promote formation of -sheet inside the tunnel. In the case of SpA, the -helices are easily formed inside the tunnel even without the attractive sites, therefore the latter induces no change on the folding pathway (Fig. 12b). However, since the attractive sites keep the protein longer with the tunnel, they give more chance for the helices to form. Note that for both proteins, the histograms for the tunnel with attractive sites are less spread near the full escape () than for a purely repulsive tunnel indicating that the concomitance between folding and escape is increased in presence of the attractive sites. So the overall effects of attractive sites are an enhancement of secondary structure formation inside the tunnel and an improved vectorial folding.
The escape times are found to be increased in the presence of the attractive sites. The slowdown of escape due to the attractive sites can be understood by looking at the free energy profiles shown in Fig. 13 for GB1. A small free energy barrier is seen on the escape route of the upper pathway (in which the C-terminal -hairpin is formed) for indicating that the attractive sites hamper the escape process at the final stage. This hampering would allow a large portion of tertiary contacts to form before the final release of the protein from the exit tunnel. This barrier almost disappears for temperature higher than (the case of in Fig. 13) as a result of a weaker interaction between the attractive sites and the unfolded protein and an increased role of entropy.
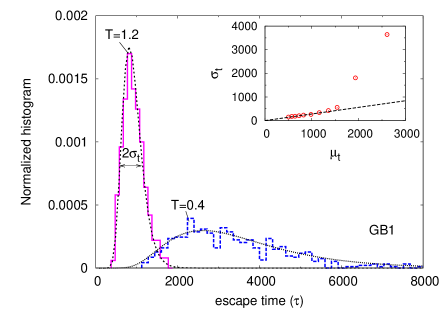
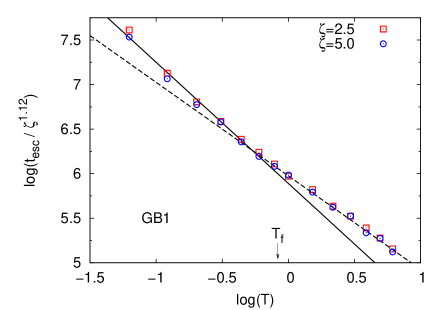
Fig. 14 shows that the escape process can be still relatively well described by the one-dimensional diffusion model for the tunnel with attractive sites still. It is shown that the distribution of escape time can be fitted to the theoretical distribution as given in Eq. (7). The linear dependence of the standard deviation of the distribution on the mean escape time, however, is true only at high temperatures or equivalently for low (Fig. 14, inset). At low temperatures, this dependence becomes non-linear with the standard deviation increased much faster than the mean. As a result, the distribution at low temperatures, such as at as shown in the figure, is much more expanded than it would be, based on a linear projection from high temperature distributions. Effectively, the parameter of the effective potential field for the diffusion is not constant for the tunnel with attractive sites.
Fig. 15 shows that the dependence of the median escape time on temperature and the friction coefficient still follows the power law given in Eq. (13), but with larger exponents than in the case of a purely repulsive tunnel for both low and high temperature regimes. Note that the exponent for the low temperature regime () is now larger than that for the high temperature regime () in the case of a tunnel with attractive sites. The higher exponent at low is also a manifestation of the negative effect of attractive sites on diffusion. For the repulsive tunnel, we have shown that the folding of nascent proteins induces a faster escape from the tunnel. Here, the escape is slower due to the competition from the attractive sites that prevails the effect of folding.
The increase of escape time as well as the expansion of its distribution at low temperatures can be understood as due to an increasing impact of the free energy barrier shown in Fig. 13. At very low temperatures, it is expected that the escape rate is limited by an activated diffusion through this barrier. In that case, the escape time should grow exponentially with the inverse temperature Kramers ; Klimov . In the temperature range studied, however, we have not yet observed this exponential slow-down.
IV Discussion
Protein cotranslational folding has been mainly discussed in the literature as attributed to vectorial folding of nascent proteins resulted from the growth of the polypeptide chain during translation Baldwin . Here, we show that vectorial folding is also induced by the ribosomal exit tunnel after the translation is complete, as the nascent protein gradually escapes from the tunnel. Since simple secondary structures can form inside the tunnel (though with some difficulty for the -hairpin), the vectorial folding induced by the tunnel mainly applies to the formation of the tertiary structures. On the other hand, for small single-domain proteins, such as the ones considered in the present study, the vectorial folding due to translation would apply only to the secondary structures, because a full length protein would still fit inside the tunnel when the translation is complete. For large multi-domain proteins, both the peptide elongation and the escape from the tunnel are expected to give rise to vectorial folding of protein tertiary structures. Our results are in agreement with a previous simulation study Elcock of on-ribosome folding with a more realistic model of the exit tunnel, which showed that single-domain proteins fold post-translationally. The different effects of cotranslational folding on single- and multi-domain proteins have been also shown in Ref. Elcock .
Post-translational vectorial folding at the tunnel would not happen if the escape time is much shorter than the relaxation time of the protein. In such a case, the protein would be still largely unfolded when the escape is complete. Folding would be concomitant with the escape process only if the latter is sufficiently slow, so that the chain has enough time to relax during the escape. Our simulations showed that, for temperatures about or lower than – the temperature of the fastest folding in presence of the tunnel, the escape time is significantly longer than the refolding time, thus, allows for concomitant folding and escape at the tunnel. The fact that vectorial folding induced by the tunnel happens at low temperatures is beneficial for nascent proteins because it would help the protein to avoid kinetic traps Bryngelson which are easy to be encountered at low temperatures. The escape time is expected to depend on the tunnel size and shape. In fact, our simulations indicate that the escape time increases with the tunnel diameter and length (detailed analysis will be given elsewhere). It is an interesting question of whether the ribosomal tunnel’s detailed size and shape have been selected by Nature for a facilitated vectorial folding of nascent proteins at the tunnel by mediating their escape time.
Denatured proteins typically refold to their native states through multiple pathways in a rugged energy landscape Bryngelson ; Dill ; HoangJCP . Here, we show that folding at the tunnel proceeds along a single or at most a few pathways in a much reduced conformational space. This dramatical reduction in the number of conformations and the number of pathways is a key factor in helping nascent proteins to avoid kinetic traps. Our free energy calculations also showed explicitly that the pathways at the tunnel are downhill without kinetic traps. Remarkably, our simulations also showed that, at least for protein GB1, the folding efficiency in presence of the tunnel is improved in comparison to that without the tunnel. This result is in agreement with recent experiments which indicated that the ribosome promotes correct folding of nascent proteins Bustamante ; Ugrinov .
Our finding that the escape process can be mapped to an one-dimensional diffusion model in an effective linear potential could be verified experimentally and may be useful for studying the interactions between nascent protein and the exit tunnel. We have shown that, in the case of the tunnel without attractive sites, folding facilitates the escape process, as expressed by a lower exponent for the diffusion at temperatures lower than the folding temperature than for that at higher temperatures. In contrast, for the tunnel with attractive sites, the exponent is higher in the low temperature range. The attractive sites also lead to a non-linear dependence between the standard deviation and the mean value of the escape time at low temperatures. Thus, interactions of nascent proteins with the tunnel strongly affect the dynamics of their escape from the tunnel. An analysis of escape rates, that would be obtained by experiments, may reveal about these interactions.
While the geometry of the ribosomal exit tunnel has been precisely determined Voss , its detailed interactions with nascent proteins are still under ongoing research. In a recent study, Pande and coworkers Pande2008 calculated free energy profiles for single amino acids in the exit tunnel and found that a large free energy barrier (up to about 7 ) near the exit port is commonly observed for most of the amino acids, despite the differences in their side-chain chemico-physical properties. They suggested that this exit barrier is relevant to a gate-latch mechanism involving ribosomal protein L39 of the exit tunnel. Our result for the tunnel with attractive sites also yields a free energy barrier for the nascent proteins. Our analysis suggests that the role of this barrier is to slow down the escape process of nascent proteins, thus strengthens the condition for vectorial folding at the exit tunnel. The net effect of this barrier is an enhanced foldability of the released protein and minimizing the chance of aggregation.
V Conclusion
Folding of nascent proteins at ribosomal exit tunnel has been studied in simple models. We have shown that the ribosomal exit tunnel has several strong effects on the dynamics of nascent proteins. First, it induces vectorial folding with improved folding efficiency by allowing the nascent chain to gradually escape from the tunnel. This vectorial folding is concomitant with the escape process and happens only at a low temperature range favorable for folding. Second, folding at the tunnel follows a single or a few pathways allowing the protein to avoid kinetic traps. Third, the escape process can be characterized as one-dimensional diffusion of a particle in an effective linear potential field which depends on the condition for folding, such as temperature, and the interaction of nascent protein with the exit tunnel. It was shown that folding speeds up the diffusion, whereas attractive interactions between the nascent protein and the tunnel wall slow it down. -helical protein also tends to escape more slowly than -sheet containing protein. We have also shown that a slow escape from the tunnel is better for vectorial folding, and consequently improves folding efficiency. Thus, the ribosome may impose large free energy barrier along the escape route of nascent protein at the exit tunnel, for the purpose of enhancing protein foldability and preventing early release of unfolded nascent proteins.
ACKNOWLEDGEMENT
This research was supported by Vietnam National Foundation for Science and Technology Development (NAFOSTED) under Grant No. 103.01-2013.16. The simulations were carried out using the High Performance Computing facilities at Center for Informatics and Computing of VAST.
Appendix A: Langevin dynamics with Verlet algorithm
Simulations are carried out using molecular dynamics method with Langevin equations of motion. For a given bead, the Langevin equation in one dimension is given by:
| (15) |
where is the position of a bead, is its mass (assumed to be equal for all amino acids), is the molecular force acting on the bead and is the friction coefficient. is a random force induced by the solvent in form of a white noise with zero mean, , and the time auto-correlation function satisfying the fluctuation-dissipation theorem:
| (16) |
where is absolute temperature.
A Verlet algorithm is developed to numerically integrate the Langevin equations of motion. The position at time is given by:
| (17) | |||||
where is the integration time step. Because , Eq. (16) is given in a discrete form given by:
| (18) |
where is Kronecker’s delta function and is an integer. Temperature is given in units of , whereas time is measured in units of . The integration step is taken to be . Typical simulations are done with friction coefficient .
Appendix B: Umbrella sampling
To sample protein configurations that are partially located inside the tunnel, umbrella sampling technique Torrie is employed. One carries out simulations at a set of temperatures with the following restraint potentials acting on a given residue of the protein:
| (19) |
where is the -coordinate of the residue, are restraint parameters chosen to be in the range of (stronger restraint is applied near the exit port), and are another restraint parameters of values chosen between and . For GB1, the restrained residue is chosen to be either the last residue (the C-terminus) or the 48th amino acid in the sequence for the efficient sampling along the two pathways (see Fig. 4b), respectively. For SpA, only the C-terminus is being restrained.
The free energy (or potential of mean force) can be calculated using the weighted histogram method with the WHAM equations given by Ferrenberg ; Kumar :
| (20) |
and
| (21) |
where is the energy of protein conformation without counting restraint potential, is the histogram collected in simulation , is the total number of snapshots in simulation , and is the inverse temperature. are calculated from Eqs. (20, 21) self-consistently. Assume that corresponds to , the free energy of an unrestrained protein as function of at a given temperature is given by:
| (22) |
The dependence of on other coordinates, such as the number native contacts, , and the number of escaped amino acids from the tunnel, , can be calculated from an weighted probability based on the histograms collected along these coordinates in addition to and :
| (23) |
References
- (1) C. M. Dobson, Nature 426, 884 (2003).
- (2) J. Frydman, Annu. Rev. Biochem. 70, 603–647 (2001).
- (3) L. D. Cabrita, C. M. Dobson, and J. Christodoulou, Curr. Opin. Struct. Biol. 20, 33-45 (2010).
- (4) J. L. Lu, and C. Deutsch, Nat. Struct. Mol. Biol. 12, 1123–1129 (2005).
- (5) A. Kosolapov, and C. Deutsch, Nat. Struct. Mol. Biol. 16, 405-411 (2009).
- (6) A. N. Fedorov and T. O. Baldwin, J. Biol. Chem. 272, 32715 (1997).
- (7) K. G. Ugrinov and P. L. Clark, Biophys. J. 98, 1312 (2010).
- (8) C. M. Kaiser, D. H. Goldman, J. D. Chodera, I. Tinoco Jr., and C. Bustamante, Science 334, 1723 (2011).
- (9) M. S. Evans, I. M. Sander, P. L. Clark, Mol. Biol. 383, 683 (2008).
- (10) I. E. Sanchez, M. Morillas, E. Zobeley, T. Kiefhaber, and R. Glockshuber, J. Mol. Biol. 338, 159 (2004).
- (11) C. Anfinsen, Biochem. J. 128, 737 (1972).
- (12) J. Frydman, H. Erdjument-Bromage, P. Tempst, F. U. Hartl, Nat. Struct. Biol. 6, 697 (1999).
- (13) G. Zhang, M. Hubalewska, and Z. Ignatova, Nat. Struct. Mol. Biol. 16, 274 (2009).
- (14) E. Siller, D. C. DeZwaan, J. F. Anderson, B. C. Freeman, and J. M. Barral, J. Mol. Biol. 396, 1310 (2010).
- (15) D. A. Nissley and E. P. O’Brien, J. Am. Chem. Soc. 136, 17892 (2014).
- (16) E. P. O’Brien, M. Vendruscolo and C. M. Dobson, Nat. Commun. 5, 2988 (2014).
- (17) D. Marenduzzo, T. X. Hoang, F. Seno, M. Vendruscolo and A. Maritan, Phys. Rev. Lett. 95, 098103 (2005)
- (18) N. R. Voss, M. Gerstein, T. A. Steitz, and P. B. Moore, J. Mol. Biol. 360, 893 (2006).
- (19) P. M. Petrone, C. D. Snow, D. Lucent, and V. S. Pande, Proc. Natl. Acad. Sci. USA 105, 16549-16554 (2008).
- (20) H. Nakatogawa, and K. Ito, Cell 108, 629 (2002).
- (21) H. Nakatogawa, and K. Ito, Chem. Bio. Chem. 5, 81 (2004).
- (22) J. Dresios, I. L. Derkatch, S. W. Liebman, and D. Synetos, Biochemistry 39, 7236-7244 (2000).
- (23) G. Ziv, G. Haran, and D. Thirumalai, Proc. Natl. Acad. Sci. USA 52, 18956 (2005)
- (24) S. Kirmizialtin, V. Ganesan, D. E. Makarov, J. Chem. Phys. 121, 10268 (2004).
- (25) A. H. Elcock, PloS Comp. Biol. 2, 0824 (2006).
- (26) M. Chwastyk, and M. Cieplak, J. Phys.: Condens. Matter 27, 354105 (2015)
- (27) N. Go, Annu. Rev. Biophys. Bioeng. 12, 183-210 (1983).
- (28) G. M. Torrie, and J. P. Valleau, J. Chem. Phys. 23, 187 (1977).
- (29) T. X. Hoang, and M. Cieplak, J. Chem. Phys. 112, 6851 (2000).
- (30) T. X. Hoang and M. Cieplak, J. Chem. Phys. 113, 8319 (2000).
- (31) C. Clementi, H. Nymeyer, and J. N. Onuchic, J. Mol. Biol. 298, 937-953 (2000).
- (32) D. Baker, Nature (London) 405, 39 (2002).
- (33) B. P. Thuy, and T. X. Hoang, Comm. Phys. 23, 219 (2013).
- (34) A. M. Ferrenberg, and R. H. Swendsen, Phys. Rev. Lett. 63, 1195-1198 (1989).
- (35) S. Kumar, D. Bouzida, R. Swendsen, P. Kollman, and J. Rosenberg, J. Comput. Chem. 13, 1011–1021 (1992).
- (36) See supplemental material at [URL will be inserted by AIP] for the specific heats and the free energy profiles of GB1 and SpA, histograms of full-length protein conformations obtained by the growth process inside the tunnel for SpA, and histograms of conformations during folding and escape of GB1 and SpA at the tunnel with 4 attractive sites.
- (37) H. A. Kramers, Physica 7, 284 (1940).
- (38) R. Zwanzig, Proc. Natl. Acad. Sci. USA 85, 2029-2030 (1998).
- (39) T. D. Edwards, Y. Yang, D. J. Beltran-Villegas, and M. A. Bevan, Scientific Reports 4, 6132 (2014).
- (40) B. Peters, P. G. Bolhuis, R. G. Mullen, and J.-E. Shea, J. Chem. Phys. 138, 054106 (2013).
- (41) A. Nitzan, Chemical Dynamics in Condensed Phases: Relaxation, Transfer, and Reactions in Condensed Molecular Systems, Oxford University Press (2014).
- (42) D. K. Klimov, and D. Thirumalai, Phys. Rev. Lett. 79, 317 (1997).
- (43) J. D. Bryngelson, and P. G. Wolynes, J. Phys. Chem. 93, 6902-6915 (1989).
- (44) K. A. Dill, and H. S. Chan, Nat. Struct. Biol. 4, 10 (1997).
Supplemental material for: Folding and escape of nascent proteins at ribosomal exit tunnel
Bui Phuong Thuy and Trinh Xuan Hoang