Fe Line Diagnostics of Cataclysmic Variables and Galactic Ridge X-ray Emission
Abstract
The properties of the Galactic Ridge X-ray Emission (GRXE) observed in the 2-10 keV band place fundamental constraints on various types of X-ray sources in the Milky Way. Although the primarily discrete origin of the emission is now well established, the responsible populations of these sources remain uncertain, especially at relatively low fluxes. To provide insights into this issue, we systematically characterize the Fe emission line properties of the candidate types of the sources in the solar neighborhood and compare them with those measured for the GRXE. Our source sample includes 6 symbiotic stars (SSs), 16 intermediate polars (IPs), 3 polars, 16 quiescent dwarf novae (DNe) and 4 active binaries (ABs); they are all observed with the Suzaku X-ray Observatory. The data of about 1/4 of these sources are analyzed for the first time. We find that the mean equivalent width () of the 6.7-keV line and the mean 7.0/6.7-keV line ratio are eV and for intermediate polars and eV and for polars, respectively, which are all substantially different from those ( eV and ) for the GRXE. Instead, the GRXE values are better agreed by the ( eV) and the ratio () observed for the DNe. We further find that the is strongly correlated with the 2-10-keV luminosity of the DNe, which can be characterized by the relation . Accounting for this correlation, the agreement can be improved further, especially when the contributions from other classes sources to the GRXE are considered, which all have low values. We conclude that the GRXE mostly consists of typically faint, but numerous DNe, plus ABs, while magnetic CVs are probably mainly the high-flux representatives of the responsible populations and dominate the GRXE only in harder energy bands.
1 Introduction
Although discovered more than 30 years ago, the exact origin of the Galactic Ridge X-ray Emission (GRXE) observed in the 2-10 keV range remains largely uncertain (e.g., Worrall et al., 1982; Revnivtsev et al., 2009; Hong et al., 2012). The overall spectral shape of the GRXE, with a total 2-10 keV luminosity of , can be approximately characterized as a two-temperature optically thin thermal plasma with keV and keV over the 2 - 50 keV (or keV over 2-10 keV ) range covered by the Suzaku (e.g., Yuasa et al., 2010, 2012). The spectrum of the GRXE also contains emission lines; the three most prominent ones are from Fe K transitions: 6.4-keV line from neutral or weakly-ionized species, 6.7-keV and 7.0-keV lines from Helium-like and Hydrogen-like ions (e.g., Uchiyama et al. 2013). Both the line and continuum properties of the GRXE provide important clues about its origin.
Two scenarios have been proposed to explain the GRXE. The first scenario assumes that the GRXE arises primarily from truly diffuse hot plasma in and near the Galactic disk, while the second proposes that the emission represents a superposition of numerous point-like sources, including their light scattered by the interstellar medium (ISM) (Molaro et al., 2014). The 1 Ms Chandra deep exposure carried out by Revnivtsev et al. (2009) toward the ‘Limiting Window’ in the Galactic bulge successfully resolved out about 80% of the GRXE (at keV) into individual sources with a detection limit down to the 2-10 keV luminosity of at the Galactic center distance of 8 kpc (see also Hong et al. 2012). Furthermore, the spatial distribution of the GRXE closely follows that of the stellar mass in the Galaxy (Revnivtsev et al., 2006). These results strongly support the point source scenario, leaving little room for a substantial contribution from the diffuse hot plasma, probably except for the Galactic center region ( from Sgr A*; e.g., Uchiyama et al. 2011).
However, the nature of the point sources responsible for the GRXE remains elusive. It has been suggested that the dominating source population might be cataclysmic variables (CVs), or more specifically, magnetic ones (mCVs), plus a minor contribution from active binaries (ABs; e.g., Revnivtsev et al., 2009). CVs are binaries, each consisting a white dwarf (WD) accreting matter from a main-sequence or red-giant companion. Based on the magnetic field strengths of the WDs, CVs are classified into magnetic [including polars and intermediate polars (IPs)] or non-magnetic ones [including novae, quiescent dwarf novae (DNe), symbiotic star (SSs), etc.]. Comparatively less luminous are ABs, binaries of normal stars whose X-ray emission is enhanced by strong magnetic field due to spin-orbital coupling. The luminosity functions (LFs) of nearby CVs and ABs were studied by Sazonov et al. (2006); Byckling et al. (2010); Pretorius & Knigge (2012). Based on their LFs, as well as spectral and temporal behaviors (Revnivtsev et al., 2009; Hong et al., 2012), relative bright point sources (with the 2-10 keV luminosity ) observed in the GRXE are mostly considered to be mCVs. The nature of fainter sources, especially those below is much less clear. Individually they are typically too faint to allow spectral and temporal analyses with existing X-ray data. Collectively, the LF of such sources suggests that they contribute more to the GRXE than those bright ones; the sources in the range of , for example, are about 30 times more in numbers than the bright ones and account for 75% of the resolved emission in the 6-8 keV range (Revnivtsev et al., 2009). The LF may, however, vary significantly from the the stellar disk, to the bulge, and to the center of the Galaxy (e.g., Perez et al., 2015). So the consideration of the local LF alone cannot be conclusive with regard to the nature of the sources in the GRXE. Therefore, an improved understanding of the GRXE will be interesting not only for its own right, but for providing fundamental constraints on the integrated properties of various X-ray source populations in the Galaxy as well. These constraints are also essential to the correct estimation and subtraction of the source contributions and hence to the study of diffuse hot plasma in other galaxies (e.g., Li & Wang, 2007).
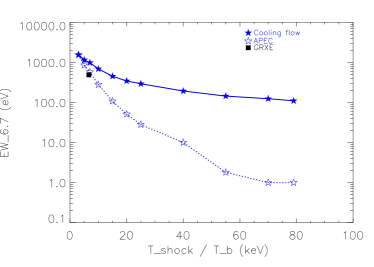
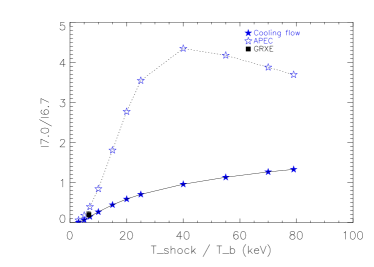
We here focus on the use of the diagnostic Fe K emission lines to probe the nature of the faint sources in the GRXE in the 2-10 keV band. To do so, we first characterize the mean intensities of the emission lines from local sources of various known classes (mCVs, DNe, ABs, SSs, and polars). Specifically, both the EW of the 6.7-keV () and the flux ratio of the 7.0 to 6.7 keV lines () are sensitive probers of hot plasma temperature (; Fig. 1). always decreases, while increases with increasing in the 1-20 keV range. In an mCV, an accretion disk is not expected (at least near the WD); the gravitational potential energy of the infall gas (e.g., in an accretion column) is converted into the heat almost entirely at a standing shock near the surface of the WD (e.g., Longair, 2011). In contrast, for a non-magnetic CV, a cool accretion disk is expected, which radiates about half of the gravitational energy and hardly contributes to the X-ray emission. The other half of the energy, retained in the Keplerian motion at the inner boundary of the disk, can effectively heat the gas when eventually falling onto the WD through the boundary layer. The maximum temperature that the gas can reach depends on the exact heating mechanism (e.g., via a single shock or a series of weaker ones), but should be about a factor of smaller than that for an mCV of same WD mass. This expectation is consistent with existing observations, which show that mCVs generally have smaller and greater than non-magnetic CVs (e.g., Ishida & Ezuk, 1999; Ezuka & Ishida, 1999; Anzolin et al., 2009; Mukai et al., 2009; Ishida et al., 2009). Moreover, unlike the EWs of the Fe lines, is independent of either the metallicity of the hot plasma or the continuum emission, which can be strongly affected by X-ray absorption and/or reflection. Thus provides the most reliable diagnostic of the plasma temperature in the 1-20 keV range. Interestingly, the typical temperature of GRXE falls in this range(Yuasa et al., 2012; Uchiyama et al., 2013), making Fe lines sensitive probes in comparisons among different classes of CVs (with typical temperatures below 20 keV) or with the GRXE.
Additional constraint on the plasma temperature can be obtained from the measurement of the 6.4-keV emission line, which is predominantly from the fluorescence of ionizing photons ( keV) by cold irons. The strength of the line, relative to the other lines or to the continuum, is sensitive to both the temperature of the hot plasma, which produces the photons, and the amount and geometry of the surrounding cool materials. In a CV, for example, about half of the photons are typically intercepted by the WD surface, while additional fluorescence may occur in the accretion column (for an mCV), the accretion disk (non-magnetic CV), or the stellar envelope (SS). For the GRXE, however, the 6.4-keV line emission can be partly diffuse in origin, e.g., due to the fluorescence in dense ISM clouds or to their interaction with low-energy cosmic rays. Therefore, the GRXE can be used to place an upper limit to the overall population of 6.4-keV line-emitting sources in the Galaxy.
Various measurements of the Fe lines exist for local CVs, as well as for the GRXE. Probably the most extensive measurements for the GRXE are made by Uchiyama et al. (2013), who show that the EWs of the lines change systematically from the center to the ridge of the Galaxy. Toward the ridge, eV, eV, eV and ; the errors of these EWs values were not given in Uchiyama et al. (2013) and are estimated from Yuasa et al. (2012), based on similar counting statistics of the lines, although the latter work was based on data collected for the Galactic bulge (specifically, observations taken in the Galactic longitude and latitude ranges and , excluding the very central region of and ). The relative intensities of the lines change systematically from the ridge to the center; in particular, in the ridge increases to in the budge, to in the center of the Galaxy. The value varies strongly with position, especially in the central region, and sometimes with time (e.g., Yuasa et al., 2012; Muno et al., 2007). The () values of the ridge appear to be significantly higher (lower) than those of relatively bright (but unidentified) sources (above ) detected by XMM (Warwick et al., 2014) and those of local mCVs (e.g., Ishida & Ezuk, 1999; Uchiyama et al., 2013). Understanding this apparent inconsistency is a motivation of the work reported here.
We first systematically analyze the Fe emission line properties of local CVs and ABs and then confront the results with the measurements of the GRXE. The existing analyses of local CVs and ABs are rather inhomogeneous, based on data collected with various X-ray telescopes, such as ASCA, Suzaku, Chandra HETG and on different spectral modeling procedures. The sample sizes of the individual analyses are also small (typically less than 20 sources) (e.g., Ezuka & Ishida, 1999; Hellier & Mukai, 2004; Baskill et al., 2005; Rana et al., 2006; Schlegel et al., 2014). Our sample includes 41 CVs and 4 ABs, all observed with Suzaku. The results from our analysis of this sample can then directly be compared with similar Suzaku measurements of the GRXE (with minimum biases), providing new insights into the nature of the responsible source populations. The rest of the paper is organized as follows: In § 2 we describe our sample selection and data analysis methods; We present our results in § 3; We compare them with existing results and discuss the implications in § 4; And finally, in § 5, we provide a summary of the work.
2 Sample Selection & Data Analysis
Suzaku operated between 2005 and 2015. It had four X-ray Imaging Spectrometers (XIS): Three of them were made of front illuminated CCDs (XIS-0, -2 and -3), while the other of back-illuminated one (XIS-1). These spectrometers had the best spectral resolution ( to ) among the similar instruments that have operated in the 0.3-10 keV range. This high resolution is essential to the analysis reported here. The moderate spatial resolution of the instruments is also suited for local CVs and ABs: even though they are relatively bright sources, pile-ups are not an issue.
We cross-correlate the Suzaku online archive with Ritter & Kolb (2003)’s CV catalog and Eker et al. (2008)’s AB catalog to search for available observations. We find 48 publicly available observations on 41 CVs (including 6 SSs, 16 IPs, 3 polars and 16 DNe; multiple observations on several sources) and 4 observations on 4 ABs. The observation log of this source sample is presented in Table 1. One of the DNe, SS Cyg, was undergoing outburst during the observation. Nevertheless, it shows spectral properties similar to those of other DNe and is thus included in our subsequent analysis.
We reprocess the data downloaded from the Suzaku archive, using the software package heasoft (version 12.8.1; Arnaud 1996). Briefly, the event files are reduced with the standard pipeline routine aepipeline and the latest calibration files (XIS:20150312). For each observation, we extract an on-source spectrum and an off-source background spectrum, together with the response matrix (rmf) and effective area (arf) files, using xselect. The on-source spectrum is from a circular region with a typical radius ; however, it is reduced to to for 20 observations, in which the sources are close to CCD edges. The background spectrum is from an annulus with the inner and outer radii equal to and , except for the edges. Our results are not sensitive to the exact selection of the background area (which is always greater than the on-source region), because the sources are all quite bright.
We conduct the spectral analysis, using the xspec software package. The spectra from all XIS chips are jointly fitted to improve the counting statistics. Our focus is on the Fe emission lines and on the spectral shape of the continuum in the 5-10 keV range, which minimizes potential complications due to the thermal emission from the WD surfaces, as well as the absorption by the cold and warm gases at lower energies. Also in this range, the confusion from the emission from diffuse interstellar gas in the galactic disk is negligible (e.g., Yuasa et al., 2012). We model the continuum with the optically thin thermal plasma model apec (with metallicity set to zero) for ease of comparison with previous results on GRXE(e.g., Yamauchi et al., 2009; Yuasa et al., 2012; Uchiyama et al., 2013). This modeling also gives a characteristic plasma temperature () for each source. We emphasize that here is just used to characterize the hardness of the spectral continuum. The shock temperature in the cooling flow model (as used in Fig. 1) would be a more physical quantity comparing to (e.g., when explaining - anti-correlation in Fig. 4, see next section), but were not used to model the spectra of GRXE in previous works(e.g., Yamauchi et al., 2009; Yuasa et al., 2012; Uchiyama et al., 2013) and thus is not used in this work. A detailed analysis of the spectra of sampled sources with the cooling flow model is in preparation. We here mostly use and as two independent line diagnostics of the plasma temperature. Accordingly, we construct a spectral model consisting of three Gaussians, representing the 6.4-keV, 6.7-keV and 7.0-keV lines. The parameters of this model include the centroid energies, widths, and (relative) intensities (, , and ) of the lines. Building the desirable relative intensities of the lines into the model (instead of using the standard normalizations of the individual Gaussians) automatically accounts for their correlations in error measurements. Additionally, the unabsorbed 2-10 keV flux and luminosity of each source are calculated; the latter includes its error in the distance measurements (see Table 1).
For each class of our sample sources, we calculate the means and intrinsic dispersions of each individual parameter (, , , , and ). For each class, we may construct an expected statistic as
| (1) |
where is the total source number, and are the measured value and error of the i-th source, whereas and are the expected mean and standard deviation of the parameter (assuming a normal distribution). The minimization relative to gives the equation:
| (2) |
This equation, together with setting to its expected value (the number of degrees of freedom), allows us to solve for and . The error of can be further calculated from
| (3) |
3 Results
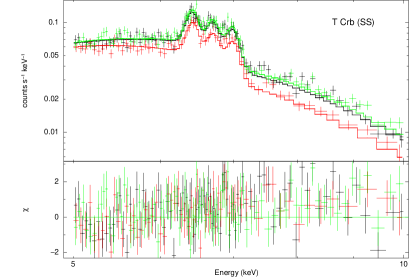
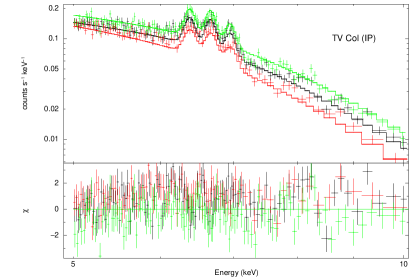
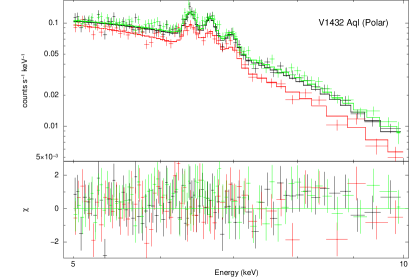
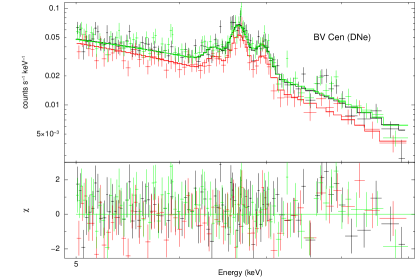
Our main results are summarized in Table 2 and Fig 2 to Fig 8. Fig 3 to Fig 7 includes multiple measurements for sources with multiple observations (see Table 2 for details): SS73-17 (two measurements), XY Ari (two measurements) and VW Hyi (four measurements). Fig 2 shows the spectra, together with the best-fitted models, for four sources as an example for each CV class considered here. The most distinct differences among the spectra are the Fe line ratios: large and for mCVs (polars and IPs), large for the DNe, and exceptionally enhanced 6.4-keV line intensity for the SSs. In general, the model fitting is acceptable, judged from the values. Tables 2 and 3 summarize our results, while following figures illustrate trends and correlations among the measured parameters.
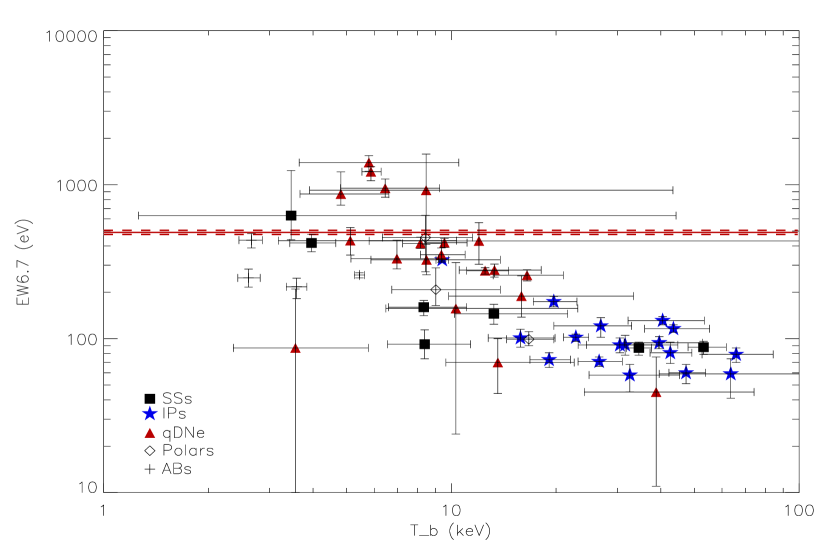
Fig 3 shows an apparent anti-correlation between and , which holds even for individual classes (though with lower significance). Classwise, IPs have the highest (all above keV), while DNe have relatively low (mostly below 15 keV); the mean ratio is about 3, consistent with the expectation from the different accretion (and hence heating) processes between the two classes (§ 1). The polars tend to have lower temperatures, compared to IPs, which is also expected (due to the contribution from relatively soft cyclotron line emission; Longair 2011). Interestingly, none of the IPs has as high as the value measured for the GRXE! While a considerable fraction of DNe in our sample also have similarly small (but with large error bars), the rest seem to be consistent with, or even significantly larger than, the GRXE value; these latter DNe tend to have low . Not surprisingly, ABs tend to have the lowest . But they are not necessarily high in due to their relatively low metallicity (e.g., Berdyugina et al., 1998; Mallick, 1998; Franciosini et al., 2001)
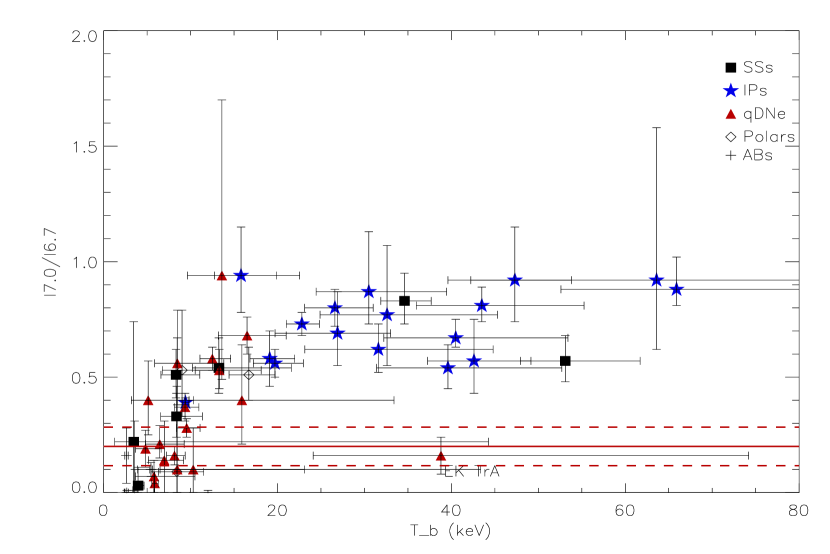
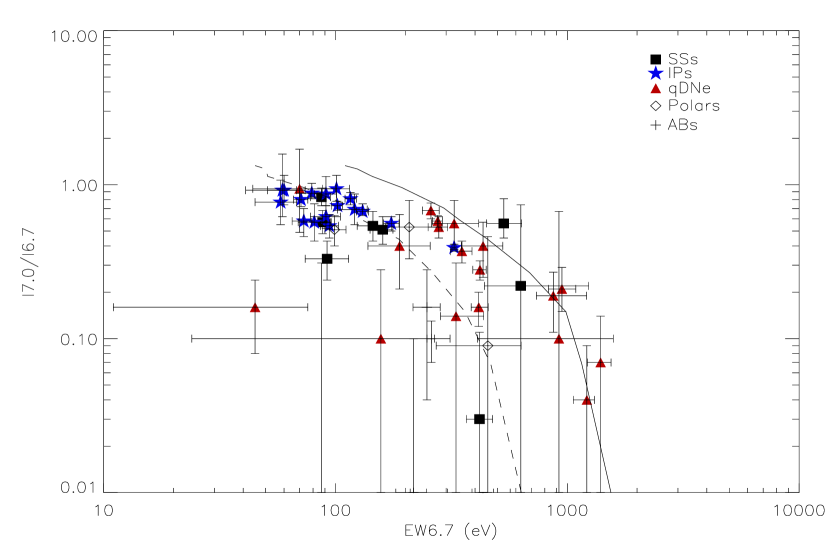
Fig. 4 shows vs. of our sample sources. The correlation between these two parameters, as well as the values of individual classes, is consistent with the trends seen in Fig 3. Probably the only significant exception is EK TrA (a DN), which shows a low , but a seemly high , deviating from the overall correlation. But the ratio is consistent with the values of other DNe. As stated in § 1, the ratio is typically a more reliable temperature diagnostic than or . If this is the case, then we may speculate the continuum of the source may be somewhat enhanced and hardened (to explain its high and possibly slightly low values, unusual for a DN; Fig 3). Again, none of the IPs are consistent with the GRXE in terms of the ratio. In general, IPs have higher and higher values than DNe and ABs. The higher values of IPs can be naturally explained by greater expected in-falling velocities at the stand shocks and therefore higher shock temperatures than in non-magnetic CVs (e.g., § 1; see also Longair 2011). A higher temperature also naturally leads to a larger Hydrogen-like Fe ion fraction, and therefore a higher value. The spectra of our sampled ABs generally do not show significant 7.0-keV lines, thus their are less than (see Fig 4 and Fig 5 for details). As shown in Fig 5, the dependence of on is consistent with the cooling flow model predictions.
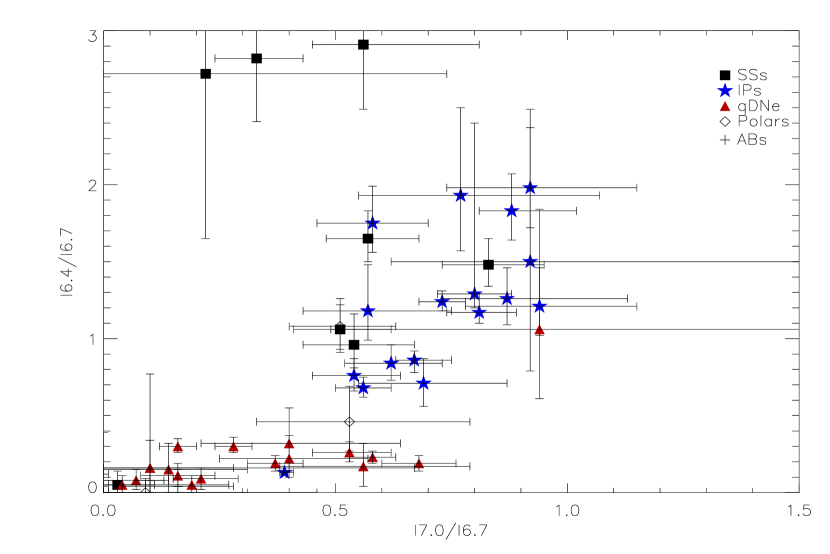
Fig 6 compares with of our sample sources. As expected, there is a correlation between the two parameters, even for two individual classes, DNe and IPs. Therefore, is also a reasonably good tracer of the hot plasma temperature for these classes. SSs, on the other hand, can have exceptionally stronger 6.4-keV line emission; three of them have , which can be naturally explained by the presence of cool (flureschncing) material surrounding such systems.
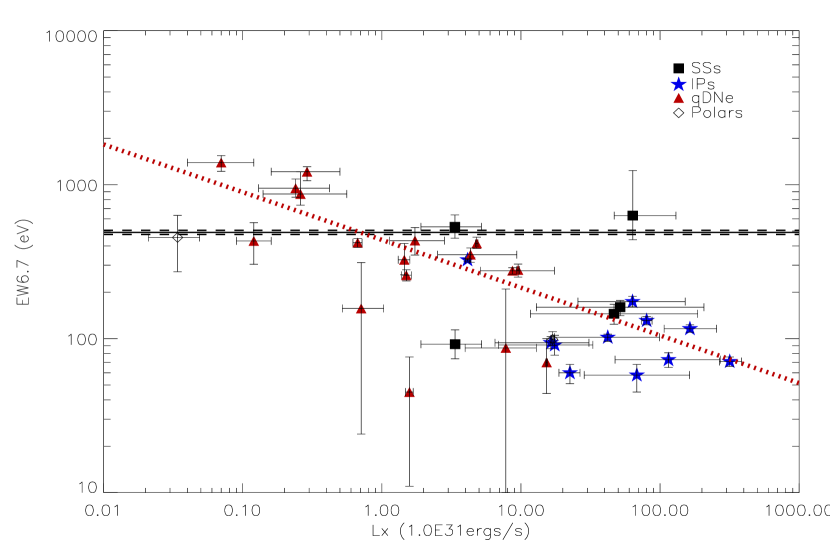
Theoretically, one may also expect an anti-correlation of with or . For a same accretion rate, the deeper the gravitational potential is (as traced by and ), the higher should be. Indeed, Fig 7 shows these expected correlations, most apparent when data points with large errors are discounted. All IPs, except for one, have , while almost all DNe have . The correlations are particularly convincing for DNe as a class with the Spearman’s rank order correlation coefficient . These correlations are not expected to be tight, because also depends on the accretion rate, which could vary from one source to another of similar WD masses. Following the procedure described in Li & Wang (2013), we characterize the - correlation of DNe, using the best-fit log-log linear relation, (Fig. 7). The root mean square of the data around the relation is dex.
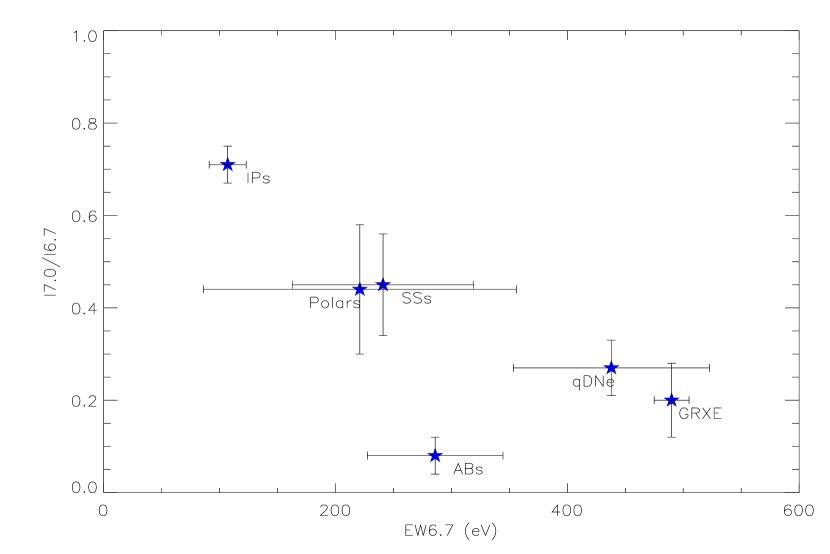
Fig 8 shows that the GRXE (especially its value) cannot be explained by any mixture of mCVs, SSs, and ABs, if our sample sources are representative of these individual classes. mCVs have higher , lower and higher , compared to the GRXE. Similarly, ABs on average still have too low , but also too low . In contrast, DNe have Fe lines properties consistent with those of the GRXE with in 1-. We discuss the implications of these results in the following section.
4 Discussion
The above spectral results are indicative as to the relative importance of the source classes responsible for the GRXE. However, to quantify their respective contributions, we need to be aware of the limitations of the results and to know the flux distributions of the source classes. To do so, we first compare our results with those from previous studies as a consistency check and then discuss the limitations and their effects as well as the ways to move forward.
4.1 Comparison to previous studies and common limitations
Various studies of local CVs and ABs have been carried out previously. The same Suzaku data on the IPs and SSs in our sample have mostly been analyzed; the results are quantitatively consistent with ours, in terms of , as well as the Fe line equivalent widths (e.g., V1223 Sgr and V407 Cyg; Hayashi et al. 2011; Mukai et al. 2012). Only 8 of the CVs and 4 of the ABs are analyzed for the first time; they are marked in Table 1. All of these newly analyzed CVs are DNe, compared to eight studied previously (Ishida et al., 2009; Ikis et al., 2013; Mukai et al., 2009; Byckling et al., 2010; Saitou et al., 2012; Neustroev & Tsygankov, 2014)). Some of our sample sources are included in existing ASCA studies, the results of which typically have large uncertainties. The EW uncertainty is typically eV in ASCA measurements (Ishida & Ezuk, 1999; Ezuka & Ishida, 1999), compared to eV in our Suzaku ones; the latter tend to have substantially higher signal to noise ratios, as well as the improved spectral resolution, than the former. Our results are also consistent with previous Chandra HETG measurements (e.g., for SS Cyg and U Gem, Rana et al., 2006; Schlegel et al., 2014). Recently, Eze (2015) compared the EWs of the 6.4 keV line of CVs to that of the GRXE based on a similar sample of SSs and mCVs, and conclude that SSs could account for the majority of the 6.4 keV line of GRXE. Our measurements of EWs of Fe lines are in general consistent with theirs. However, their work mostly focused on 6.4 keV lines, and did not include DNe, thus did not address the question of main contributors of 6.7/7.0-keV lines of GRXE as was done in this paper. Therefore, our results, broadly consistent with the existing ones, represent a step forward in improving both the sample statistics and the uniformity of the data analysis, focusing on the Fe-line diagnostics.
There are various limitations in our results. First, the sample size of our studied sources remains small, especially for AB, SS, and Polar classes. Although they are unlikely to be major contributors to the observed 6.7-keV line emission of the GRXE (e.g., Fig. 8), their contributions to the 6.4-keV line (probably chiefly due to SSs) and to the soft X-ray continuum (from ABs) could be substantial, depending on their uncertain overall populations in the Galaxy. We thus focus our discussion on the relative roles of IPs and DNe, which are probably the two most important classes for explaining the 6.7 and 7.0 keV lines of the GRXE.
Second, the energy range effectively covered by the Suzaku data is limited. The energy coverage of XIS is mostly below 10 keV which brings uncertainties to temperature measurements. The hard X-ray detector (HXD) spectra, on the other hand, usually have sufficiently high signal-to-noise bins only up to keV, with typically only 2-3 bins above 20 keV. When the temperature of a plasma reaches above keV, the line diagnostics are also of little use, because atoms are almost fully ionized. Consequently, in such a case, the temperature cannot be well constrained. This limitation affects our ability to investigate the very hard part of the GRXE. Accordingly, we limit our discussion on the nature of the GRXE in the 2-10 keV band.
Third, our sample is certainly very incomplete and biased toward relatively bright sources. The sampling is probably reasonable for IPs and perhaps SSs, which tend to have high luminosities, but is clearly inadequate for DNe and ABs. Only five sources in eight observations in our sample are less luminous than (Fig. 7). Therefore, the line or temperature measurements based on the sample may not be representative. In such a case (e.g., for DNe), the luminosity-dependence of the measurements must be accounted for.
4.2 Integrated DNe contribution to the GRXE
To quantify the contribution of DNe to the GRXE, we need to know their LF. Indeed, the LFs of local CVs and ABs have been studied; the statistics of DNe, which are mostly below several , remains too poor to be analyzed separately (Sazonov et al., 2006). Byckling et al. (2010); Pretorius & Knigge (2012); Reis et al. (2013) suggest the presence of a faint population of DNe below and a LF with ; however, their sample sizes are also not large enough to put tight constraints on LF parameters, and the slope of the LF is inconsistent with that of the GRXE sources (, tighter constraints could be put to the LF of local DNe though, see discussion below). Here we use the well-constrained LF of X-ray sources directly observed in the limited window (Revnivtsev et al., 2009): . This LF extends to the luminosity limit of . Between this limit and , the sources should mostly be DNe. Sources below , as suggested by Byckling et al. (2010); Pretorius & Knigge (2012); Reis et al. (2013), could be populous and contribute a negligible part of the GRXE. However, they are unlikely to dominate GRXE, because sources above contribute more than 80% of GRXE(Revnivtsev et al., 2009), which leaves only for fainter sources. Nevertheless, detailed investigation on their Fe line properties are necessary to confirm their relative importance. We will thus concentrate on sources between . Our objective here is to demonstrate how the luminosity-dependence affects the measurements of .
We calculate the LF-accumulated as
| (4) |
where the continuum at 6.7 keV is assumed to be scaled with and
| (5) |
We account for the dependence on using the best-fit relation obtained in § 3. If we take the upper and lower luminosity limits of the integration as and , to match the luminosity range of the observed LF and DNe, the resulting is eV (or eV if the upper luminosity limit taken to ), which is consistent with, or slightly greater than the measured GRXE value. An excess of the DN value is indeed needed to balance the contributions from mCVs and ABs, which have substantially lower values ( below eV, see Table 3.).
Conversely, we can use the observed eV value of the GRXE to place constraints on the LF slope of local DNe by integrating EQ. 4, if we assume CVs in both environments share similar values. To reach a eV, the LF has to be steeper than over the range. Of course, accounting for contributions from other source populations would require a steeper LF and/or an even lower luminosity limit of DNe. Therefore, our results are consistent with the presence of a large population of local DNe with individual luminosities below , (more than ten times more numerous than those above ; Byckling et al. (2010); Pretorius & Knigge (2012); Reis et al. (2013)), but requires a steeper LF which needs to be confirmed by further observations.
4.2.1 Contributions from other sources
We have focused on the Fe emission lines and their constraints on the nature of the sources responsible for the GRXE. As shown in Fig. 1, the lines are good diagnostics of the shock temperature (for the cooling flow model) up to about 20-40 keV. The line emission saturates at higher temperatures (e.g., predicted by cooling flow model hardly changes above 40 keV, and by apec model drops below 10 eV, which is hard to be measured; meanwhile, of cooling flow model becomes flatter and that of apec model starts dropping above 40 keV). This saturation is the reason that mCVs cannot be the major contributor to the strong line emission observed in the GRXE. However, its hard X-ray continuum spectrum is likely dominated by mCVs.
As shown in Fig. 3, mCVs (especially IPs) typically have keV, higher than the characteristic temperature of the GRXE in the 2-50 keV band(Yuasa et al., 2012). Because is lower than in the cooling-flow spectral model of mCVs, their mean continuum shape should be harder than that indicated by the one-temperature characterization. Such a hard continuum contribution from mCVs can naturally be balanced by the soft mean spectra of DNe and ABs, which all have characteristic temperatures lower than 15 keV.
In short, while a quantitative decomposition of the GRXE into the contributions from specific X-ray source classes is still beyond the scope of the present study, it is clear that their relative importances are different for the Fe lines and for the hard spectral continuum.
5 Summary
We have systematically analyzed of the Suzaku spectra of 45 local CVs and ABs to explore the significance of their contributions to the GRXE. This sample consists of 6 SSs, 16 IPs, 3 polars, 16 DNe and 4 ABs. The data for 12 of these sources are analyzed for the first time. Our main results and conclusions are as follows:
-
•
Our measurements are focused on the Fe 6.4, 6.7, 7.0-keV lines, which are used as temperature diagnostics of the X-ray-emitting optically-thin thermal plasma. We find that the mean EW of the 6.7-keV line decreases from eV for DNe (ABs) to eV for IPs. In contrast, the line flux ratio increases from 0.27 for DNe to 0.71 for IPs. Such trends are well consistent with the expected higher temperature plasma in IPs due to the greater in-falling velocities of accreted matter than in DNe of similar WD masses. We also find that is strongly correlated with (except for the SSs), consistent with the expectation that the 6.4-keV line also traces the Fe-ionizing photon fluxes and hence the plasma temperature.
-
•
All sources classes considered here, except for DNe, show average Fe-line diagnostics ( and ) significantly different from those observed in the GRXE. Thus, DNe, though relatively faint ( in our sampled range), are the most likely class accounting for the bulk of the 6.7-keV and 7.0-keV line intensities observed in the GRXE. In particular, we find a strong correlation between and , which can be characterized by the relation . This correlation indicates that the bulk of the emission arises from faint DNe.
-
•
Without a major contribution from DNe, no combination of other source classes seems to be able to explain the observed 6.7-keV and 7.0-keV line intensities of the GRXE. These classes, however, can be major contributors to other parts of the GRXE. In particular, IPs can dominate in the harder band. IPs are in general brighter than . Therefore, relatively bright sources observed in the GRXE tend to be mCVs. Conversely, ABs may be significant in contributing to the soft X-ray continuum.
These results demonstrate the diagnostic power of the Fe emission lines. In comparison with the overall X-ray spectral shape, the EWs of the lines or their ratios provide more direct probes of the X-ray-emitting plasma in the intermediate temperature range of keV and are less sensitive to complications such as the metallicity of the plasma, as well as the reflection and absorption of X-rays. The observed lines of the GRXE can therefore be used as the fundamental constraints and limits on the nature and population of the underlying responsible source classes.
| Source | Class | Obs-ID | D | References | ||
|---|---|---|---|---|---|---|
| (kpc) | ||||||
| CH Cyg1 | SS | 400016020 | 3.89 | Perryman et al. (1997) | ||
| CH Cyg2 | SS | 400016030 | 3.91 | Perryman et al. (1997) | ||
| RS Oph | SS | 406033010 | 2.71 | Barry et al. (2008) | ||
| RT Cru | SS | 402040010 | 30.0 | |||
| SS73-171 | SS | 401055010 | 17.2 | Perryman et al. (1997) | ||
| SS73-172 | SS | 403043010 | 15.6 | Perryman et al. (1997) | ||
| T Crb | SS | 401043010 | 36.1 | |||
| V407 Cyg | SS | 905001010 | 6.99 | |||
| AO Psc | IP | 404033010 | 4.86 | Pretorius & Mukai (2014) | ||
| BG Cmi | IP | 404029010 | 23.0 | |||
| EX Hya | IP | 402001010 | 81.7 | Godon et al (2012) | ||
| FO Aqr | IP | 404032010 | 47.6 | Pretorius & Mukai (2014) | ||
| IGR J17195-4100 | IP | 403028010 | 34.3 | |||
| IGR J17303-0601 | IP | 403026010 | 17.9 | |||
| MU Cam | IP | 403004010 | 9.65 | |||
| NY Lup | IP | 401037010 | 29.6 | de Martino et al. (2006) | ||
| PQ Gem | IP | 404030010 | 21.9 | Pretorius & Mukai (2014) | ||
| 1RXS J213344.1+51072 | IP | 401038010 | 20.1 | |||
| TV Col | IP | 403023010 | 49.5 | Ozdonmez et al. (2015) | ||
| TX Col | IP | 404031010 | 10.8 | |||
| V1223 Sgr | IP | 402002010 | 95.6 | Ozdonmez et al. (2015) | ||
| V2400 Oph | IP | 403021010 | 44.9 | Barlow et al. (2006) | ||
| V709 Cas | IP | 403025010 | 35.5 | Barlow et al. (2006) | ||
| XY Ari1 | IP | 500015010 | 18.8 | Pretorius & Mukai (2014) | ||
| XY Ari2 | IP | 506026010 | 20.0 | Pretorius & Mukai (2014) | ||
| SWIFT J2319.4+2619 | Po | 408030010 | 3.08 | |||
| AM Her | Po | 403007010 | 0.350 | Gansicke (1995) | ||
| V1432 Aql | Po | 403027010 | 26.7 | Watson (1995) | ||
| BF Eria | DN | 407045010 | 1.33 | Neustroev & Zharikov (2008) | ||
| BV Cena | DN | 407047010 | 14.1 | Godon et al (2012) | ||
| BZ UMa | DN | 402046010 | 2.79 | Thorstensen et al. (2008) | ||
| EK TrAa | DN | 407044010 | 4.09 | Gansicke et al. (1997) | ||
| FL Psca | DN | 403039010 | 0.396 | |||
| FS Aur | DN | 408041010 | 2.53 | |||
| GK Pera | DN | 403081010 | 7.26 | Pretorius & Mukai (2014) | ||
| KT Per | DN | 403041010 | 2.82 | Thorstensen et al. (2008) | ||
| SS Aur | DN | 402045010 | 2.99 | Ozdonmez et al. (2015) | ||
| SS Cyg | DN | 400007010 | 14.6 | Ozdonmez et al. (2015) | ||
| U Gem1 | DN | 407034010 | 12.5 | Ozdonmez et al. (2015) | ||
| U Gem2 | DN | 407035010 | 5.56 | Ozdonmez et al. (2015) | ||
| V1159 Oria | DN | 408029010 | 1.00 | |||
| V893 Sco | DN | 401041010 | 19.9 | Ozdonmez et al. (2015) | ||
| VW Hyi1a | DN | 406009010 | 1.44 | Pretorius & Knigge (2012) | ||
| VW Hyi2a | DN | 406009020 | 5.86 | Pretorius & Knigge (2012) | ||
| VW Hyi3a | DN | 406009030 | 4.96 | Pretorius & Knigge (2012) | ||
| VW Hyi4a | DN | 406009040 | 5.20 | Pretorius & Knigge (2012) | ||
| VY Aqra | DN | 402043010 | 1.08 | Ozdonmez et al. (2015) | ||
| Z Cam | DN | 404022010 | 27.4 | Ozdonmez et al. (2015) | ||
| GT Musa | AB | 402095010 | ||||
| II Pega | AB | 407038010 | ||||
| Gema | AB | 402033010 | ||||
| UX Aria | AB | 404008010 |
Note: aSources firstly analyzed in this paper.
| Source | Class | |||||||||
|---|---|---|---|---|---|---|---|---|---|---|
| (keV) | eV | (eV) | (eV) | (eV) | ||||||
| CH Cyg1 | SS | 1.52/191 | ||||||||
| CH Cyg2 | SS | 1.05/172 | ||||||||
| RS Oph | SS | 0.91/49 | ||||||||
| RT Cru | SS | 1.06/942 | ||||||||
| SS73-171 | SS | 1.02/423 | ||||||||
| SS73-172 | SS | 0.88/219 | ||||||||
| T Crb | SS | 0.97/1229 | ||||||||
| V407 Cyg | SS | 1.10/116 | ||||||||
| AO Psc | IP | 0.969/1262 | ||||||||
| BG Cmi | IP | 1.04/934 | ||||||||
| EX Hya lines | IP | 1.03/3100 | ||||||||
| FO Aqr | IP | 0.94/1841 | ||||||||
| IGR J17195-4100 | IP | 0.98/1131 | ||||||||
| IGR J17303-0601 | IP | 0.91/721 | ||||||||
| MU Cam | IP | 0.93/631 | ||||||||
| NY Lup | IP | 0.99/2319 | ||||||||
| PQ Gem | IP | 1.05/938 | ||||||||
| 1RXS J213344.1+51072 | IP | 1.07/1429 | ||||||||
| TV Col | IP | 1.14/1403 | ||||||||
| TX Col | IP | 0.92/626 | ||||||||
| V1223 Sgr | IP | 1.04/3000 | ||||||||
| V2400 Oph | IP | 1.05/2992 | ||||||||
| V709 Cas | IP | 1.02/1397 | ||||||||
| XY Ari1 | IP | 0.97/1454 | ||||||||
| XY Ari2 | IP | 0.90/1823 | ||||||||
| SWIFT J2319.4+2619 | Po | 0.89/184 | ||||||||
| AM Her | Po | 1.11/112 | ||||||||
| V1432 Aql | Po | 0.90/1052 | ||||||||
| BF Eri | DN | 0.95/53 | ||||||||
| BV Cen | DN | 0.92/498 | ||||||||
| BZ UMa | DN | 0.87/74 | ||||||||
| EK TrA | DN | 0.97/114 | ||||||||
| FL Psc | DN | 0.78/51 | ||||||||
| FS Aur | DN | 0.97/252 | ||||||||
| GK Per | DN | 1.13/210 | ||||||||
| KT Per | DN | 0.85/118 | ||||||||
| SS Aur | DN | 0.89/84 | ||||||||
| SS Cyg | DN | 1.12/773 | ||||||||
| U Gem1 | DN | 0.97/839 | ||||||||
| U Gem2 | DN | 1.06/690 | ||||||||
| V1159 Ori | DN | 0.94/181 | ||||||||
| V893 Sco | DN | 0.91/558 | ||||||||
| VW Hyi1 | DN | 1.10/156 | ||||||||
| VW Hyi2 | DN | 1.04/114 | ||||||||
| VW Hyi3 | DN | 1.16/131 | ||||||||
| VW Hyi4 | DN | 1.07/115 | ||||||||
| VY Aqr | DN | 1.05/52 | ||||||||
| Z Cam | DN | 1.01/1098 | ||||||||
| GT Mus | AB | 1.03/1432 | ||||||||
| II Peg | AB | 1.08/276 | ||||||||
| Gem | AB | 0.88/273 | ||||||||
| UX Ari | AB | 1.02/505 |
Note: The fits are based on the absorbed zero-metallicity apec with the three gaussian model (§ 2). is in units of . The last column shows the reduced and the degrees of freedom of each fit.
| Source Class | |||||
|---|---|---|---|---|---|
| (keV) | (eV) | (eV) | (eV) | ||
| SSs | |||||
| IPs | |||||
| Polars | |||||
| DNe | |||||
| ABs | |||||
| GRXE |
Note: The errors of the means are at the 1- level. The GRXE values are from Uchiyama et al. (2013) and Yuasa et al. (2012) are included for comparison. of GRXE: 6.64 keV from Uchiyama et al. (2013) of 2-10 keV range fitting; 15 keV from Yuasa et al. (2012) of 2-50 keV range fitting. See Discussion for details.
References
- Anzolin et al. (2009) Anzolin, G., de Martino, D., Falanga, M., et al., 2009, A&A, 501, 1047
- Arnaud (1996) Arnaud K., 1996, in Jacoby G. H., Barnes J., eds, ASP Conf. Ser. Vol. 101, Astronomical Data Analysis Software and Systems V. Astron. Soc. Pac., San Francisco, p. 17
- Barlow et al. (2006) Barlow, E. J., Knigge, C., Bird, A.J., et al., 2006, MNRAS, 372, 224
- Barry et al. (2008) Barry, R. K., Mukai, K., Sokoloski, J.L., et al., 2008, ASPC, 401, 52
- Baskill et al. (2005) Baskill, D. S., Wheatley, P. J., & Osborne, J. P., 2005, MNRAS, 357, 626
- Berdyugina et al. (1998) Berdyugina, S.V., Jankov, S., Ilyin, I., et al., 1998, A&A, 334, 863
- Byckling et al. (2010) Byckling, K., Mukai, K., Thorstensen, J. R., & Osborne, J. P., 2010, MNRAS, 408, 2298
- de Martino et al. (2006) de Martino D., Bonnet-Bidaud, J.-M., Mouchet, M., et al., 2006, A&A, 449, 1151
- Ebisawa et al. (2008) Ebisawa, K., Yamauchi, S., Tanaka, Y., et al., 2008, PASJ, 60, S223
- Eker et al. (2008) Eker, Z., Ak, N. F., Bilir, S., et al., 2008, MNRAS, 389, 1722
- Eze (2015) Eze, R.N.C., New Astronomy, 36, 64
- Ezuka & Ishida (1999) Ezuka, H., & Ishida, M., 1999, ApJS, 120, 277
- Franciosini et al. (2001) Franciosini, E., Pallavicini, R., & Tagliaferri, G., 2001, A&A, 375, 196
- Gansicke (1995) Gansicke, B., Beuermann, K., & de Martino, D., 1995, A&A, 303, 127
- Gansicke et al. (1997) Gansicke, B., Beuermann, K., & Thomas, H., 1997, MNRAS, 289, 388
- Gansicke et al. (2009) Gansicke B.T., Dillon, M., Southworth, J., et al., 2009, MNRAS, 397, 2170
- Godon et al (2012) Godon, P., Sion, E. M., Levay, K., et al., 2012, ApJS, 203, 29
- Gray (2008) Gray, D., 2008, The Observation and Analysis of Stellar Photospheres, Cambridge University Press, 3rd edition
- Hayashi et al. (2011) Hayashi, T., Ishida, M., Terada, Y., et al., 2011, PASJ, 63, 739
- Hellier & Mukai (2004) Hellier, C., Mukai, K., 2004, MNRAS, 352, 1037
- Hong et al. (2012) Hong, J., van den Berg, M., Grindlay, J. E., et al., 2012, ApJ, 746, 165
- Ikis et al. (2013) Ikis Gun, G, Karagul, A., & Gok, F., 2013, New Astronomy, 25, 1
- Ishida & Ezuk (1999) Ishida, M., & Ezuk, H., 1999, ASPC, 157, 333
- Ishida et al. (2009) Ishida, M., Okada, S., Hayashi, T., et al., 2009, PASJ, 61, 77
- Kepler et al. (2007) Kepler, S. O., Kleinman, S.J., Nitta, A., et al., 2007, MNRAS, 375, 1315
- Kepler et al. (2013) Kepler, S. O., Pelisoli, I., Jordan, S., et al., 2013, MNRAS, 429, 2934
- Li & Wang (2007) Li, Z., & Wang, D., 2007, ApJ,668, 39
- Longair (2011) Longair, M. S., 2011, High Energy Astrophysics, Cambridge University Press, 3rd edition
- Li & Wang (2013) Li, J.-T., & Wang, Q. D. 2013, MNRAS, 428, 2085
- Mallick (1998) Mallik, S. V., 1998, A&A, 338, 623
- Molaro et al. (2014) Molaro, M., Khatri, R., & Sunyaev, R. A. 2014, A&A, 564, 107
- Mukai et al. (2009) Mukai, K., Zietsman, E., & Still, M., 2009, ApJ, 707, 652
- Mukai et al. (2012) Mukai, K., et al., 2012, Baltic Astronomy, 21, 54
- Muno et al. (2007) Muno, M. P., Baganoff, F. K., Brandt, W. N., Park, S., & Morris, M. R., 2007, ApJ, 656, 69
- Neustroev & Zharikov (2008) Neustroev, V., & Zharikov, S., 2008, MNRAS, 386, 1366
- Neustroev & Tsygankov (2014) Neustroev, V., & Tsygankov, S., 2014, The X-ray Universe, 294
- Ozdonmez et al. (2015) Ozdonmez, A., Ak, T., & Bilir, S., 2015, New Astronomy, 34, 234O
- Perez et al. (2015) Perez, K., Hailey, C.J., Bauer, F.E., et al. 2015, Nature, 520, 646
- Perryman et al. (1997) Perryman, M.A.C., lindegren, L., Kovalevsky, J., et al., 1997, A&A, 323, L49
- Pretorius & Knigge (2012) Pretorius, M. L., & Knigge, C., 2012, MNRAS, 419, 1442
- Pretorius & Mukai (2014) Pretorius, M., & Mukai, K., 2014, MNRAS, 442, 2580
- Rana et al. (2006) Rana, R., Singh, K. P., Schlegel, E. M., & Barrett, P. E., 2006, ApJ, 642, 1042
- Reis et al. (2013) Reis R. C., Wheatley, P.J., Gansicke, B.T., et al., 2013, MNRAS, 430, 1994
- Revnivtsev et al. (2006) Revnivtsev, M., Sazonov, S., Gilfanov, M., Churazov, E., & Sunyaev, R., 2006, A&A, 452, 169
- Revnivtsev et al. (2009) Revnivtsev, M., Sazonov, S., Churazov, E., et al., 2009, Nature, 458, 1142
- Revnivtsev et al. (2014) Revnivtsev, M. G., Filippova, E. V., & Suleimanov, V. F., 2014, Astronomy Letters, V40., No. 4, 177
- Ritter & Kolb (2003) Ritter, H., & Kolb, U., 2003, A&A, 404, 301
- Saitou et al. (2012) Saitou, K., Tsujimoto, M.m Ebisawa, K., et al., 2012, PASJ, 64, 88
- Sazonov et al. (2006) Sazonov, S., revnivtsev, M., Gilfanov, M., et al., 2006, A&A, 450, 117
- Schlegel et al. (2014) Schlegel, E.M., Shipley, H.V., Rana, V.R., et al., 2014, ApJ, 797, 38
- Terada et al. (2010) Terada, Y., 2010, ApJ, 721, 1908
- Thorstensen (2003) Thorstensen, J., 2003, ApJ, 126, 3017
- Thorstensen et al. (2008) Thorstensen, J. R., Lépine, S., & Shara, M., 2008, AJ, 136, 2107
- Uchiyama et al. (2011) Uchiyama, H., Nobukawa, M., Tsuru, T. G., Koyama, K., & Matsumoto, H. 2011, PASJ, 63, 903
- Uchiyama et al. (2013) Uchiyama, H., Nobukawa, M., Tsuru, T., et al., 2013, PASJ, 65, 19
- Warwick et al. (2014) Warwick, R. S., Byckling, K., & Pérez-Ramírez, D., 2014, MNRAS, 438, 2967
- Watson (1995) Watson, M. G., 1995, MNRAS, 273, 681
- Wijnen et al. (2015) Wijnen, T. P. G., Zorotovic, M., & Schreiber, M. R., 2015, A&A, 577, 143
- Worrall et al. (1982) Worrall, D. M., Marshall, F. E., Boldt, E. A., & Swank, J. H. 1982, ApJ, 255, 111
- Yamauchi et al. (2009) Yamauchi, S., Ebisawa, K., Tanaka, Y., et al., 2009, PASJ, 61, S225
- Yuasa et al. (2010) Yuasa, T., Nakazawa, K., Makishima, K., et al., 2010, A&A, 520, 25
- Yuasa et al. (2012) Yuasa, T., Makishima, K., & Nakazawa, K., 2012, ApJ, 753, 129
- Zorotovic et al. (2011) Zorotovic M., Schreiber M. R., & Gansicke B. T., 2011, A&A, 536, 42