Beam profile investigation of the new collimator system for the J-PET detector
Abstract
Jagiellonian Positron Emission Tomograph (J-PET) is a multi-purpose detector which will be used for search for discrete symmetries violations in the decays of positronium atoms and for investigations with positronium atoms in life-sciences and medical diagnostics. In this article we present three methods for determination of the beam profile of collimated annihilation gamma quanta. Precise monitoring of this profile is essential for time and energy calibration of the J-PET detector and for the determination of the library of model signals used in the hit-time and hit-position reconstruction. We have we have shown that usage of two lead bricks with dimensions of 5x10x20 cm3 enables to form a beam of annihilation quanta with Gaussian profile characterized by 1 mm FWHM. Determination of this characteristic is essential for designing and construction the collimator system for the 24-module J-PET prototype. Simulations of the beam profile for different collimator dimensions were performed. This allowed us to choose optimal collimation system in terms of the beam profile parameters, dimensions and weight of the collimator taking into account the design of the 24 module J-PET detector.
1 Faculty of Physics, Astronomy and Applied Computer Science, Jagiellonian University, S. Łojasiewicza 11, 30-348 Kraków, Poland
2 Institute of Metallurgy and Materials Science of Polish Academy of Sciences, W. Reymonta 25, 30-059 Kraków, Poland
3 Department of Nuclear Methods, Institute of Physics, Maria Curie-Sklodowska University, Pl. M. Curie-Sklodowskiej 1, 20-031 Lublin, Poland
4 Świerk Computing Centre, National Centre for Nuclear Research, A. Soltana 7, 05-400 Otwock-Świerk, Poland
5 High Energy Physics Division, National Centre for Nuclear Research, A. Soltana 7, 05-400 Otwock-Świerk, Poland
87.57.uk, 29.40.Mc, 07.05.Kf
1 Introduction
Positron emission tomography (PET) is a well recognized diagnostic method enabling imaging of chosen substance’s metabolism in a living organism. The state-of-the-art commercial PET scanners are based on inorganic scintillators as radiation detectors [1, 2]. This PET technology is expensive [3, 4] and therefore there are attempts to find a new, more affordable solutions as e.g. described in ref. [5, 6].
The J-PET group is developing a cost-effective whole-body positron emission tomography scanner based on plastic scintillators [7, 8, 9, 10, 11, 13, 12, 14, 15, 16]. The scanner, referred to as J-PET (Jagiellonian Positron Emission Tomograph) is built out of axially arranged plastic scintillator stripes, read out at both sides by photomultipliers [9]. Signals from photomultipliers are sampled in the voltage domain by the dedicated front-end electronics [16]. Based on the difference and the average of these signals it is possible to reconstruct both position and time of the gamma quantum interaction with scintillator, respectively. Currently three reconstruction methods were developed by the J-PET group. One approach is to calculate the Mahalanobis distances of the measured signal (represented by the multivariate vector) from the vectors based on the mean of the signals in data sets determined for known positions [11, 12]. In the second method the hit time and hit position are reconstructed based on the comparison of the measured signal probed in the voltage or time domains with the synchronized model signals [10]. The third option is to train data set from a multivariate normal distribution based on the Tikhonov regularization, where representation of signals was provided by the Principal Component Analysis decomposition [13, 14]. All these three methods required data sets collected for know position of gamma interaction with scintillator. Annihilation quanta were collimated with the usage of lead bricks with 1.3 mm slit. However, due to the finite slit length and the distance between collimator and the scintillator stripe, the precise determination of the beam profile was performed. For the first tests we have built two different collimation systems shown on Fig. 1 and 2. These setups consisted of Hammamatsu R4998 photomultipliers [17], reference detector, lead bricks and BC-420 scintillators manufactured by Saint-Gobain [18]. Signals from photomultiplier were sampled in time domain by the LeCroy SDA6000A digital oscilloscope.
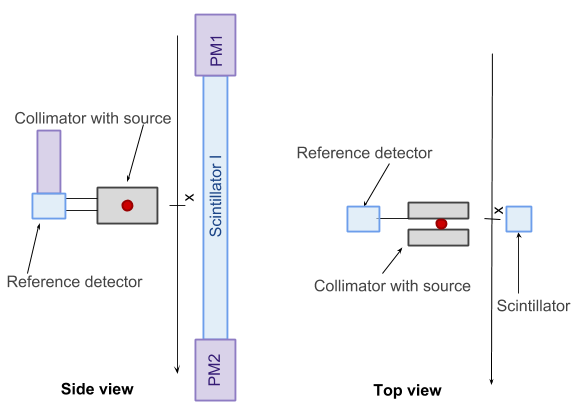
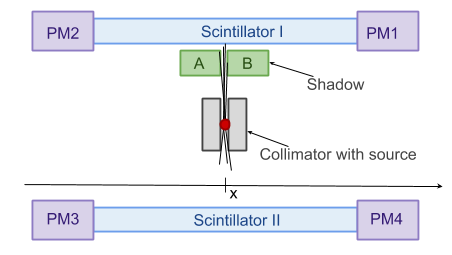
First setup consisted of a scintillator with two photomultipliers, one for the each scintillator end, and a reference detector fixed mechanically to the collimator. Scintillator was aligned perpendicularly to the axis along which collimator with the 68Ge source was moved (Fig. 1). For the second setup two scintillator stripes with photomultipliers attached to each end were placed parallel to each other. Collimator (built of lead cylinders) with 22Na source was placed between them and was moved along the axis parallel to the two scintillator stripes. Additionally, one or two lead bricks were placed between the source and one scintillator (Fig. 2). We have also developed three different methods to determine the profile of the annihilation gamma quanta beam.
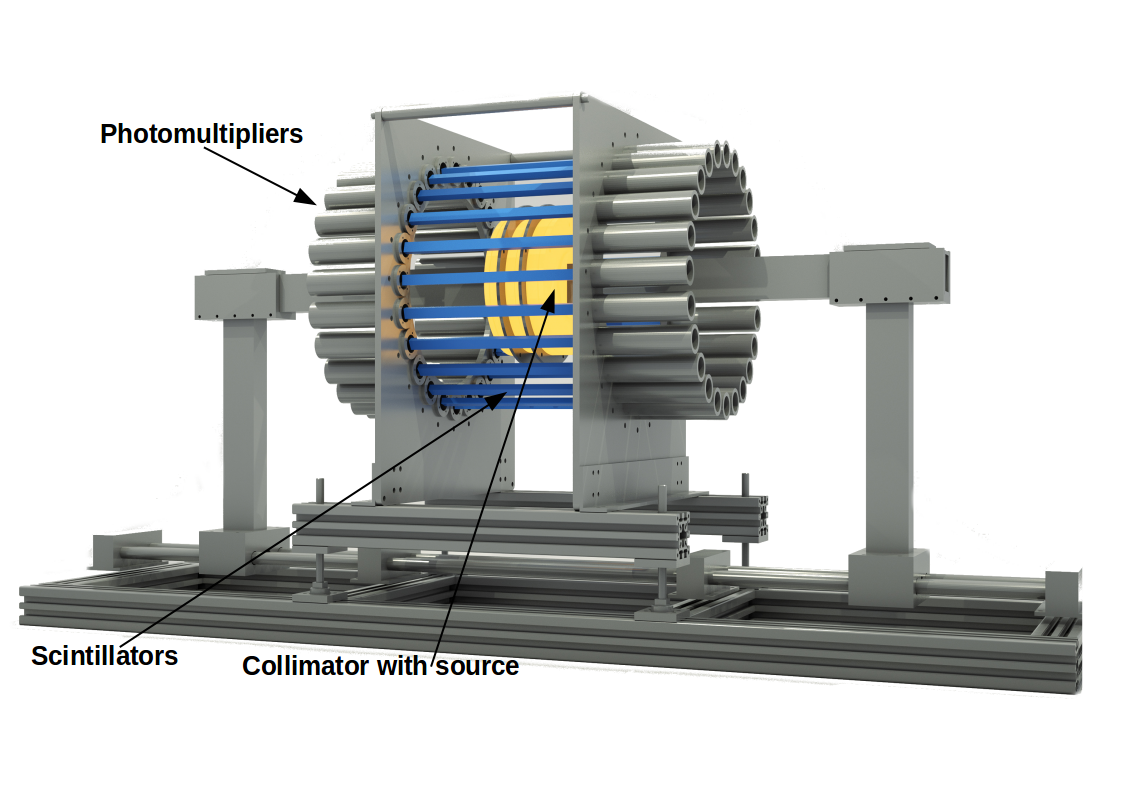
The first prototype of J-PET which have a downscaled geometry of tomographs used in hospitals is build out of 24-modules (scintillator stripe with pair of photomultipliers) (Fig. 3). This required a design of a new collimation system for the purposes of signal database measurements and any other studies of the detector response requiring well collimated beam [11]. In order to find a proper dimensions of the lead cylinders providing the best beam collimation and low total weight of the collimator we have made simple calculations neglecting gamma quanta scattering. These calculations give also the first approximations of expected beam profiles for the new collimator.
2 Measurements of the beam profile for double-stripe J-PET prototype
For better control over the systematic uncertainties of the beam profile determination we have developed three quantitatively different methods (described in sections 3 - 5). Each method required specific configuration of an experimental setup presented in Fig. 1 and Fig. 2. First method allows to measure the cumulative function of the beam profile without modifying the beam itself. In method II part of the beam is being absorbed by lead brick placed between source and scintillator. Method III allows to scan beam sections analogously as it is in laser optics and measure beam profile directly.
In order to determine the beam profile the scintillation detector was irradiated by the tested beam which can be moved along the x-axis. The measured number of events as a function of x can be expressed as a convolution of the beam profile and the detector acceptance function :
| (1) |
In order to select annihilation quanta a coincident registration of signals in both detectors was required. In the first method the collimator and the reference detector are fixed together and are moved with respect to the scintillator. In the second method an additional lead brick (A) is used as a ”shadow” to absorb a part of the beam, and in the third method two lead bricks (A,B) form a narrow slit allowing to make a direct scan of a beam profile (Fig. 2).
3 Method I
The experimental setup used for this method is shown in Fig. 1. The function of the geometrical acceptance of the detector can be approximated by:
| (2) |
where: and denote positions of the beginning and the end of the scintillator. This implies that only these gamma quanta which are within the section [, ] can generate a signal. A beam profile can be obtained by applying equation (2) into equation (1) and subsequent differentiation of equation (1):
| (3) |
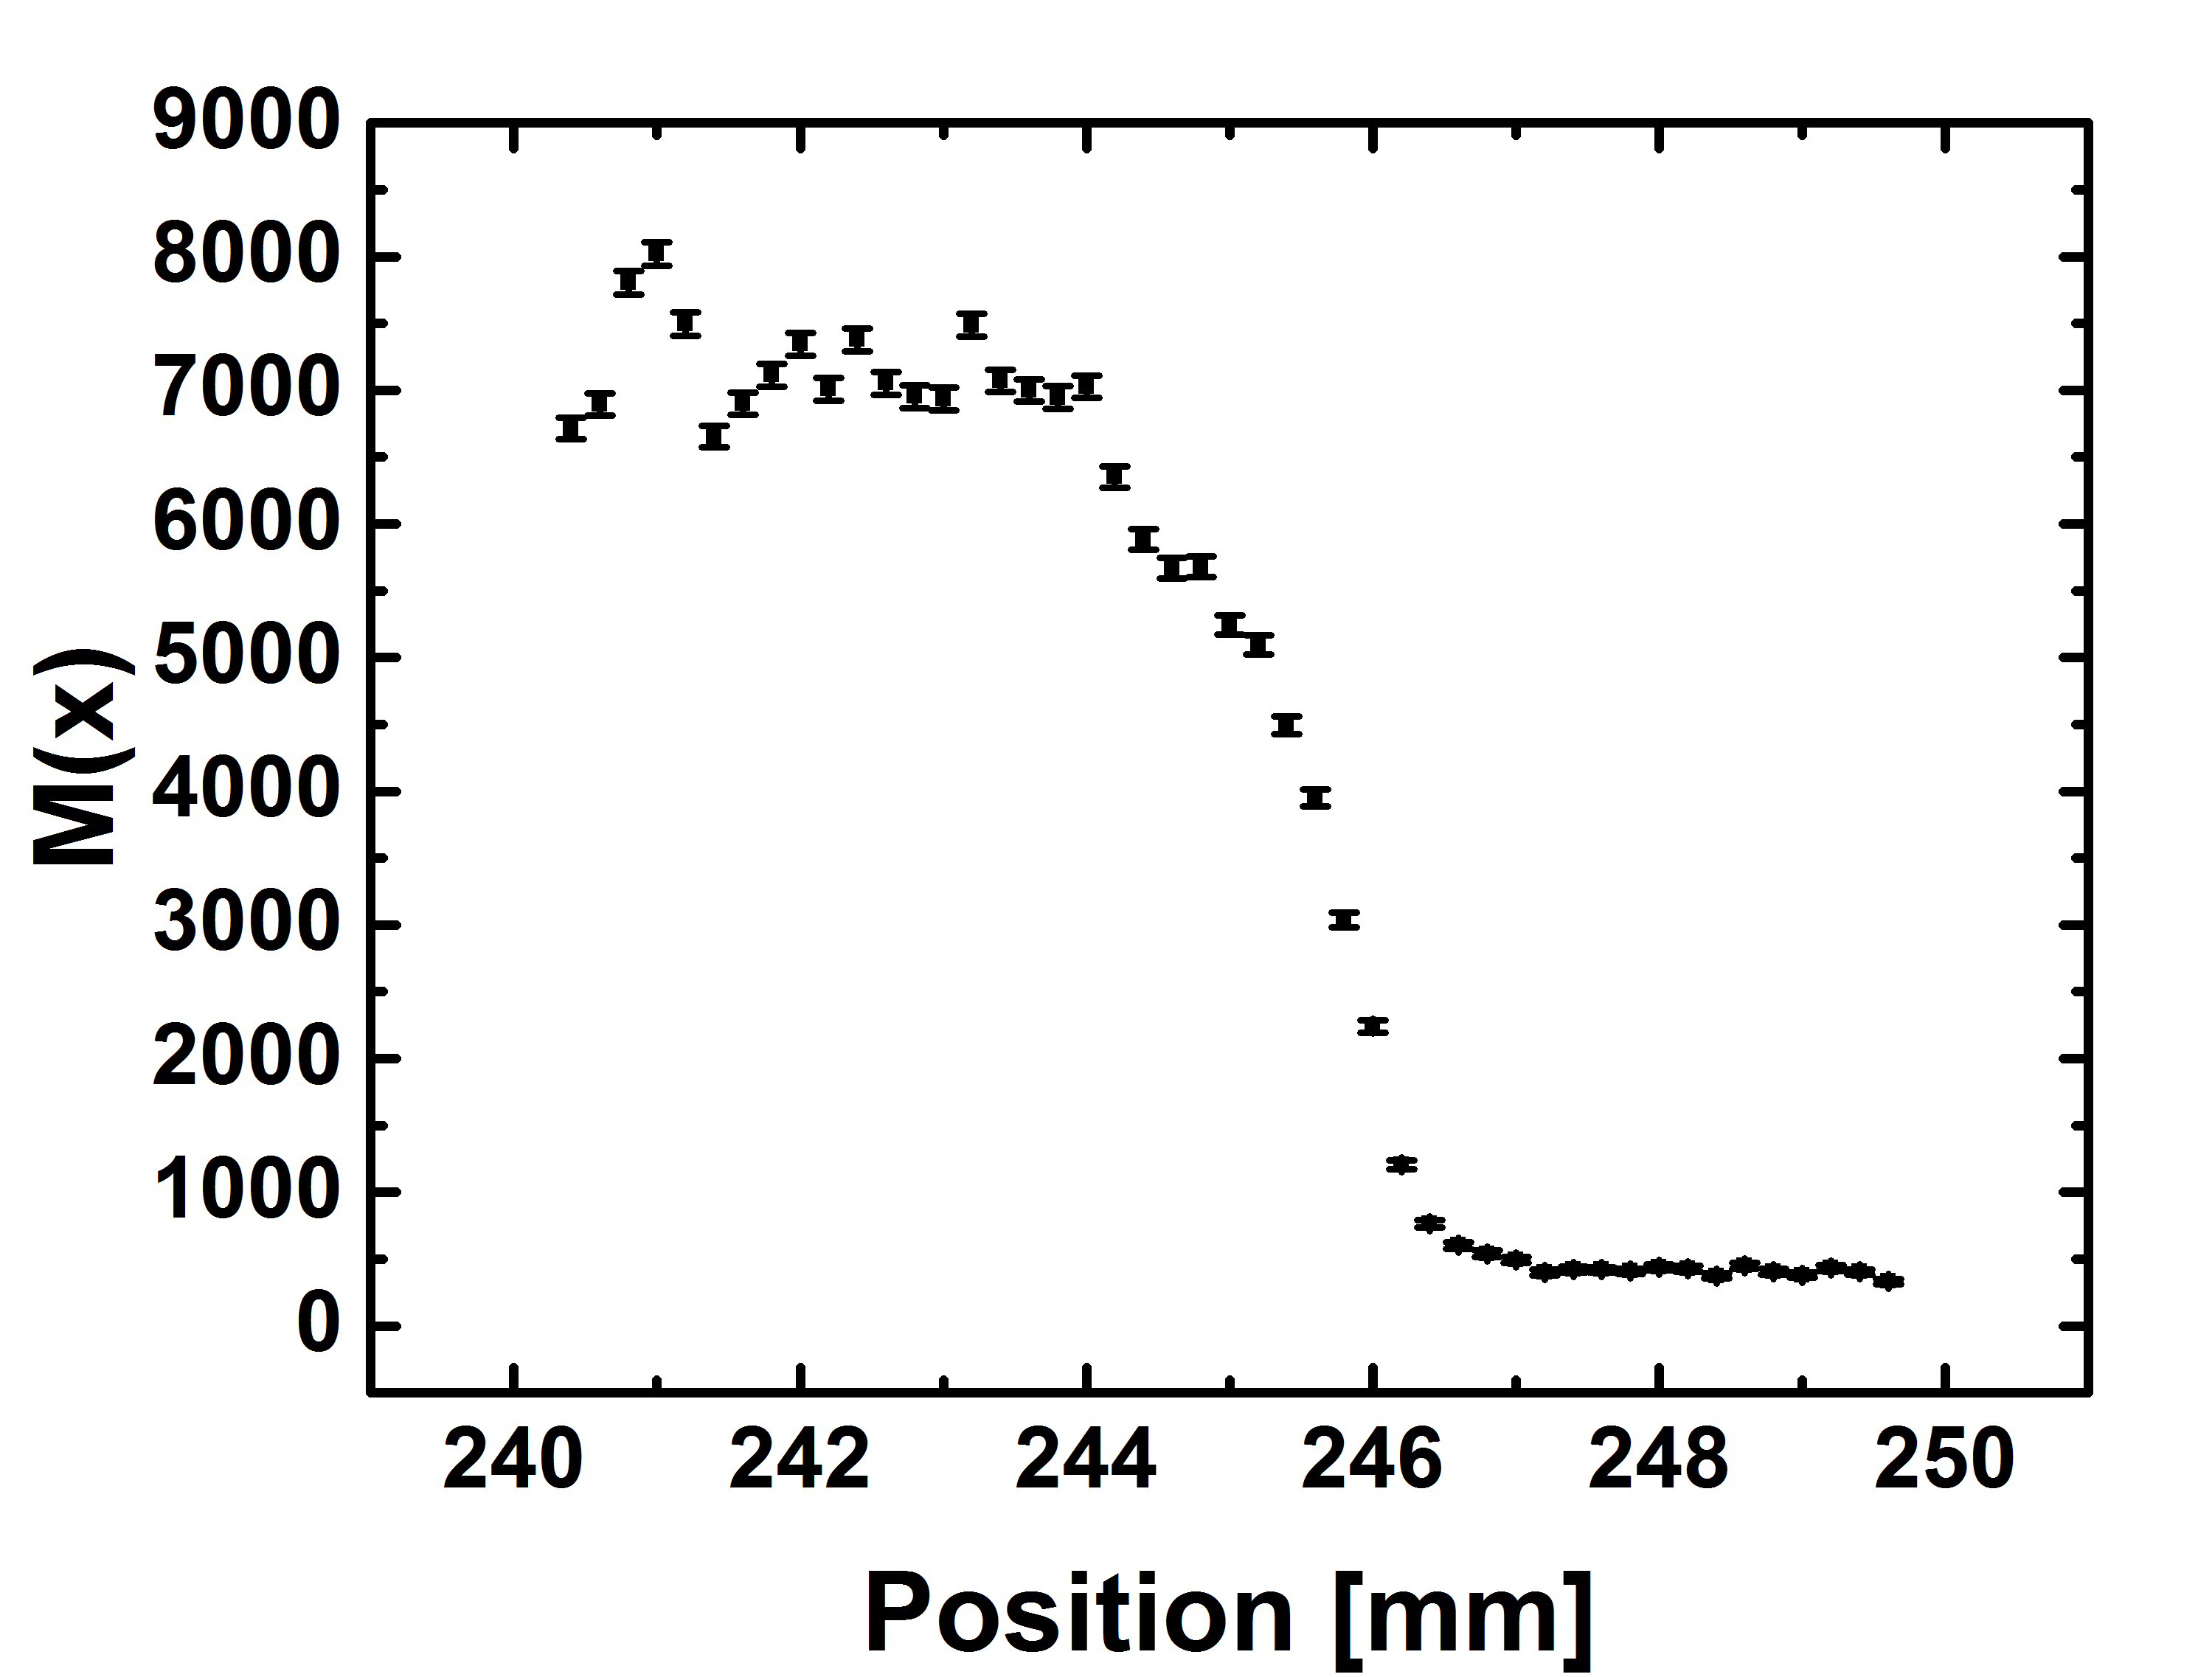
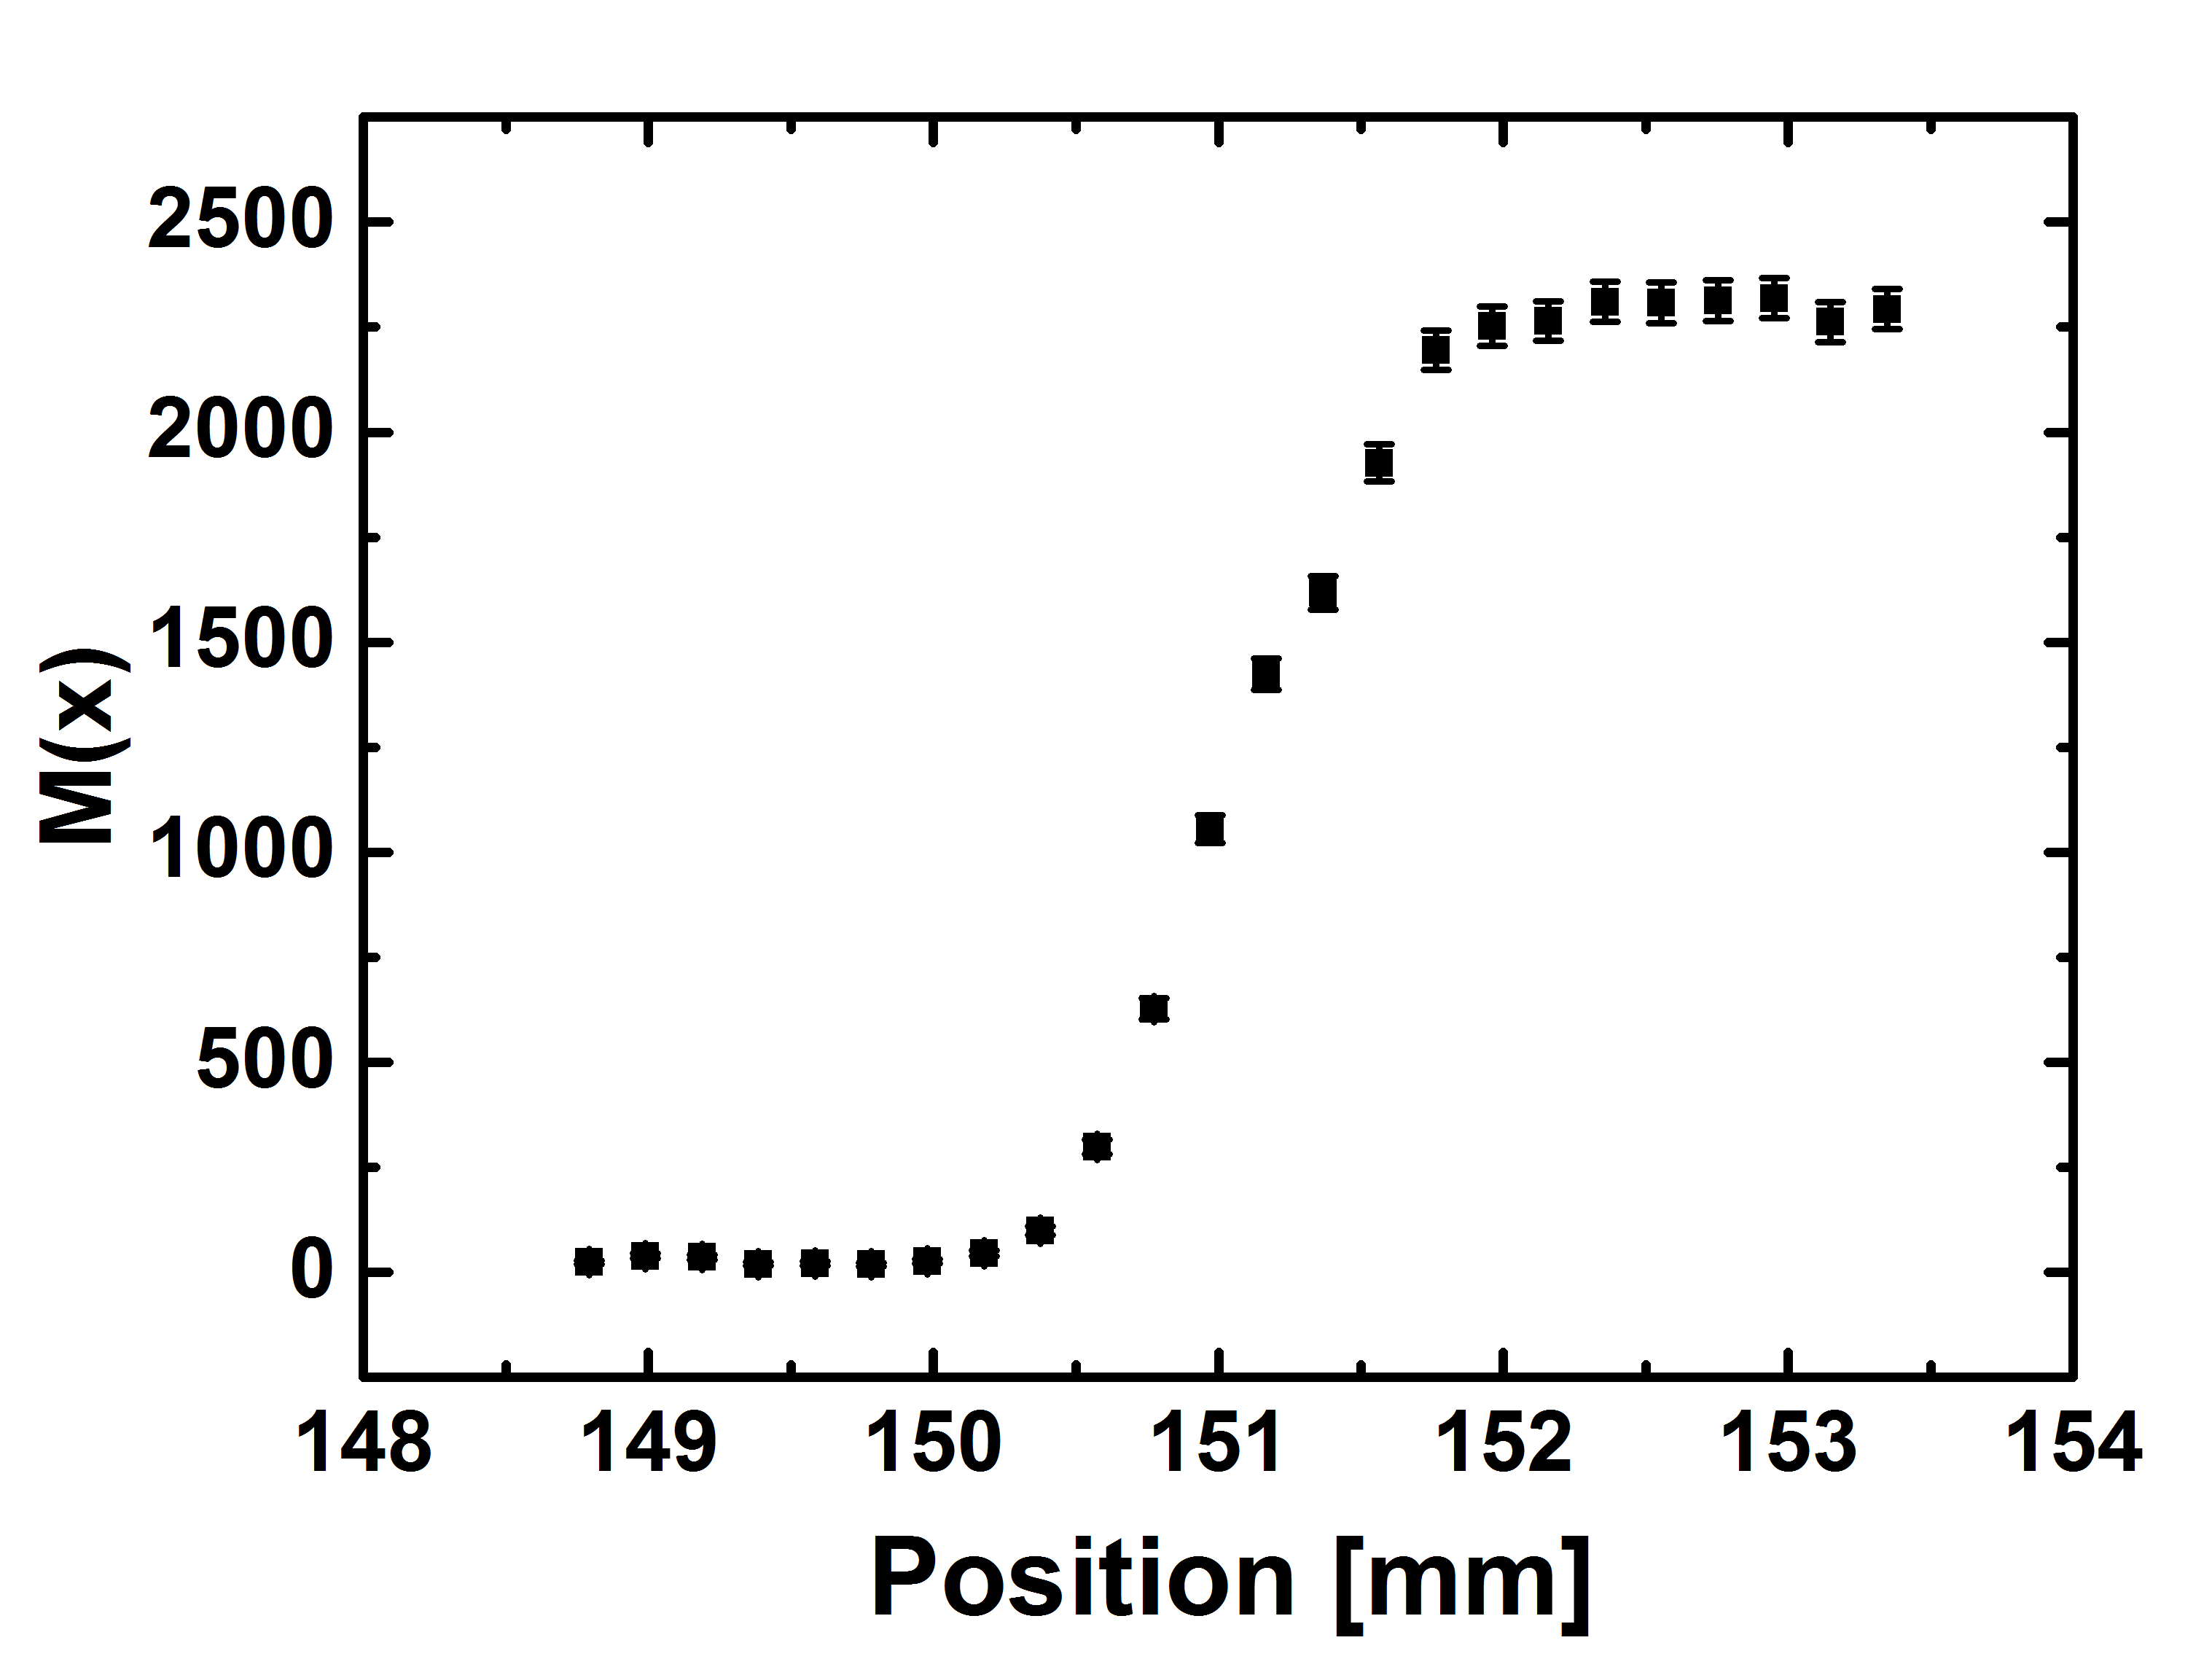
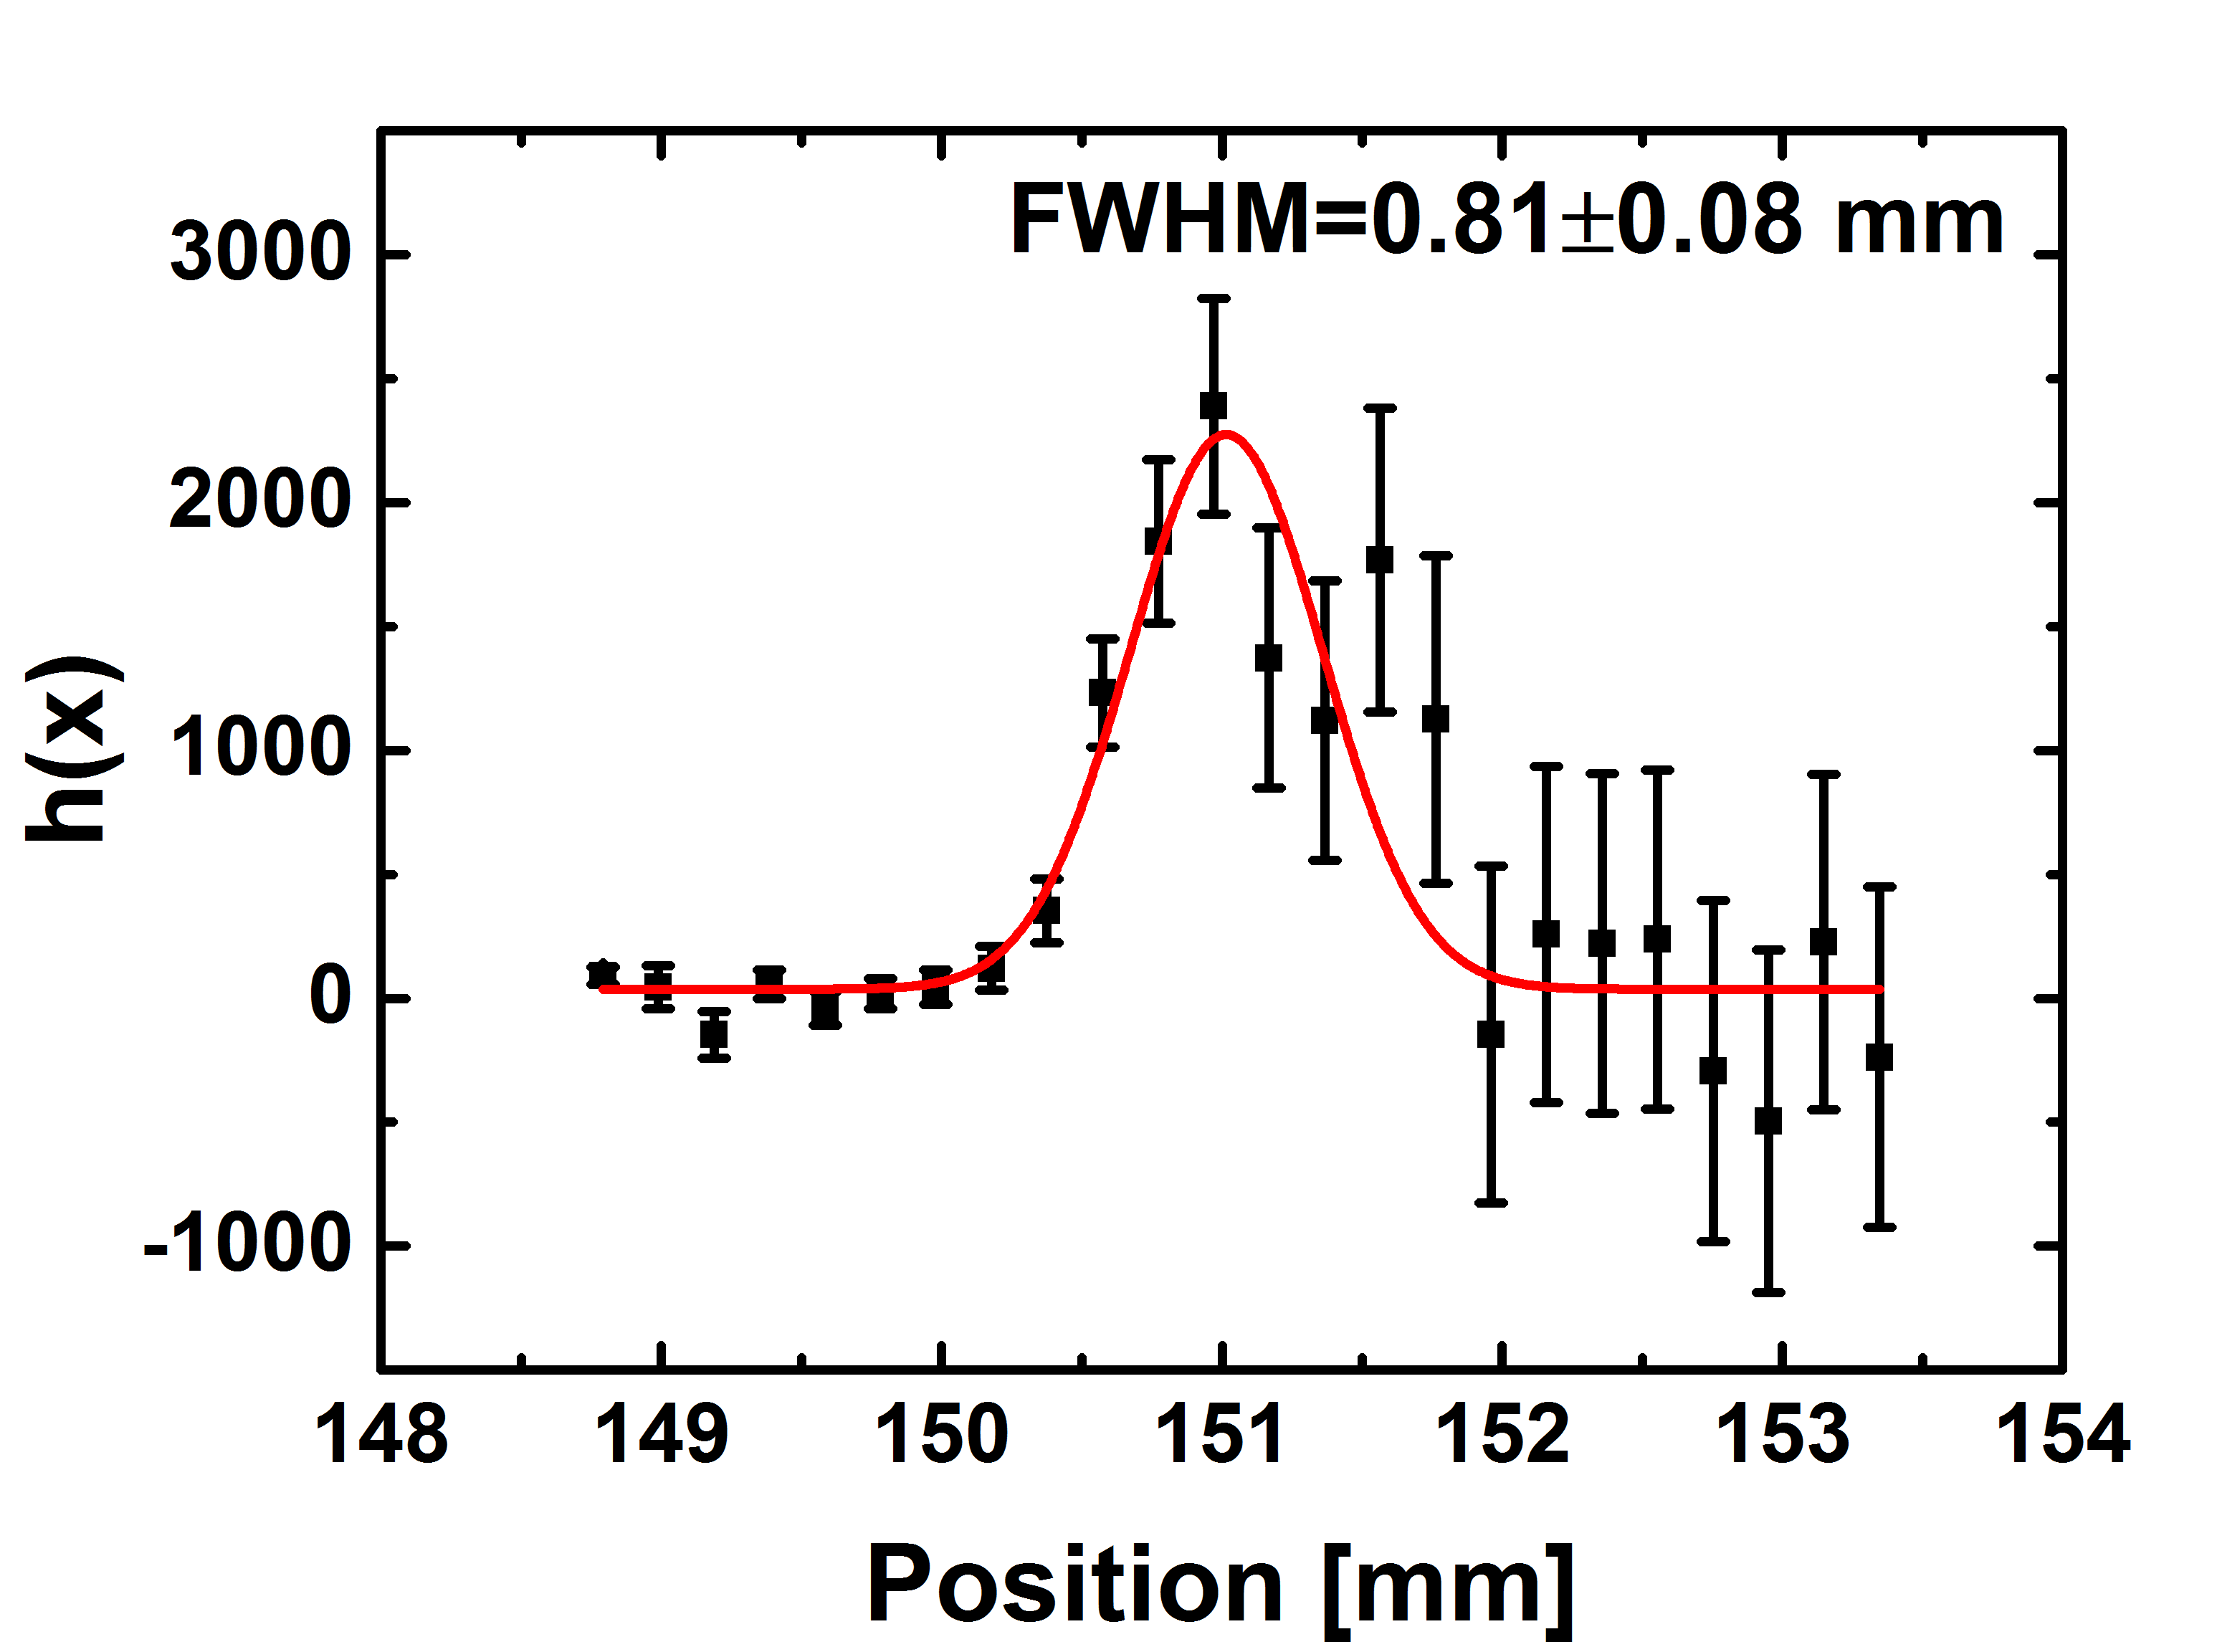
In the left panel of Fig. 4 distribution M(x) obtained in the measurement is shown. In order to extract the shape of the beam profile the numerical derivative of was calculated as follows:
| (4) |
where: , denote number of counts for measurements at , , with - . The result is shown in the right panel of Fig. 4.
4 Method II
Fig. 2 shows experimental setup used for methods II and III. Measurements were done by moving the collimator with a dedicated mechanical system along the x-axis with steps of 0.3 mm.
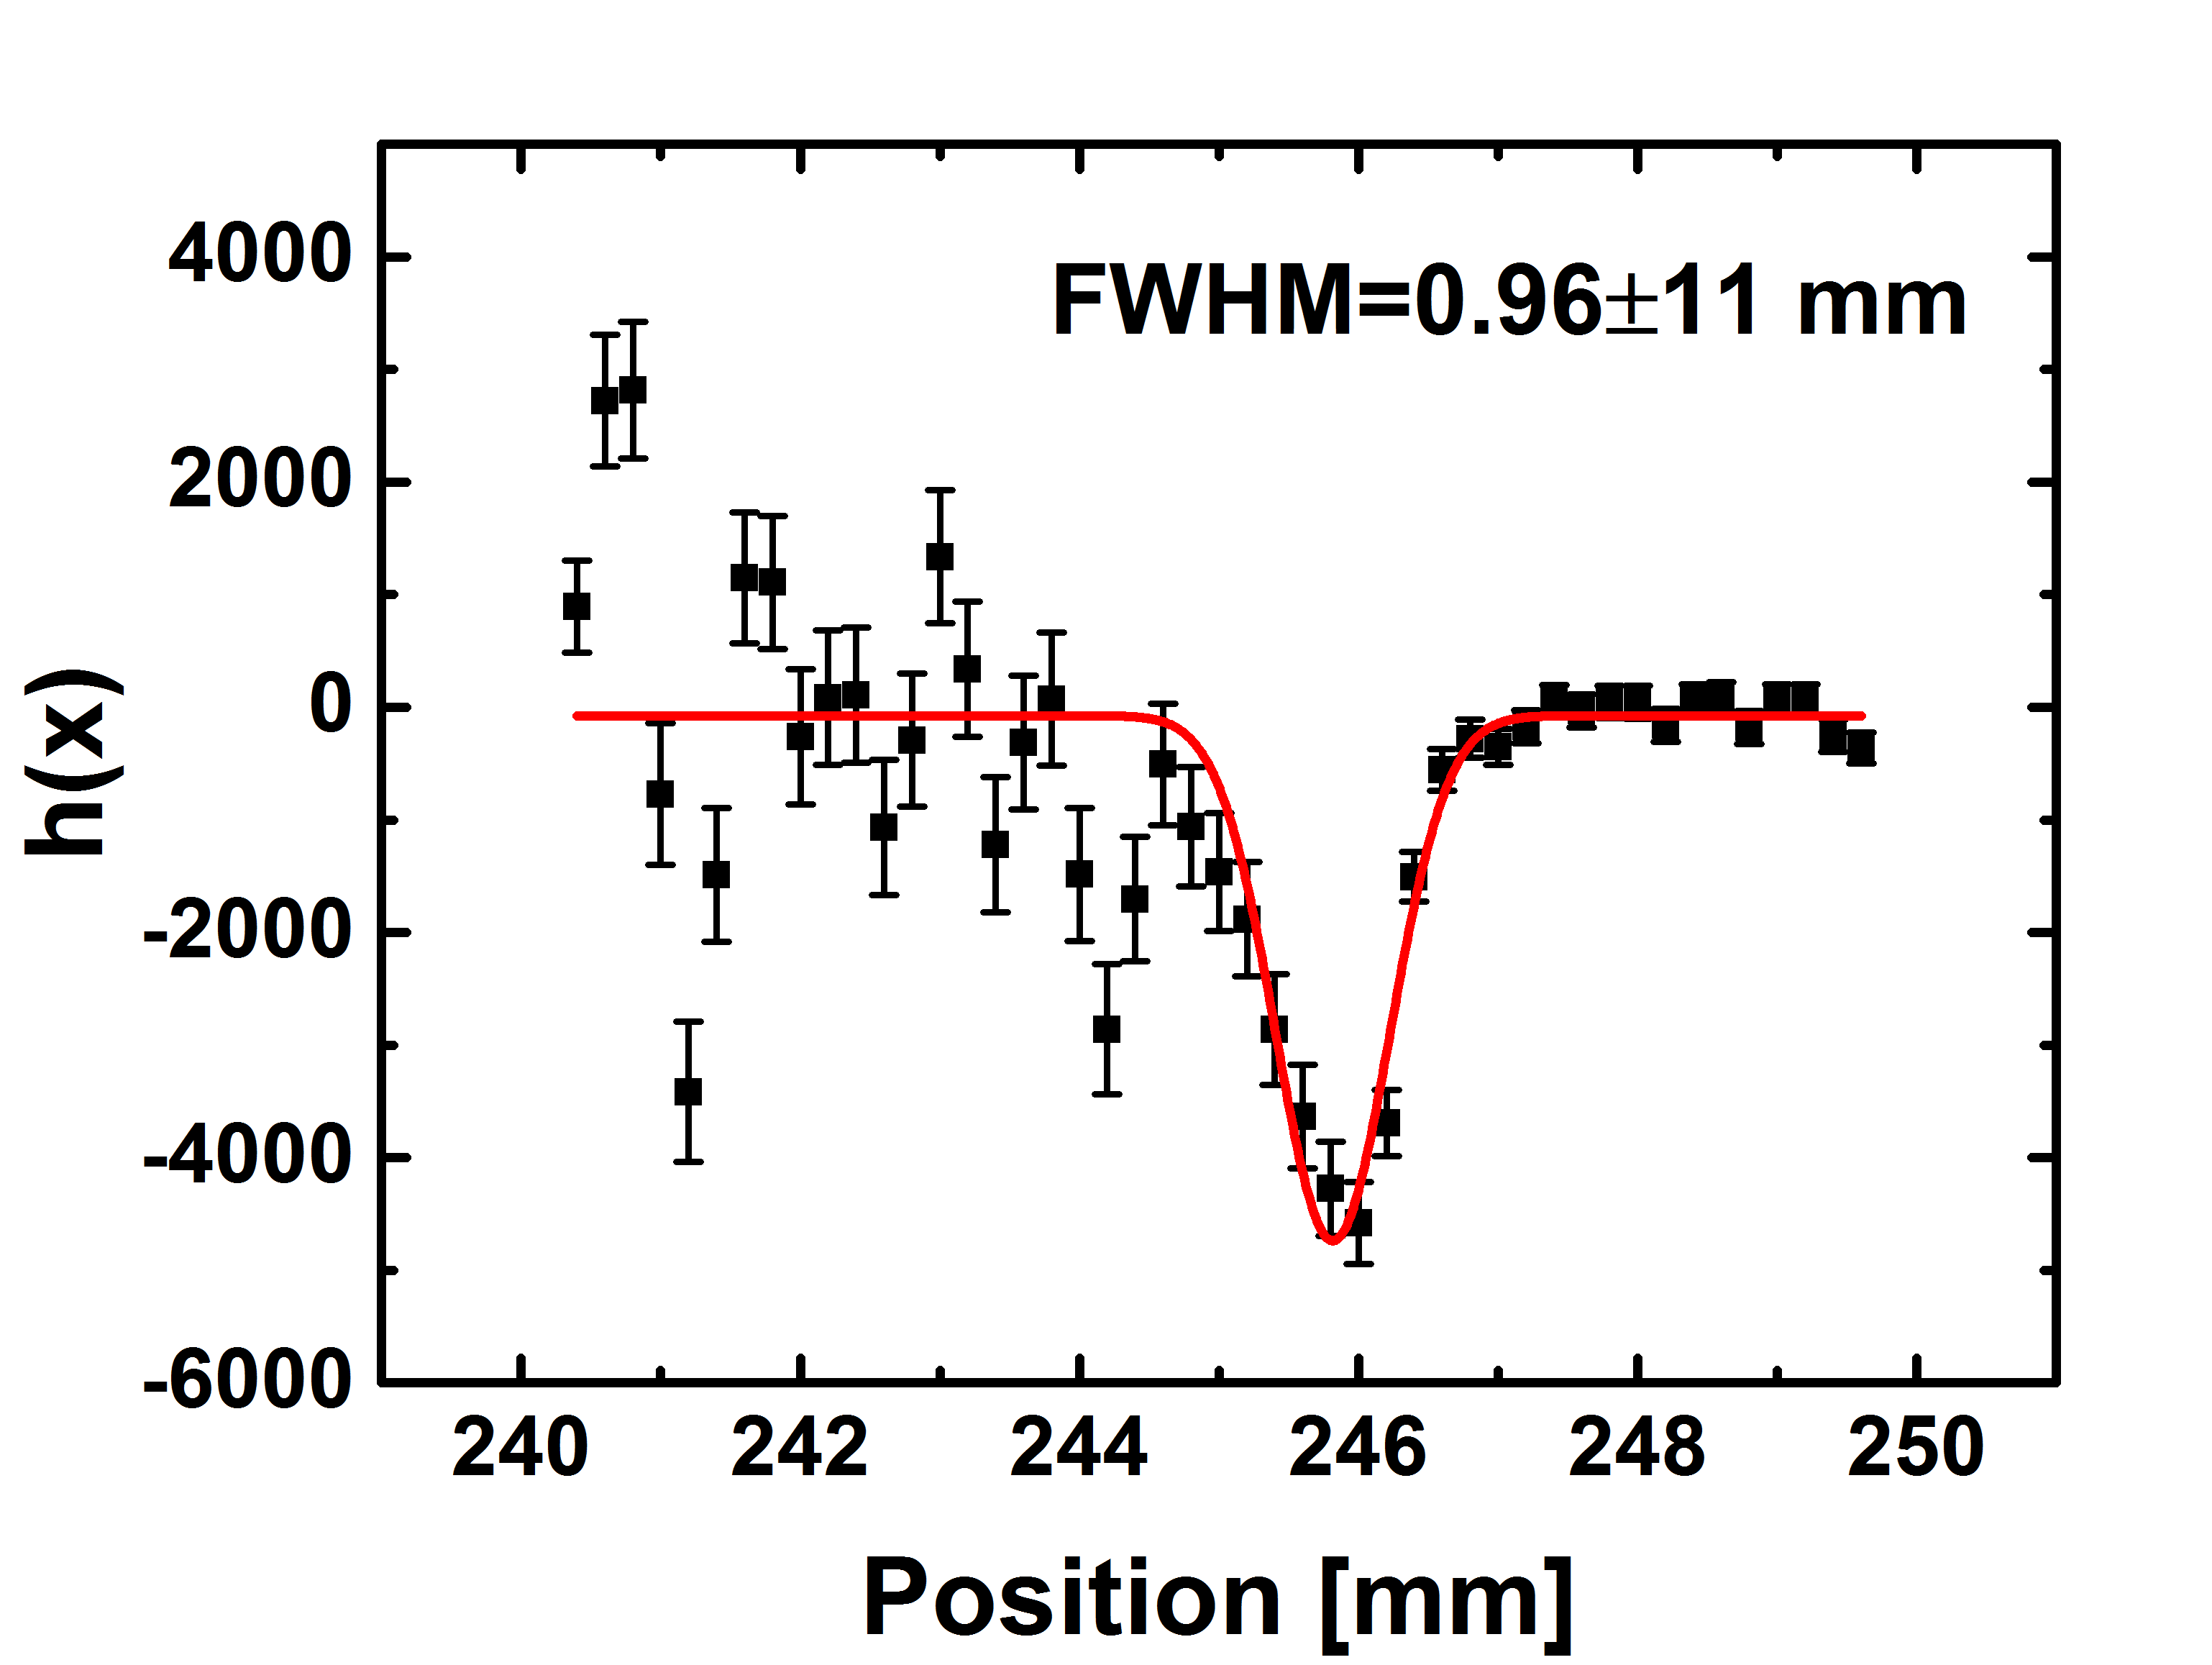
In case of method II only one lead block - - absorbing gamma quanta was used. Since the block size is much larger than the beam profile we assume that the lead block absorbs gamma quanta in the range from to , where denotes beginning of the block. In this case the function of the geometrical detector acceptance can be approximated by:
| (5) |
and hence the derivation of yields:
| (6) |
In Fig. 5 an exemplary distribution of and beam profile obtained in the measurement are shown.
5 Method III
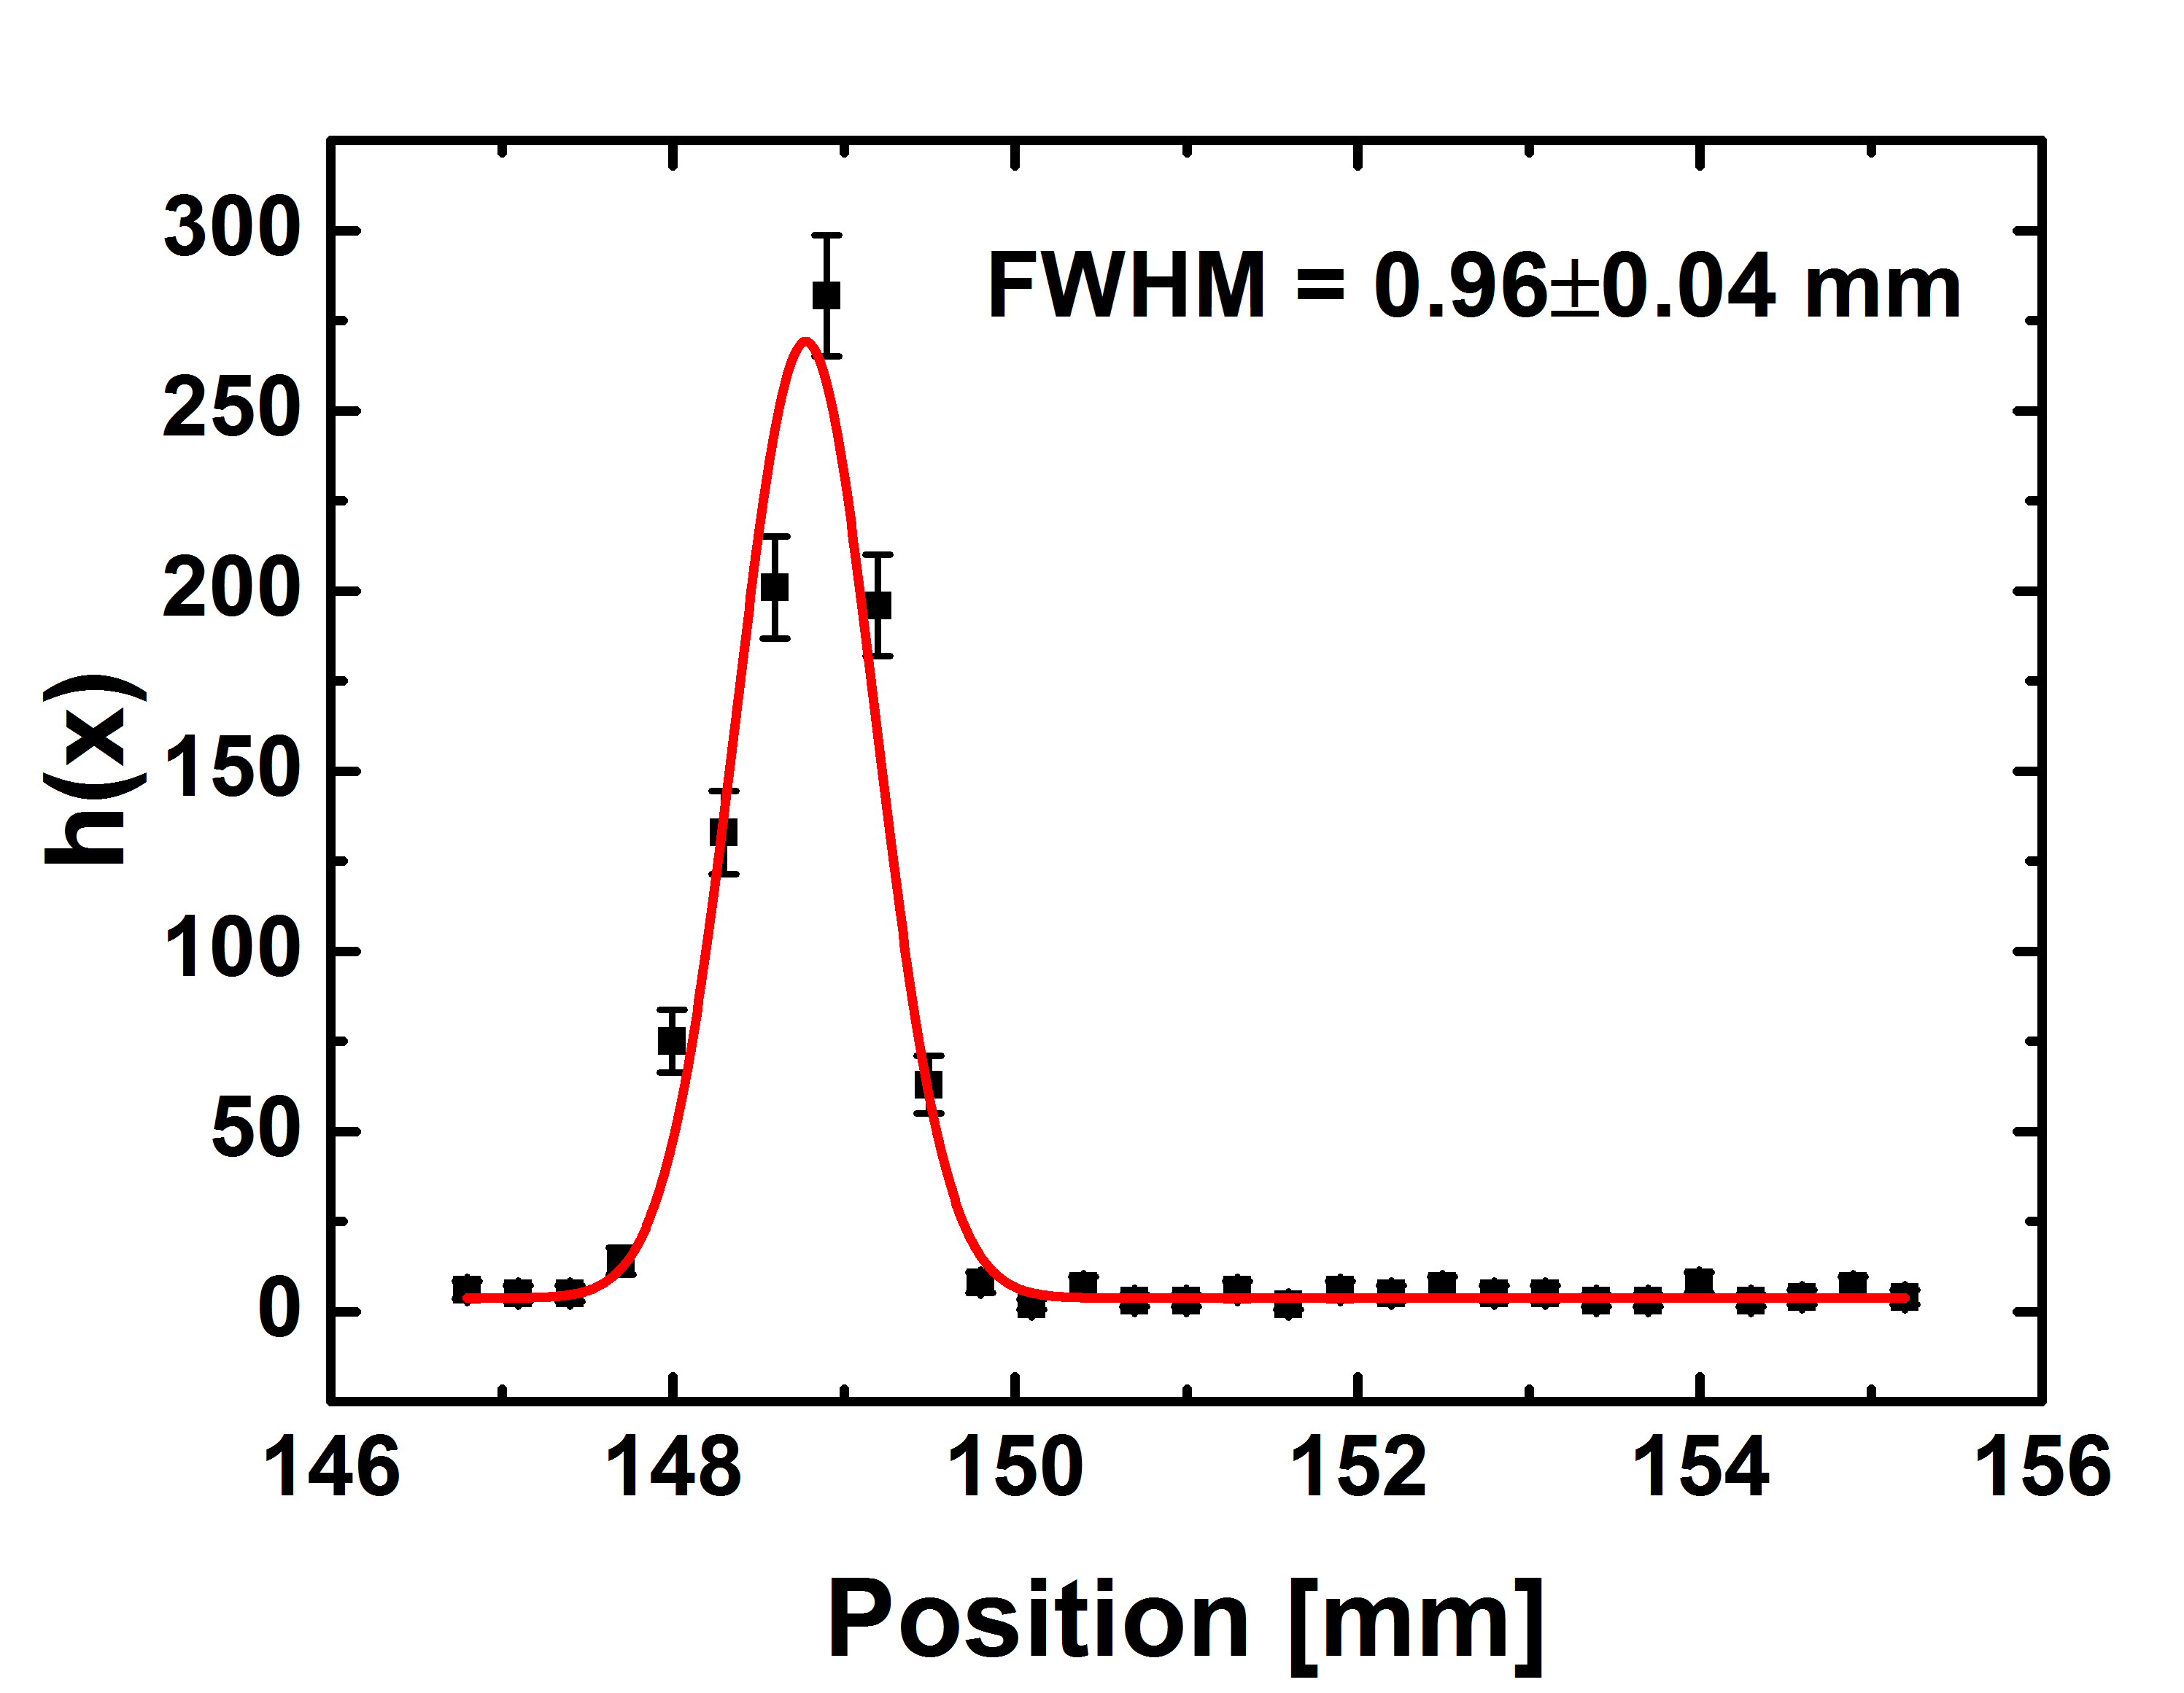
In this part of experiment two lead bricks were placed with 0.3 mm wide slit parallel to the collimator slit (Fig. 2). By moving a collimated beam along the x-axis we have received beam profile directly from the measurement of , without any additional calculation. Below in Fig. 6 results from measurement with two lead bars as a shadow are shown. The reason for the asymmetric shape of the beam profile is not perfectly smooth bar’s surfaces.
As one can see in Tab. 1, obtained values of the width of the beam profile are compatible within the statistical uncertainties for all presented methods and they are equal to about 1 mm. The reason for big statistical errors that occur in methods I and II are mathematical transformations, which allow to extract beam profile form function. Therefore to reduce impact of these calculations method III can be used as a model for the beam profile measurements. One must take into account that it rejects all gamma quanta which do not travel perpendicular to the scintillator, however as it is shown in this paper results for the third method are the same as for two previous one but with much smaller statistical errors. As a result influence of ’shadow’ bars on the beam can be neglected.
| Measurement | FWHM [mm] |
|---|---|
| Method I | 0.96(11) |
| Method II | 0.90(10) |
| Method III | 0.96(04) |
6 Simulations of beam profile for different collimator systems for 24 module J-PET prototype
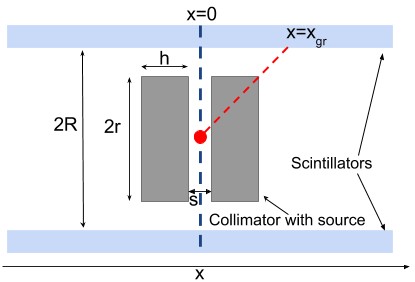
The new collimator for the 24-module barrel tomograph will take advantage of the symmetry of the detector, and thus it consist of two lead cylinders connected with screws (size of which can be neglected regarding the scattering effects in further considerations) placed in a way such, that the beam of gamma quanta will irradiate all the detection modules at the same time. Moreover, it should provide a precise position determination of the beam. In that case the main difficulty which we have to deal with is the weight of the cylinders. Due to high density of lead arms supporting the collimator are exposed to big bending moments which may destroy the symmetry of the whole system and prevent precise measurements. Due to cylindrical symmetry of both the detector and collimator, the whole problem can be reduced to two dimensions. The schematic view of the assumed geometry is shown in Fig. 7. The two lead cylinders with radius and height are distant from each other by (slit). The distance between scintillators amounts to . We assume the point-like 22Na source emitting gamma quanta isotropically in every direction. As it was already mentioned the scattering of gamma quanta is neglected assuming only one act of interaction with material of the collimator.
The beam of gamma quanta passing through the collimator material is attenuated according to the equation:
| (7) |
where: - the number of gamma quanta which passed through depends only on the length of the path in the material (if it is homogeneous).
The attenuation length depends on the material and the energy of the photon:
| (8) |
where: is the Avogadro number, and denote the density and molar mass of the material, respectively. stands for the total cross sections of gamma quanta interaction with lead. Since we are dealing with the emitted gamma quanta of energy passing through lead the value of amounts to (where ).
To determine the dependence for annihilation quanta we have parametrized the path length with the position along the scintillator . Using the symmetry (since we assume the source position exactly in the geometric center) it is enough to consider only values of . The dependence can be then expressed as:
| (9) |
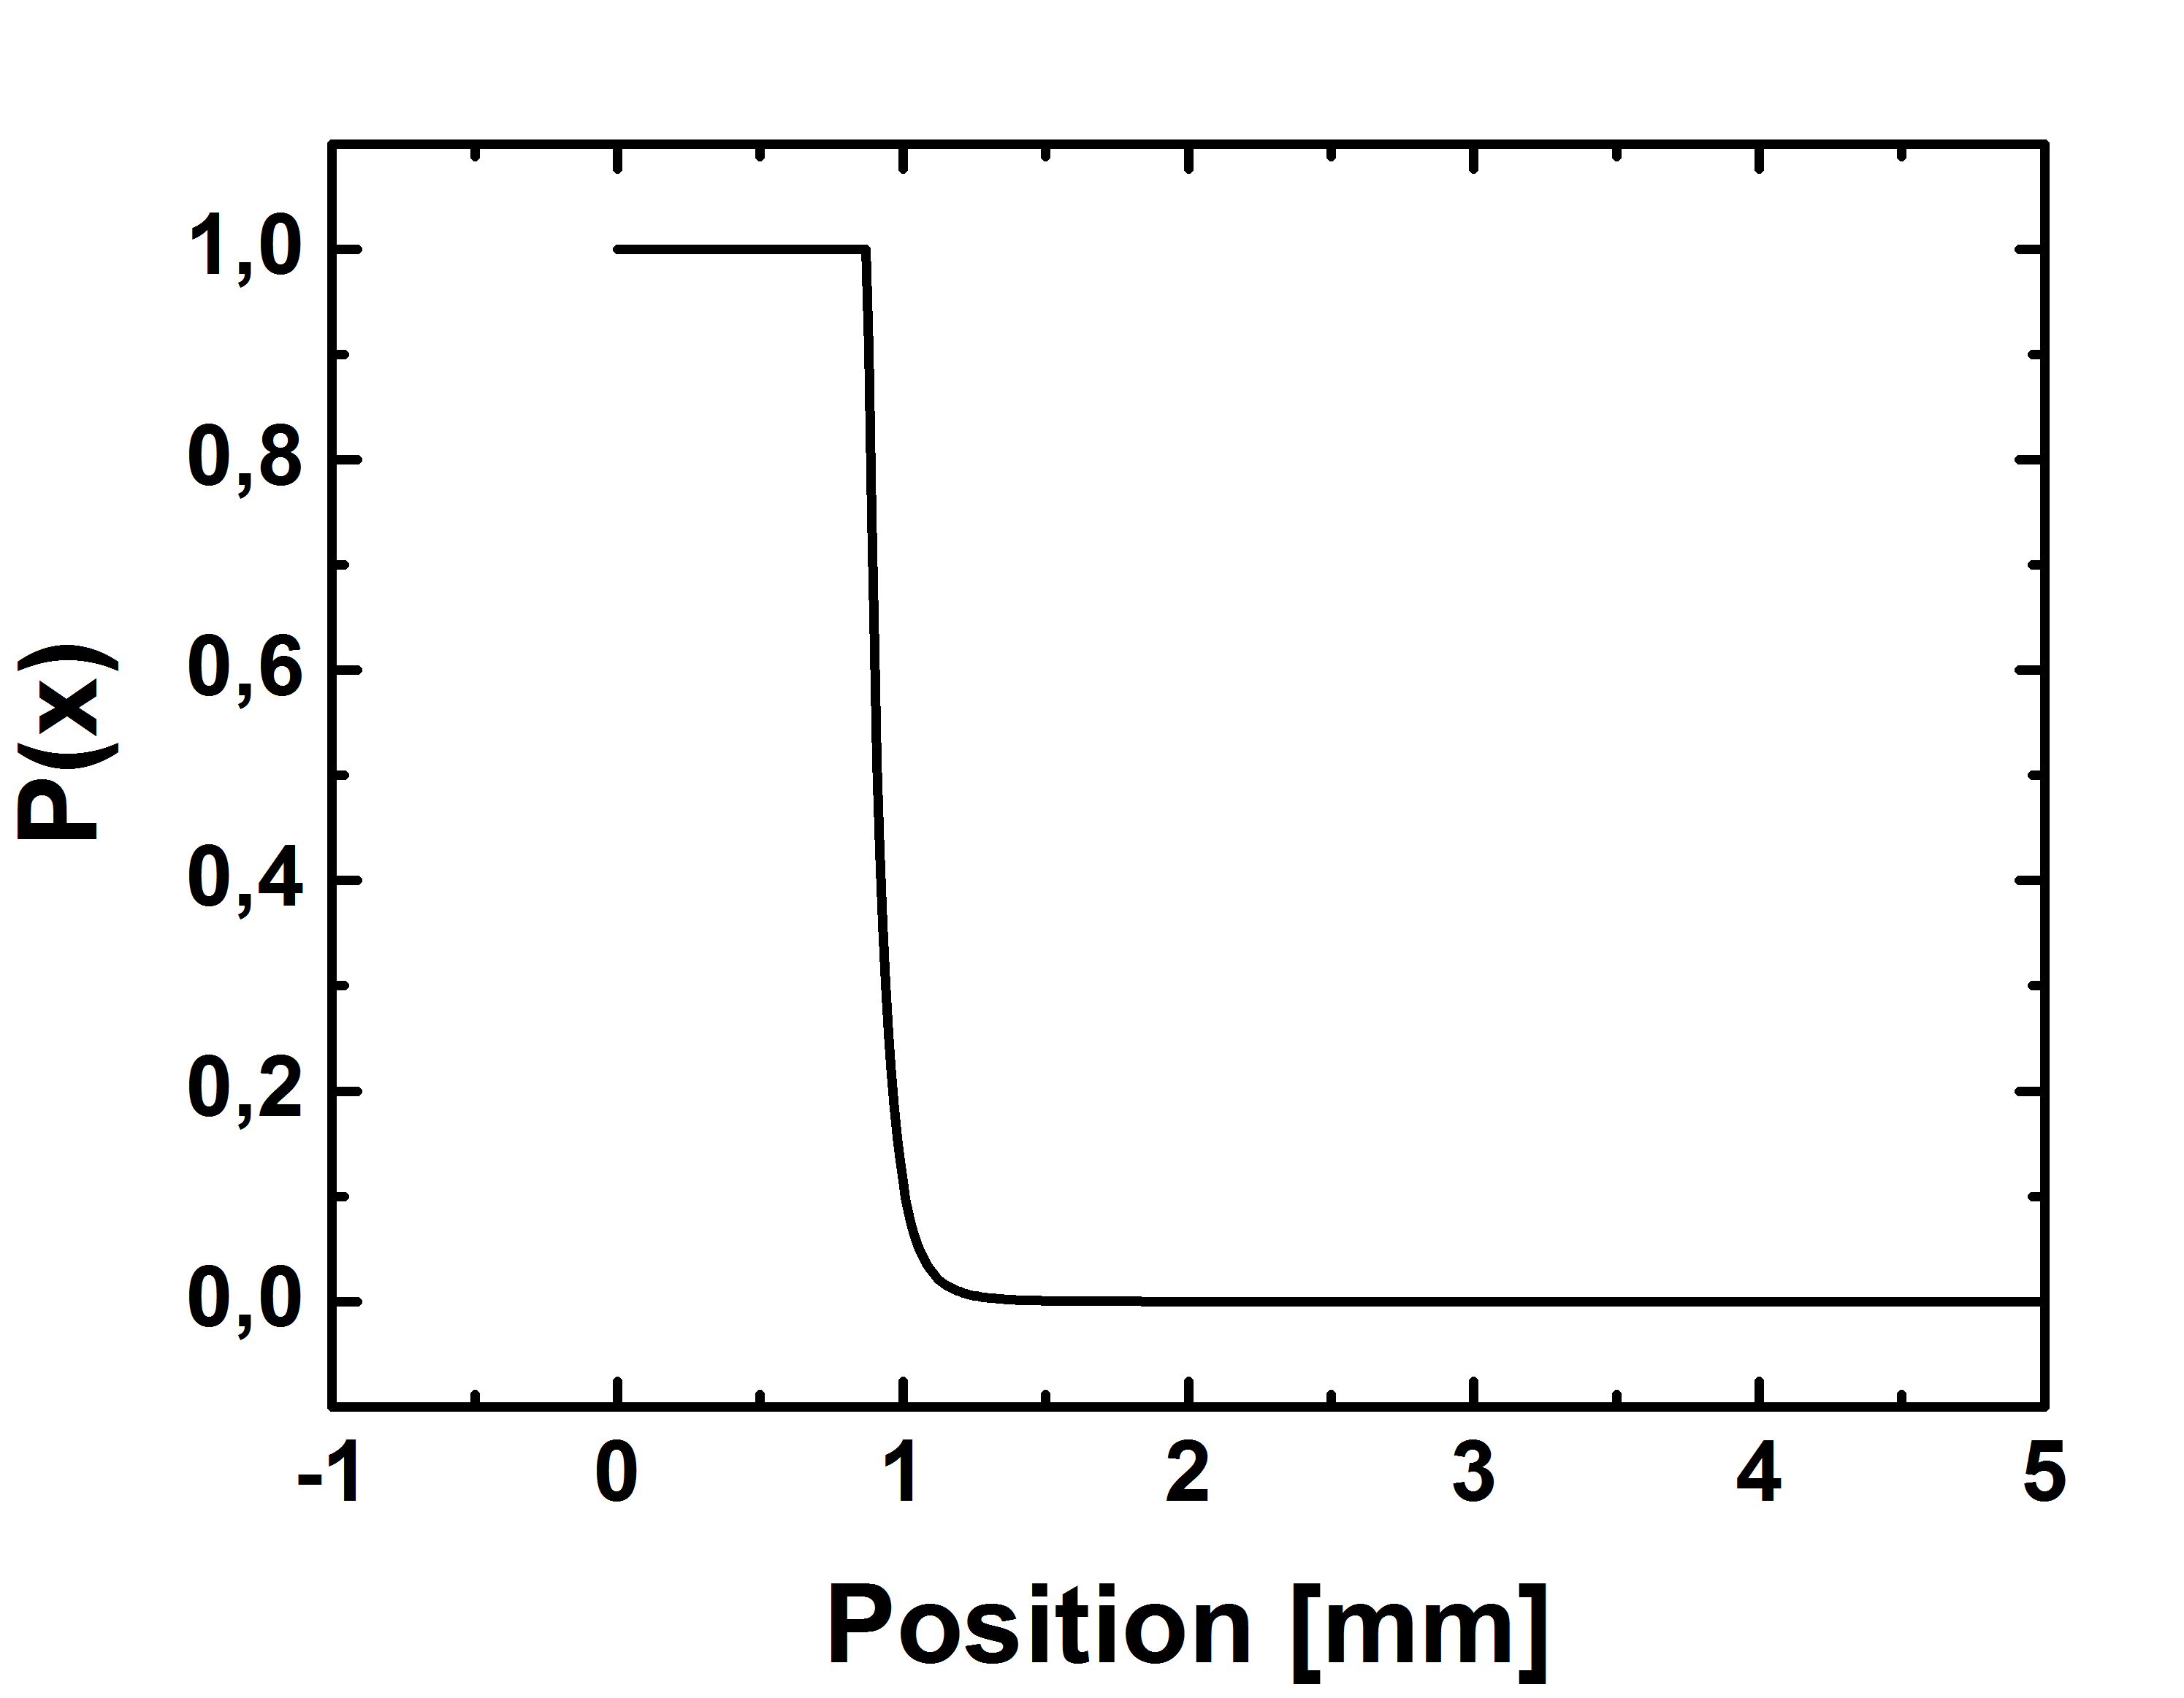
where: is the position for which is maximum (see Fig. 7). This parametrization allows to calculate the probability of annihilation gamma quantum passing through the collimator and as a consequence, the beam profile. These calculations were done for different dimensions of the collimator, as one can see in the Tab. 2, assuming .
| r [mm] | h [mm] | FWHM/2 [mm] | Weight [kg] |
|---|---|---|---|
| 100 | 30 | 0.91 | 10.7 |
| 100 | 50 | 0.91 | 17.9 |
| 50 | 100 | 1.90 | 8.9 |
| 50 | 50 | 1.90 | 4.5 |
| 100 | 10 | 0.92 | 3.6 |
| 80 | 50 | 1.16 | 11.5 |
| 80 | 30 | 1.16 | 6.9 |
| 90 | 30 | 1.10 | 8.7 |
| 70 | 30 | 1.34 | 5.3 |
| 60 | 50 | 1.56 | 6.4 |
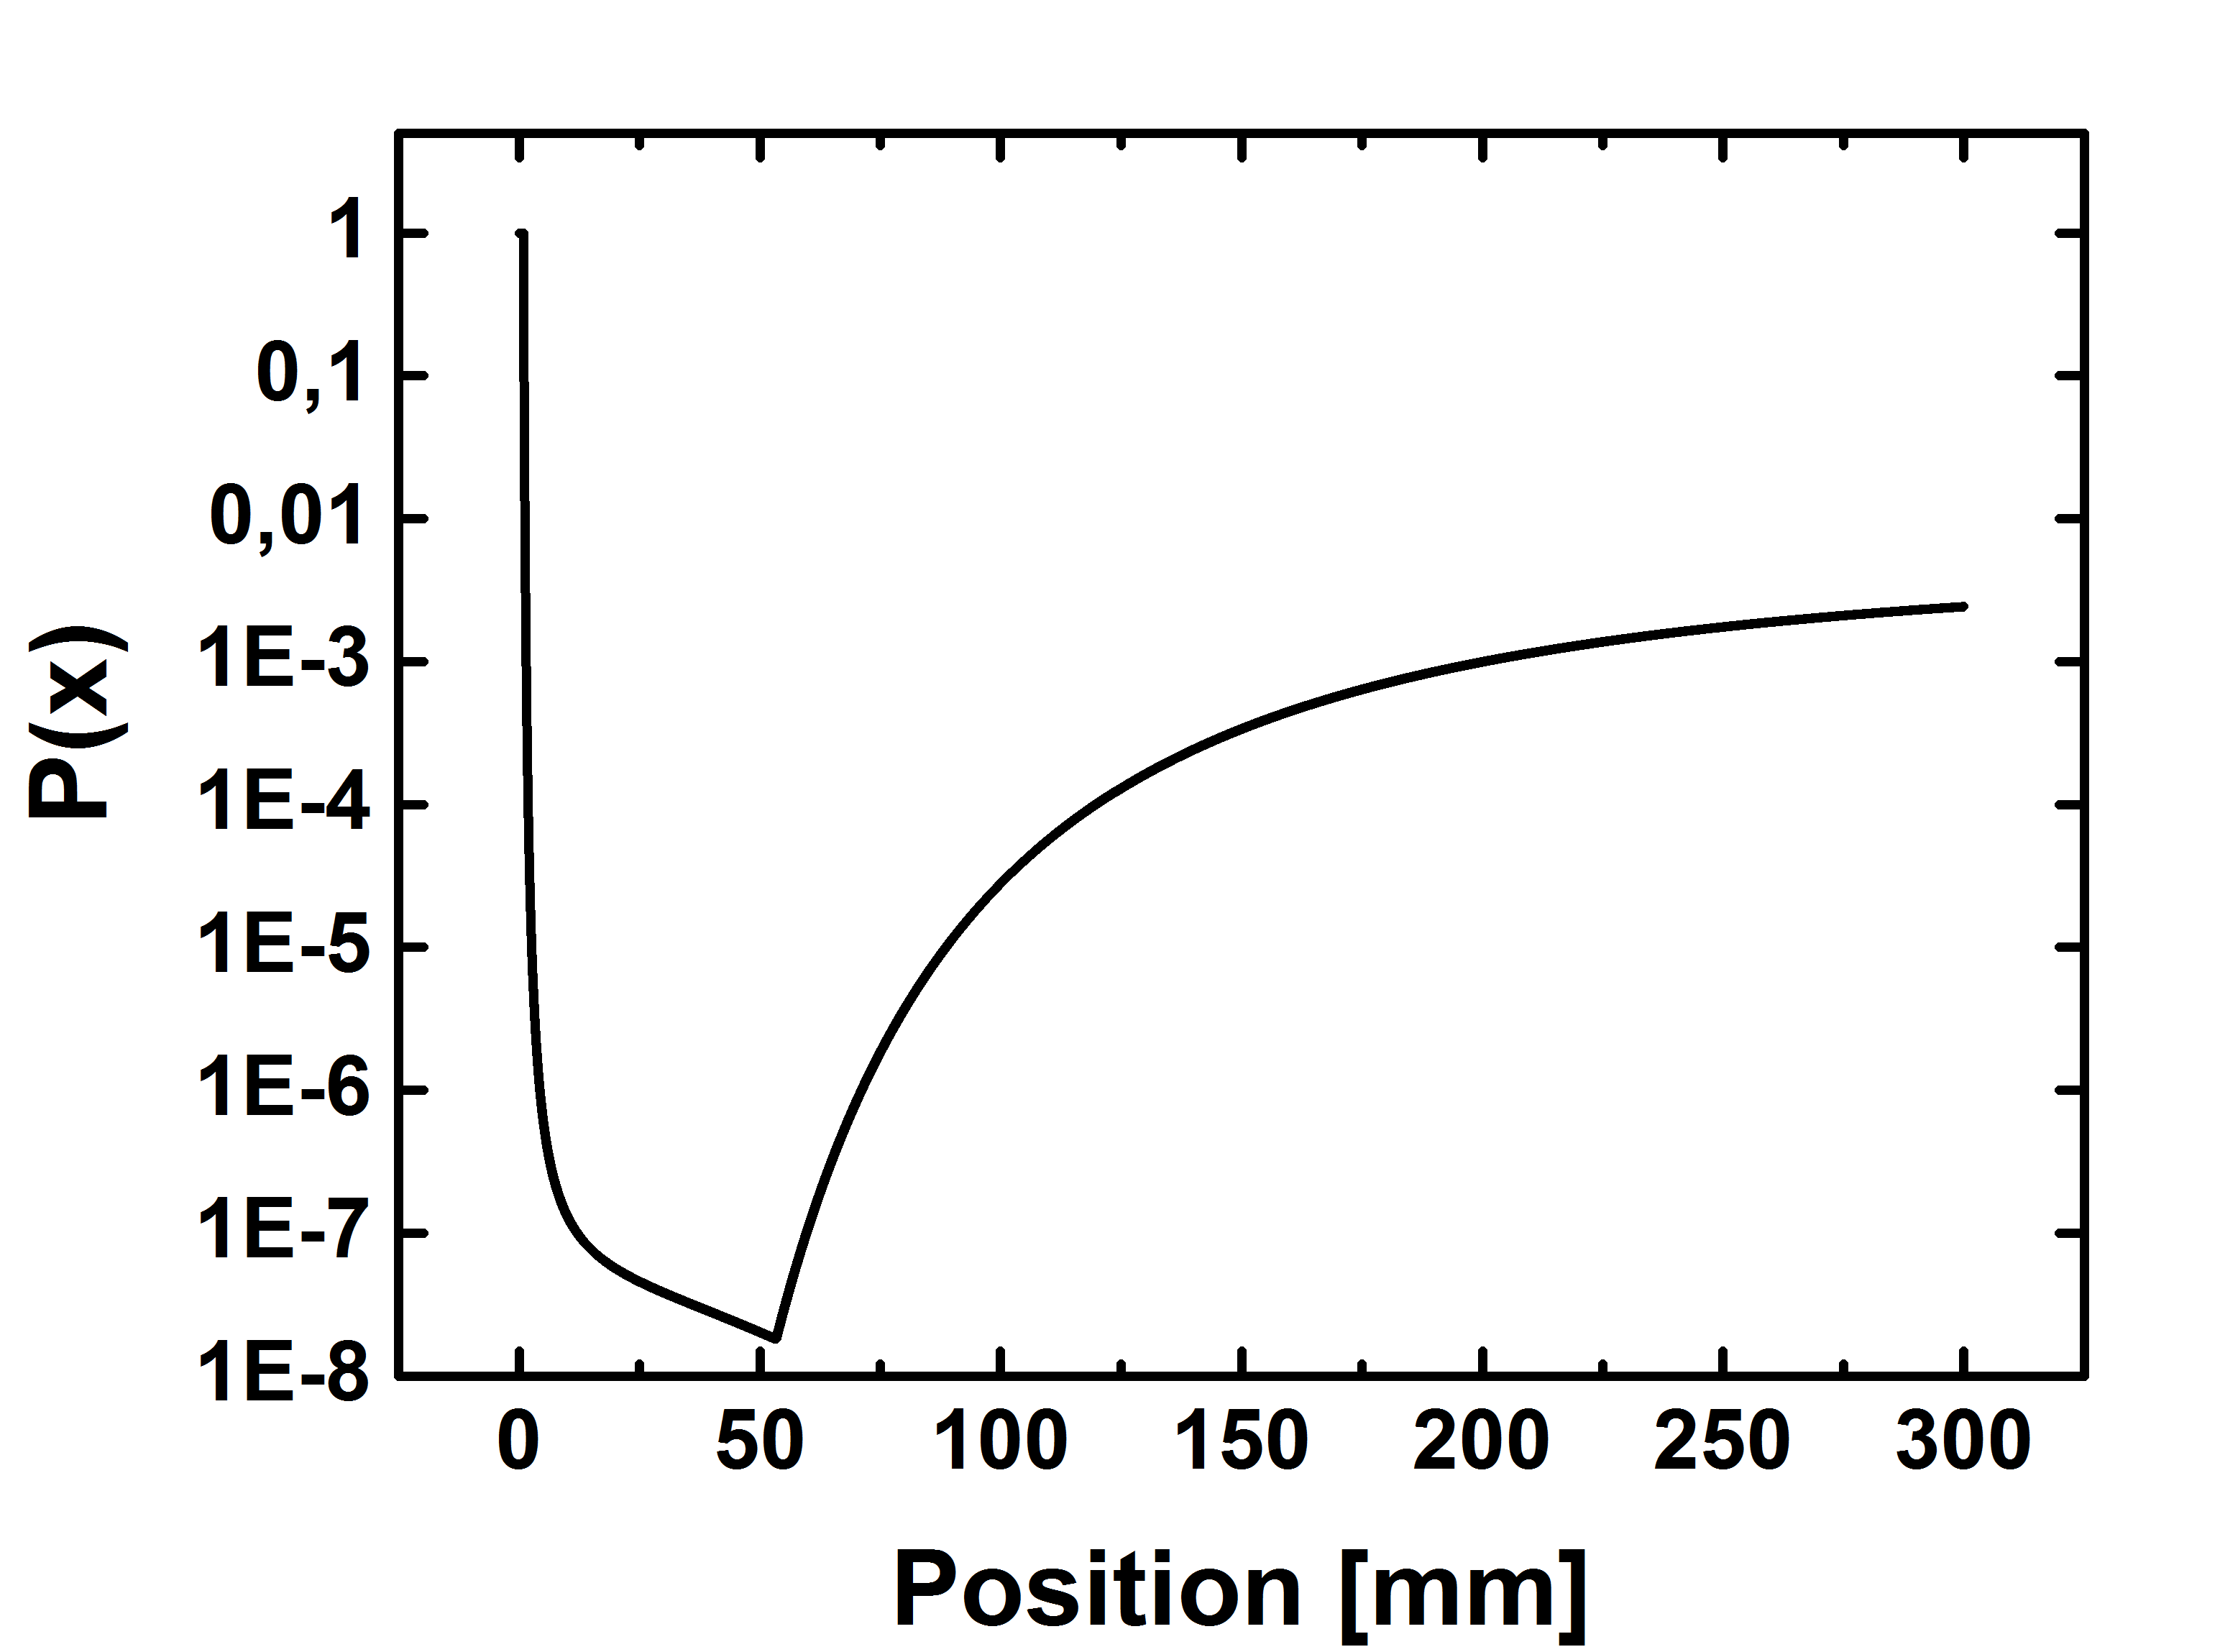
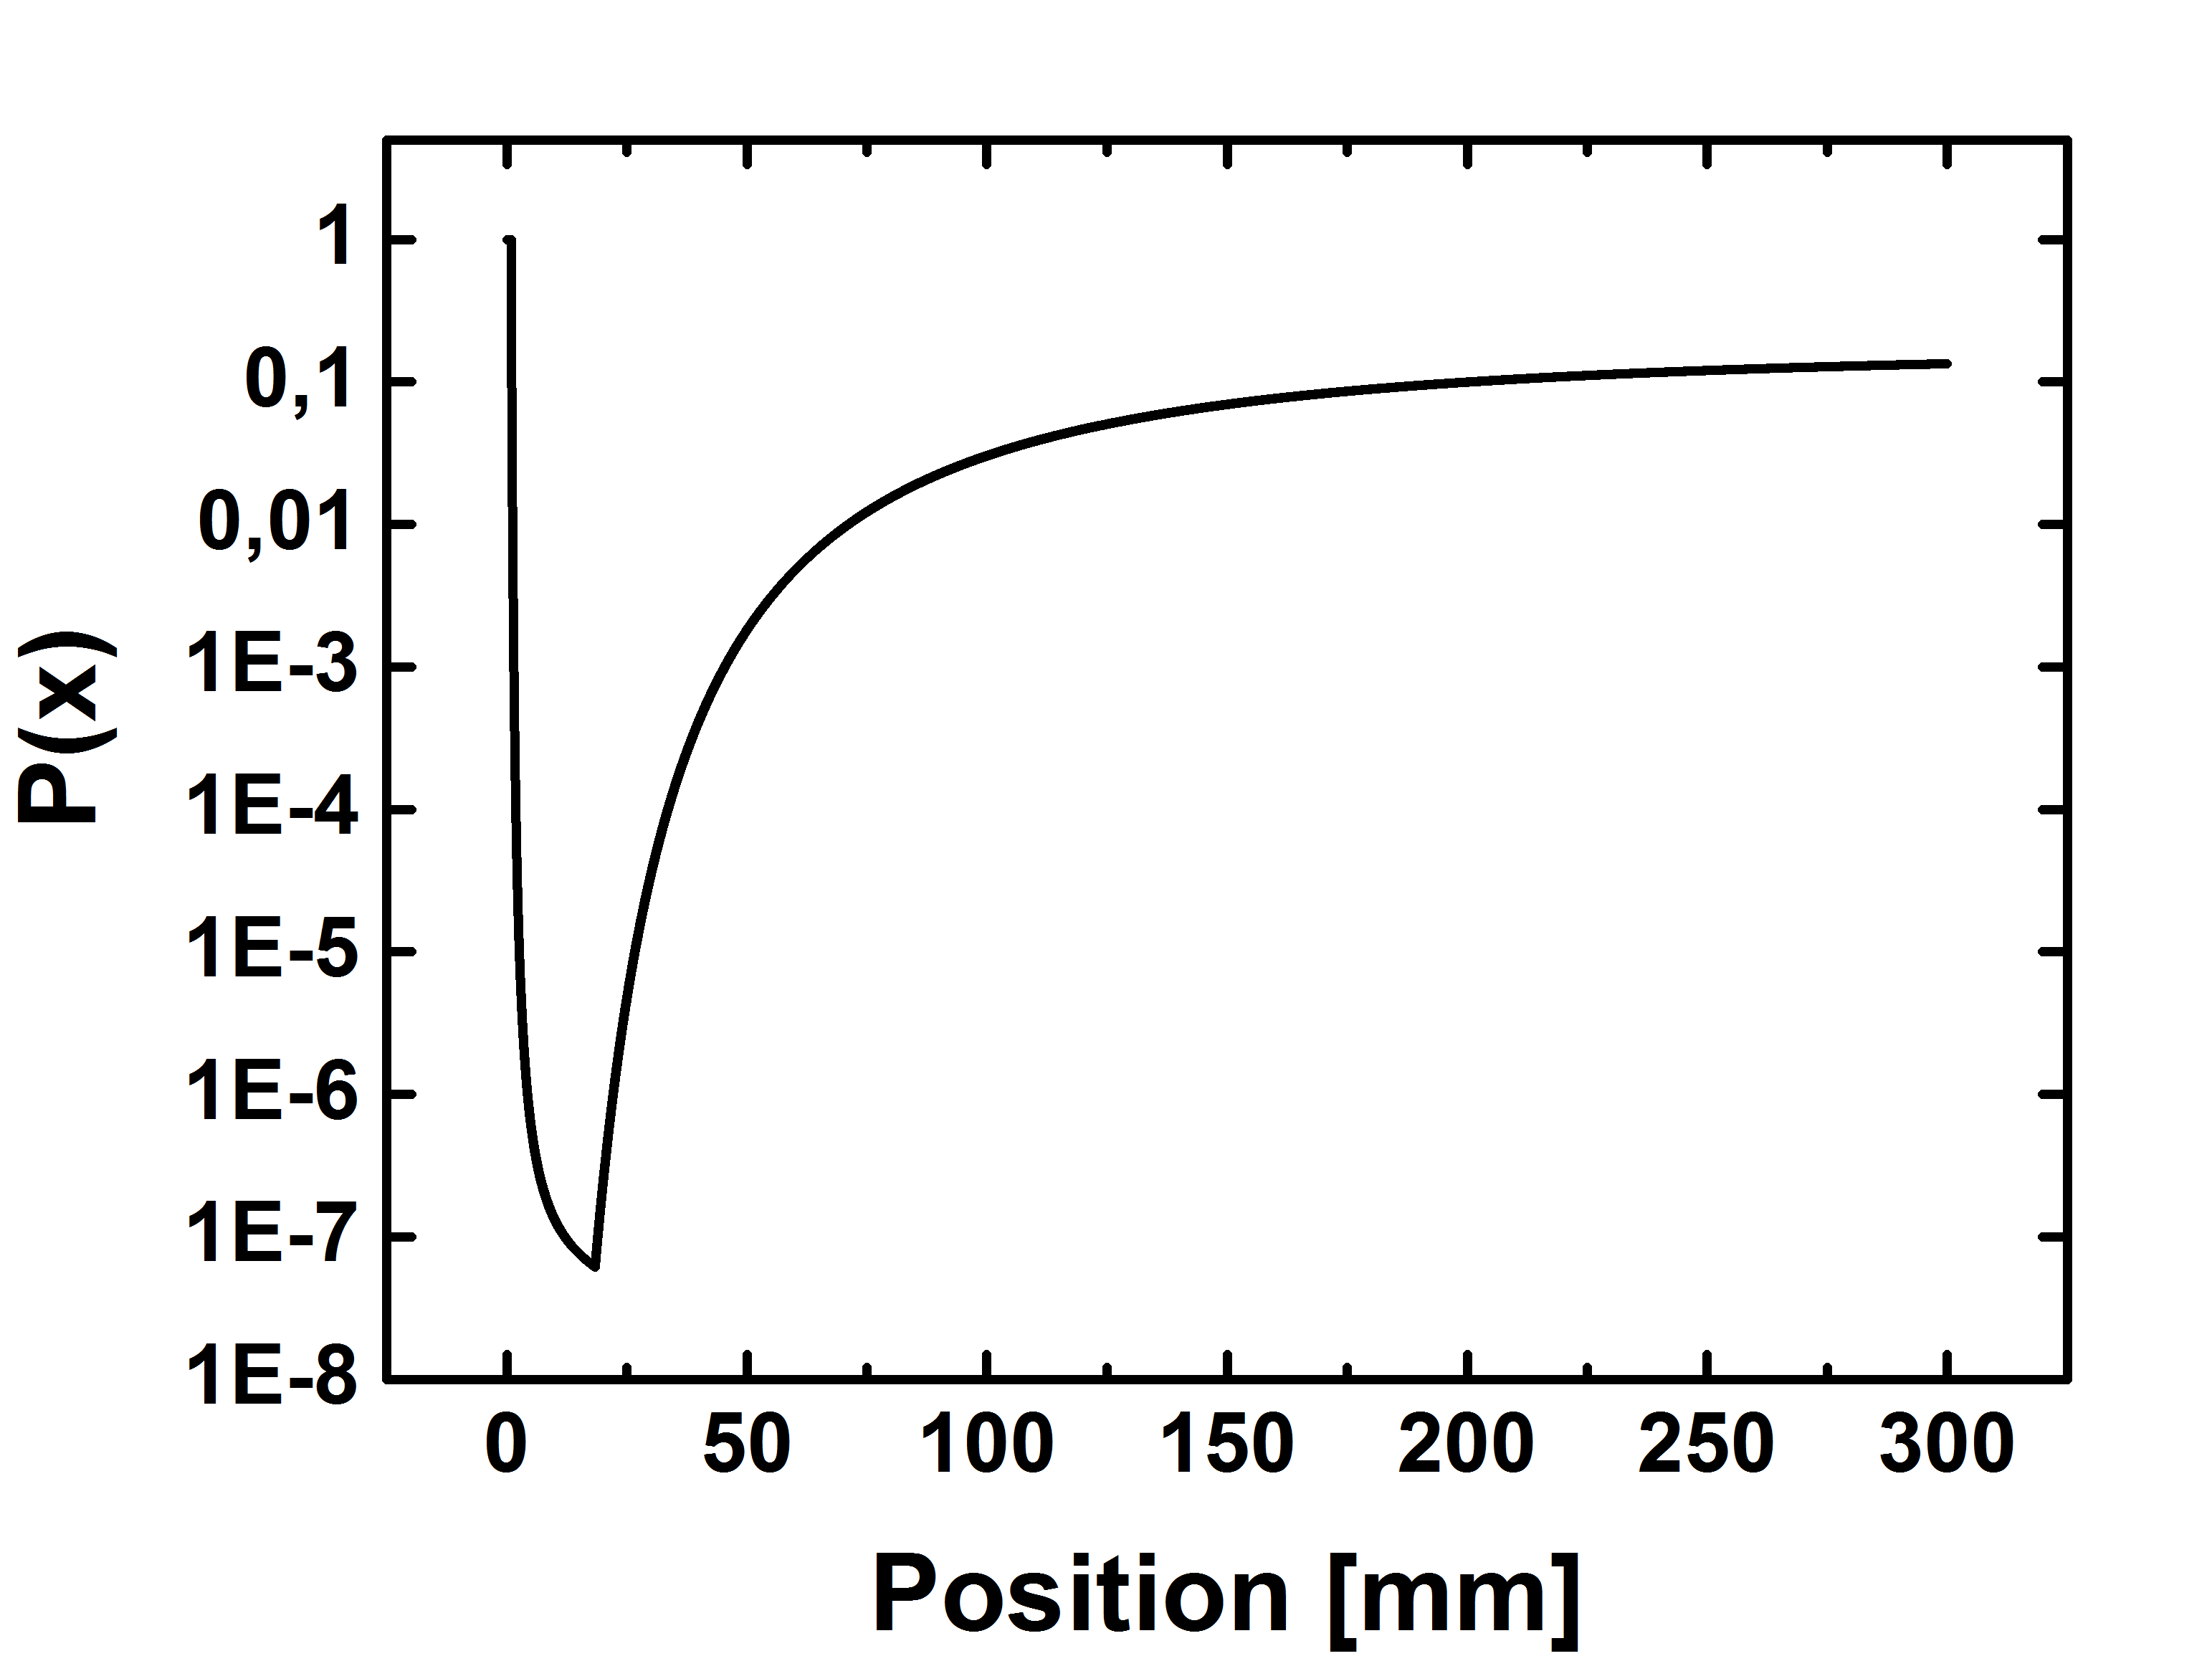
In Fig. 8 and 9 results of beam profile calculation for two chosen collimator systems are shown.

7 Conclusions
In order to design the optimal collimator system for the 24 module J-PET prototype, first we have studied a beam profile of the annihilation quanta emitted from the 22Na or 68Ge sources installed in the collimator with 1.3 mm wide slit and the two module detector. Three methods of the beam profile determination were presented. First method allowed for the ’wider’ possible beam size estimation, second method contains the contribution from the gamma quanta that do not travel perpendicularly to the scintillator and the third method gives the estimation only for gamma quanta that travels perpendicularly to scintillator. Results obtained with all the methods are consistent within statistical uncertainties and show that the beam profile has a Gaussian shape with the FWHM equal to about 1 mm. The obtained result proves that the way of the collimation is suitable for the determination of the library of model signals required for the hit-time and hit-position determination when using reconstruction methods described in references [10, 13, 14].
For the 24 module detector not only width of the beam profile is important but also weight and size of collimator system, therefore to choose optimal solution simulations of the beam profile for different sizes of collimator were performed. What can be seen form the presented calculations is that the beam profile depends much more on the value than on (which was expected from purely geometrical considerations). Taking into account the weight and beam profile we have decided to construct two cylindrical collimators with dimensions: , (Fig. 8) and , (Fig. 9). For the latter we observe the increase of the probability of gamma quantum to pass through the collimator for , however this background could be rejected taking into account the time difference registered at both ends of the scintillator.
8 Acknowledgements
We acknowledge technical support by A. Heczko, M. Kajetanowicz, W. Migdał and the financial support by the Polish National Center for Research and Development through grant INNOTECH-K1/1N1/64/159174/
NCBR/12 and through LIDER grant 274/L-6/14/NCBR/2015, and the Foundation for Polish Science through MPD programme, and the EU and MSHE Grant No. POIG.02.03.00 - 161 00-013/09, and Marian Smoluchowski Krakow Research Consortium ”Matter-Energy-Future”.
References
- [1] M. Conti (2009) State of the art and challenges of Time-of-flight PET, Phys Medica; 25, 1-11. DOI:10.1016/j.ejmp.2008.10.001
- [2] J. S. Karp, S. Surti, M. E. Daube-Witherspoon, G. Muehllehner (2008) Benefit of Time-of-Flight in PET: Experimental and Clinical Results, J Nucl Med; 49, 462-470. DOI:10.2967/jnumed.107.044834
- [3] A. K. Buck, K. Herrmann, T. Stargardt, T. Dechow, B. J. Krause, J. Schreyögg (2010) Economic Evaluation of PET and PET/CT in Oncology: Evidence and Methodologic Approaches. Journal of Nuclear Medicine 51(3):401-412
- [4] J. S. Keppler , P . S.Conti (2001) A cost analysis of positron emission tomography AJR:177, 31-40
- [5] A. Blanco et al., (2009) Efficiency of RPC detectors for whole-body human TOF-PET, Nucl. Instrum. and Meth. A 602 780
- [6] J. L. Lacy , Ch. S. Martin , L. P. Armendarez , (2001) High sensitivity, low cost PET using led-wal straw detectors, Nucl. Instrum. and Meth A 471 88
- [7] P. Moskal et al. (2012) Strip-PET: a novel detector concept for the TOF-PET scanner, Nuclear Med Rev: 15 C: C68-C69
- [8] P. Moskal et al. (2012) TOF-PET detector concept based on organic scintillators, Nuclear Med Rev: 15. C: C81-C84
- [9] P. Moskal et al. (2014) Test of a single module of the J-PET scanner based on plastic scintillators. Nucl. Instr. and Meth. A 764, 317-321. doi:10.1016/j.nima.2014.07.05 arXiv:1407.7395
- [10] P. Moskal et al. (2015) A novel method for the line-of-response and time-of-flight reconstruction in TOF-PET detectors based on a library of synchronized model signals. Nucl. Instr. and Meth. A 775, 54-62. doi:10.1016/j.nima.2014.12.005; arXiv:1412.6963
- [11] P. Moskal et al. (2015) Hit time and hit position reconstruction in the J-PET detector based on a library of averaged model signals Acta Phys. Pol. A127, 1495 – 1499. DOI:10.12693/AphysPolA.127.1495 arXiv:1502.07886
- [12] N. G. Sharma ea al., (2015) Reconstruction of hit time and hit position of annihilation quanta in the J-PET detector using Mahalanobis distance, NUKLEONIKA 2015;60(4):765-769
- [13] L. Raczyński et al. (2014) Novel method for hit-positon reconstruction using voltage signals in plastic scintillators and its application to the Positron Emission Tomography. Nucl. Instr. and Meth. A 764, 186-192. doi:10.1016/j.nima.2014.07.032; arXiv:1407.8293
- [14] L. Raczyński et al. (2015) Compressive sensing of signals generated in plastic scintillators in a novel J-PET instrument. Nucl. Instr. and Meth. A 786, 105-112. DOI:10.1016/j.nima.2015.03.032
- [15] A. Wieczorek et al. (2015) A pilot study of the novel J-PET plastic scintillator with 2-(4-styrylphenyl)benzoxazole as a wavelength shifter. Acta Phys. Pol. A 127, 1487-1490. doi:10.12693/AphysPolA.127.1487; arXiv:1502.02901
- [16] M. Pałka et al., (2014) A novel method based solely on FPGA units enabling measurement of time and charge of analog signals in Positron Emission Tomography, Bio Algorithms and Med-Systems 10 41
- [17] Hamamatsu [http://www.hamamatsu.com/us/en/index.html]
- [18] Scintillator Products, Saint Gobain Ceramics & Plastics (2009)