N-Type Oxide Thermoelectrics Via Visual Search Strategies
Abstract
We discuss and present search strategies for finding new thermoelectric compositions based on first principles electronic structure and transport calculations. We illustrate them by application to a search for potential n-type oxide thermoelectric materials. This includes a screen based on visualization of electronic energy isosurfaces. We report compounds that show potential as thermoelectric materials along with detailed properties, including SrTiO3, which is a known thermoelectric, and appropriately doped KNbO3 and rutile TiO2.
Thermoelectrics are an energy conversion technology that is used in spacecraft power generation, portable coolers and other areas. Wood (1988); Riffat and Ma (2003); Yang and Caillat (2006); DiSalvo (1999) The direct thermal to electrical energy conversion provided by this technology and its scalability to low size and power suggests numerous potential applications. Kraemer et al. (2011); Kumar et al. (2013) However, this is limited by the low efficiency of existing devices, in turn limited by the performance of known thermoelectric materials. The maximum efficiency is governed by a dimensionless, but temperature dependent figure of merit, =, where is absolute temperature, is electrical conductivity, is thermopower (also known as the Seebeck coefficient) and is the thermal conductivity, usually written as a sum of electronic and lattice contributions, =+, which is typically a good approximation.
Thermoelectric materials pose a particular challenge to materials genome approaches. This is because thermoelectric performance, characterized by a figure of merit, , is a contraindicated property of matter. In particular, standard common models, such as the isotropic parabolic band model, with normal assumptions predict that high will not occur. This means that very high performance thermoelectric materials have unusual electronic features, a number of which have been proposed and identified as important in various cases. These include reduced dimensionality, either in artificial structures Hicks and Dresselhaus (1993) or due to details of band formation, and other complex electronic structure characteristics. Kuroki and Arita (2007); Chen et al. (2013); Usui et al. (2013, 2010); Shirai and Yamanaka (2013); Parker et al. (2013); Mecholsky et al. (2014); Pei et al. (2011); Bjerg et al. (2011); Ohkubo and Mori (2015); Shi et al. (2015)
Most good thermoelectric materials, such as (Bi,Sb)3Te2, PbTe, Si-Ge, skutterudites and Mg2(Si,Sn) are narrow to moderate gap semiconductors. Several papers reporting searches for new semiconductors with thermoelectric potential have been reported. Madsen (2006); Curtarolo et al. (2013); Wang et al. (2011); Bhattacharaya and Madsen (2015) However, there are several thermoelectric materials that do not fit in the category of moderate band gap semiconductors, including some oxides. Oxides can potentially offer a number of advantages for application including perhaps low cost ceramic materials processing. Fergus (2012); Koumoto et al. (2010) The high oxide thermoelectrics are NaxCoO2 and closely related p-type layered Co and Rh oxides, with figures of merit approaching 1. Terasaki et al. (1997); Hebert et al. (2001); Miyazaki et al. (2002); Koumoto et al. (2006) The best -type oxide thermoelectrics are very different, and the best -type values barely exceed 0.5. This is found in ZnO ceramics at very high temperature. Ohtaki et al. (2009); Jood et al. (2014); Ong et al. (2011) This is an oxide semiconductor with a substantial gap.
A particular challenge in finding new oxide thermoelectrics is that depends strongly on doping level, among other material parameters, and therefore assessing the potential of a given material requires detailed doping studies. Here we demonstrate some simple measures that can be readily calculated from first principles and used in searching for new oxide thermoelectrics. For this purpose, we use a set of early transition metal and simple oxides, selected with a view to having oxides that are at least potentially dopable n-type, based on the criterion that they either are known to be dopable or that they have the same transition element and similar coordination to a dopable material. The list includes two known transparent conductors, In2O3 and BaSnO3, several niobates and titanates as well as BaZrO3 for comparison. We focus on high temperature because the thermoelectric performance generally increases with temperature for wide band gap materials, and so if there are any high n-type oxide thermoelectrics in this class, they are likely to have their best performance at high temperatures. We note that several of these materials have complex heavy valence band structures, which might suggest p-type thermoelectricity. However, these compounds are all naturally n-type, and p-type doping is unlikely to be feasible; we do not pursue this further.
The calculations were performed consistently for all compounds. The first principles calculations used the general potential linearized augmented planewave (LAPW) method, Singh and Nordstrom (2006) as implemented in the WIEN2k code, Blaha et al. (2001) with well converged LAPW basis sets, including local orbitals for semicore states. Experimental lattice parameters were used, while atomic coordinates were determined by energy minimization, subject to the experimental space group symmetry. This was done with the generalized gradient approximation functional of Perdew, Burke and Ernzerhof (PBE-GGA). Perdew et al. (1996) Electronic structures were then calculated using the modified Becke-Johnson potential of Tran and Blaha (mBJ), Tran and Blaha (2009) which improves band gaps of these materials relative to PBE. Tran and Blaha (2009); Koller et al. (2011); Singh (2010a); Kim et al. (2010); Singh (2010b) Transport coefficients were obtained from the electronic structures using the constant scattering time approximation and the BoltzTraP code. Madsen and Singh (2006) The Seebeck coefficients presented are all ceramic averages, defined by , where is the electrical conductivity.
In order to develop screens for thermoelectric oxides, it is useful to begin with a parabolic band model. For a degenerate doped single parabolic band (SPB), effective mass, , the Seebeck coefficient at low temperature () in the constant scattering time approximation is given by
| (1) |
where is measured from the band edge (note is negative). Thus increases linearly with effective mass and temperature, and decreases as the 2/3 power of carrier concentration. The expression in terms of holds more generally for a degenerate doped single parabolic band, regardless of the anisotropy of the effective mass tensor and importantly, when written in terms of the energy, is independent of . Kolodziejczak and Zukotynski (1964); Parker et al. (2015) The volumetric density of states is .
The conductivity for a doped SPB under the same conditions is given by , where is an effective inverse scattering rate. For an anisotropic parabolic band is replaced by an inverse effective mass tensor and the conductivity tensor takes the anisotropy of this tensor. Thus , which is in the numerator of varies as . generally decreases with both and . Thus this formula does not mean that high effective mass by itself is sufficient to get high .
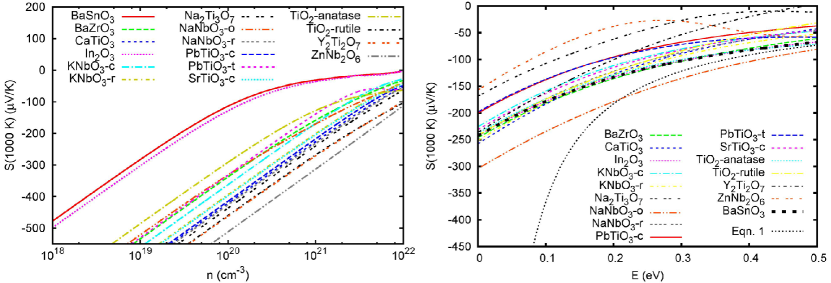
These formulas imply that if one considers different semiconducting compounds one should expect a wide range of doping dependent thermopowers. This is seen in the left panel of Fig. 1, which shows the doping dependent (1000 K) for the compounds investigated here. On the other hand, the various compounds appear more similar at fixed energy. This is seen in the right panel of the figure, which shows the (1000 K) as a function of Fermi energy, relative to the conduction band minimum, and also in Table 1. The thermopower at fixed Fermi level and temperature is relatively constant between the different phases, and in particular there is no correlation with the density of states, . The outlier compounds in right panel of Fig. 1 are Na2Ti3O7 and ZnNb2O6, for low and orthorhombic NaNbO3 for high . Orthorhombic NaNbO3 is the polar phase that exists at room temperature but becomes cubic, similar to KNbO3 at high temperature. Wood (1951); Johnston et al. (2010) The electronic structures of cubic NaNbO3 and cubic KNbO3 are very similar.
| S | ||||||
|---|---|---|---|---|---|---|
| BaSnO3 | 2.8 | 0.0039 | -179 | 3.7 | 3.8 | 1 |
| BaZrO3 | 4.3 | 0.076 | -182 | 28.4 | 71.6 | 1 |
| In2O3 | 3.2 | 0.0047 | -178 | 4.0 | 4.8 | 1 |
| KNbO3-c | 2.4 | 0.147 | -159 | 51.4 | 113 | 1 |
| KNbO3-r | 2.8 | 0.121 | -181 | 38.8 | 128 | 1.09 |
| NaNbO3-o | 2.4 | 0.013 | -235 | 12.0 | 37.8 | 1.61 |
| NaNbO3-r | 3.4 | 0.160 | -174 | 40.3 | 203 | 1.34 |
| ZnNb2O6 | 4.1 | 2.23 | -85 | 10.4 | 1344 | 3.67 |
| CaTiO3 | 3.2 | 0.146 | -183 | 34.6 | 170 | 1.11 |
| Na2Ti3O7 | 4.0 | 0.304 | -108 | 11.2 | 532 | 979 |
| PbTiO3-c | 2.0 | 0.262 | -138 | 62.4 | 261 | 1 |
| PbTiO3-t | 2.1 | 0.102 | -137 | 20.6 | 102 | 299 |
| SrTiO3-c | 2.7 | 0.158 | -164 | 45.8 | 166 | 1 |
| TiO2 (ana.) | 2.9 | 0.034 | -174 | 11.0 | 46.7 | 10.7 |
| TiO2 (rut.) | 2.5 | 0.191 | -175 | 56.7 | 344 | 1.01 |
| Y2Ti2O7 | 3.6 | 0.102 | -161 | 19.2 | 419 | 1 |
The effective mass plays different roles in and , as is evident from the different effects of anisotropy in on these two quantities. Also, as mentioned, most good thermoelectrics have band structures that differ markedly from the single isotropic parabolic band. A computational screen for potential thermoelectrics may then begin by looking for band structures that deviate from the isotropic SPB in ways that favor thermoelectric performance. To understand what kinds of band structures these are, we write the Boltzmann transport formulas for the conductivity and thermopower starting with the transport function,
| (2) |
where summation over bands is implied, is the band energy and is the band velocity. Then the conductivity and Seebeck tensors are
| (3) |
and
| (4) |
where is its energy derivative of the Fermi function at temperature .
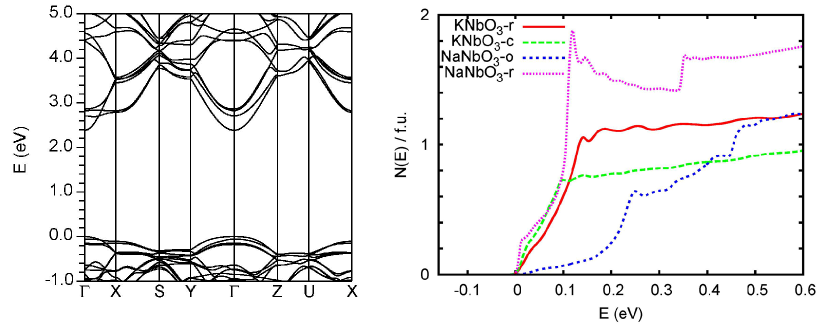
Thus and involve different integrals over the electronic structure. There are two important aspects that we use here: (1) At low temperature, Eqns. 3 and 4 have different integrals over the Fermi surface, i.e. the energy isosurface for . The integrals are such that regions of high are highly weighted in . For a closed isosurface these are the parts where the span across the surface is small. From this point of view, low dimensional and complex shapes are much superior to simple shapes, such as the spherical isosurface of the isotropic SPB. For example, a cylindrical isosurface is much more favorable than a sphere enclosing the same volume (number of carriers) for conduction across the cylinder. As discussed for PbTe and related thermoelectrics, Parker et al. (2013); Chen et al. (2013) isosurfaces with cylindrical sections in different directions can yield isotropic properties that are far superior to those that would be obtained in an SPB with the same carrier concentration. More generally, complex, corrugated isosurface shapes lead to better thermoelectric performance than the spheres that occur with an SPB. Kuroki and Arita (2007); Chen et al. (2013); Usui et al. (2013); Parker et al. (2013); Mecholsky et al. (2014); Pei et al. (2011); Ohkubo and Mori (2015); Shi et al. (2015) (2) At finite , the factor makes sensitive to the electronic structure over a wider energy range than . As a result, features in the electronic structure such as the onset of a heavy band near can enhance while affecting to a lesser extent. Examples of thermoelectrics with a light band extremum followed by onset of heavy band(s) include p-type filled skutterudites Singh and Mazin (1997) and n-type lanthanum telluride. May et al. (2009) Polar orthorhombic NaNbO3 is an example of such a case, and this is the reason why it is the outlier with high in Fig. 1. Its band structure and density of states (DOS) in comparison with some other niobates is shown in Fig. 2. The structure of the DOS is similar to p-type PbTe, Singh (2010c) in contrast to the sharp onsets characteristic of the low dimensional electronic features of the cubic and rhombohedral perovskite niobates (see below). Unfortunately, as mentioned, NaNbO3 is not in the orthorhombic polar phase at high temperature, and the particular characteristic of a heavy band onset above a light mass CBM is a result of the polar distortion. As such, while it is an interesting illustration of this effect, we do not discuss this compound further.
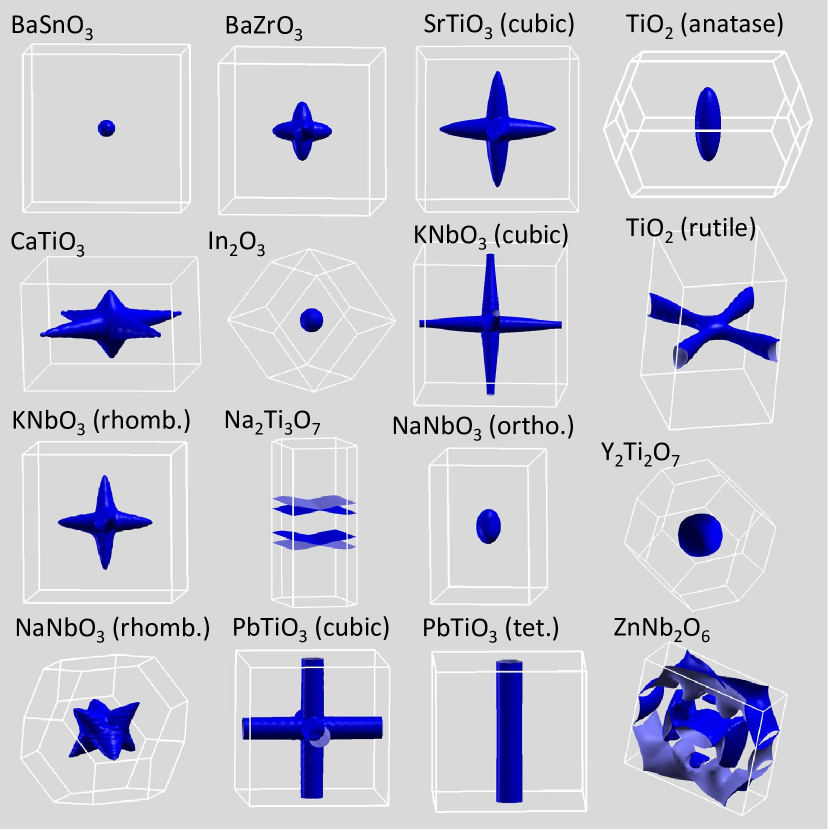
Most high thermoelectrics have 200 – 300 V/K at the temperatures where they are used. This is readily understood if one applies the Wiedemann-Franz relation to the electronic part of the the thermal conductivity to obtain , where and is the Lorentz number. The standard value of yields =1 for =1 and =157 V/K, or for a typical 0.5 with 220 V/K. Considering the results shown in Fig. 1, this suggests a rough estimate of 0.1 eV for 1000 K. Isosurfaces 0.1 eV above the conduction band minimum (CBM) are shown in Fig. 3. Examination of these isosurfaces provides a very simple and fast screen since they are based on the band structure alone. For example, ZnNb2O6 shows a large complex isosurface. This is characteristic of a metal, and this is why at fixed is low. Moreover, having a large complex Fermi surface at =0.1 eV means that the conduction bands are extremely flat in this compound, as is also evident from the high . Na2Ti3O7 shows a near one dimensional metallic structure, while the cylinder for tetragonal PbTiO3 is a two dimensional electronic feature. These materials will therefore be highly anisotropic, which is not favorable for making a ceramic thermoelectric. Anatase TiO2 has an elongated ellipsoidal shape, which again leads to large conductivity anisotropy. The transparent conductors, In2O3 and BaSnO3 have small simple isosurfaces, which according to the arguments above are unfavorable, and this is also the case for pyrochlore Y2Ti2O7.
The remaining materials have complex isosurfaces anticipated to be favorable for thermoelectric performance. The cubic perovskites and some distorted perovskites, i.e. rhombohedral KNbO3 and NaNbO3 and CaTiO3, have these complex shapes because of the degeneracy of the orbitals in an octahedral crystal field, as was discussed previously for SrTiO3 and KTaO3. Usui et al. (2010); Shirai and Yamanaka (2013); Fan et al. (2014) Of the compounds investigated here, cubic KNbO3, which is the high temperature phase, shows the most perfect low dimensional character in its band structure. This is seen in isosurfaces consisting of intersecting nearly perfect cylinders for the lowest conduction band (note that the isosurfaces are a large section consisting of three cylinders joined at the center around and two small sections inside formed by the crossings of the three cylinders; in general cubic perovskites have a large jack shaped section, as seen in SrTiO3 with two small section inside the center of the jack). Interestingly, rutile TiO2 also shows a low dimensional character, favorable for thermoelectric performance, with isosurfaces consisting of two intersecting cylinders (note that two intersecting two dimensional, cylindrical sheets, mean that the conductivity will be three dimensional, and in TiO2 the calculated conductivity anisotropy is weak, as shown in Table 1).
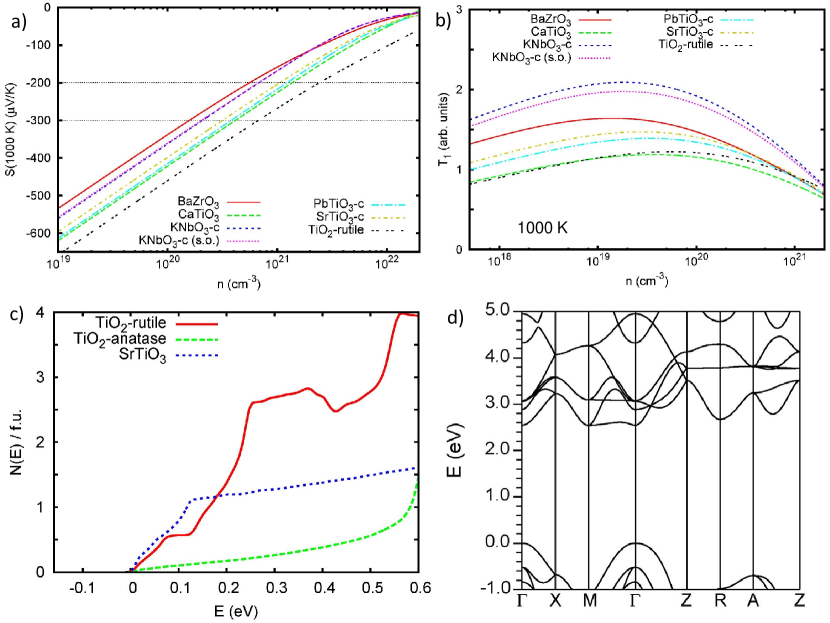
The top panels of Fig. 4 show transport properties for the compounds identified based on the above screen. Additionally, in the case of KNbO3, which contains the 4 element Nb, we show results of calculations including spin-orbit. As seen, these are very similar to the scalar relativistic results. The doping range of interest for developing these materials as thermoelectrics at 1000 K ranges from 1020 cm-3 for BaZrO3 and cubic KNbO3 to 2x10²¹ for TiO2. This will shift to lower values for optimization at lower , but as mentioned for these wide gap materials the best performance is likely to be close to the highest temperature at which the material can be used. The transport function plotted in the top right panel is , where is the volumetric density of states. The rational for using this particular function is that it is readily computed from the band structure, that the 2/3 power of the DOS cancels the mass dependence in the numerator for a SPB, and that while scattering depends strongly on the details of a material, the 2/3 power law dependence of the scattering rate on is a reasonable choice for a degenerate doped semiconductor at high temperature. This is clearly a crude measure of the potential electronic behavior of a thermoelectric, since it makes no attempt to incorporate detailed material specific scattering mechanisms. However, it does suggest that KNbO3 may be the best of the materials studied if it can be doped. Also, interestingly, the non-perovskite, rutile TiO2 is within a factor of two of this “best” material. Anatase on the other hand is not favorable. The bottom left panel shows the DOS for rutile and anatase as compared with SrTiO3. As seen, SrTiO3 and rutile have a similar sharp 2D-like onset at the CBM, while anatase has a lower, more 3D shape (for a 2D band, has a step function shape, while for a 3D parabolic band ). Bayerl and Kioupakis have reported theoretical investigation by a somewhat different approach of different TiO2 polymorphs as potential n-type thermoelectrics and also find that rutile is exceptional. Bayerl and Kioupakis (2015) The band structure of TiO2 (bottom, right) has a double degenerate bottom conduction band at , with a very flat CBM along the - directions. This underlies the favorable behavior.
From an experimental point of view, SrTiO3 is known to be dopable using Nb, and has been reported at 1000 K with 20% Nb, Ohta et al. (2005); Wang et al. (2013) This corresponds to a very high carrier concentration, 3x10²¹, assuming one electron per Nb. The bands at the CBM are Ti bands, specifically from the level, which suggests exploration of alternate doping strategies involving the O or Sr sites. SrTiO3, like other perovskites near ferroelectricity, has a low thermal conductivity, which is favorable for a thermoelectric. Ohta et al. (2005); Wang et al. (2013); Tachibana et al. (2008) The thermal conductivity of NaNbO3 is particularly low at 1 W/mK at 300 K, while KNbO3 has 10 W/mK at this temperature. Tachibana et al. (2008) Meanwhile the thermal conductivity of single crystal TiO2 at 300 K is 8 W/mK and falls with temperature to below 5 W/mK at 1000 K. Thurber and Mante (1965) Furthermore it is known that TiO2 can be doped n-type by Nb similar to SrTiO3. Thurber and Mante (1965)
BaZrO3 is an insulating material, with a higher band gap than SrTiO3 and it is not known whether it can be effectively doped. Cubic PbTiO3 has a ferroelectric transition to the tetragonal form at 800 K, accompanied by a large 6% lattice strain, which makes it unlikely that practical thermoelectric modules could be made based on this material. Furthermore, heavy n-type doping of PbTiO3 may be particularly challenging because of the presence of Pb2+, which might lead to low energy compensating defects associated with availability of the Pb4+ valence state.
The results suggest that in addition to SrTiO3, KNbO3, and perhaps its alloys such as (K,Na)NbO3 may be particularly good candidate materials. We also find that rutile TiO2 is a good candidate and is remarkable in that it is a binary, non-perovskite based compound.
The key challenge in developing any of these oxides into high performance thermoelectrics will be doping. As mentioned, in SrTiO3 and TiO2 doping can be done by Nb alloying on the Ti site. However, the CBM’s have Ti character, which means that other doping strategies should be explored. Both YTiO3 and LaTiO3 form in perovskite structure and so exploration of the solid solutions with SrTiO3 would be one avenue. Another would be doping on the O site, perhaps with F.
In the case of TiO2, the possibilities other than Nb doping are more limited, but again it may be possible to use the O site. This is consistent with transport measurements on titania doped by oxygen deficiency. Backhaus-Ricoult et al. (2014) TiOF can be formed in a tetragonal rutile structure, Chamberland and Sleight (1967) suggesting that there could be a high solubility of F in rutile TiO2. One issue with TiO2 is the tendency of the binary oxide to oxygen deficiency when processed at high temperature under reducing conditions. This O deficiency, if large, can lead to ordered phases, TinO2n-1, known as Magneli phases. Andersson and Magneli (1956); Andersson et al. (1957); Walsh and Wills (2010) These conducting phases are generally made by reduction of TiO2 at temperatures above 1300 K. Walsh and Wills (2010) While these phases have several desirable properties for thermoelectrics, so far the thermopowers obtained are too low to obtain high . Harada et al. (2010); Portehault et al. (2011); Backhaus-Ricoult et al. (2012, 2014) It would be important to avoid the formation of Magneli phases in assessing doped rutile TiO2 as a thermoelectric. F doping and avoidance of high temperature anneals in reducing environments may be useful for this. Doping of KNbO3, or (K,Na)NbO3 is also expected to be a challenge, although the required doping level is lower than for the other compounds studied. Some possibilities could be divalent substitutions on the K site, such as Ba or again F on the O site. In this regard, it is known that BaNbO3 forms in a perovskite structure and is metallic. Casais et al. (1995)
In summary, we present simple screens that can be readily applied in searching for new oxide thermoelectrics and demonstrate them by application to a set of oxides. This includes a simple screen based on energy isosurface structure. This provides a visual search strategy. We find that KNbO3 and rutile TiO2 are interesting compounds to investigate further as potential thermoelectrics in addition to the known thermoelectric compound SrTiO3.
Work at the University of Missouri (JS, DJS) is supported by the U.S. Department of Energy, Basic Energy Sciences through the S3TEC Energy Frontier Research Center, award DE-SC0001299/DE-FG02-09ER46577. KPO is grateful for support from the Institute of High Performance Computing (IHPC) A*STAR.
References
- Wood (1988) C. Wood, Rep. Prog. Phys. 51, 459 (1988).
- Riffat and Ma (2003) S. B. Riffat and X. L. Ma, Appl. Thermal Eng. 23, 913 (2003).
- Yang and Caillat (2006) J. Yang and T. Caillat, MRS Bull. 31, 224 (2006).
- DiSalvo (1999) F. J. DiSalvo, Science 285, 703 (1999).
- Kraemer et al. (2011) D. Kraemer, B. Poudel, H. Feng, C. Caylor, B. Yu, X. Yan, Y. Ma, X. Wang, D. Wang, A. Muto, M. McEnaney, M. Chiesa, Z. Ren, and G. Chen, Nature Materials 10, 532 (2011).
- Kumar et al. (2013) K. Kumar, S. D. Heister, X. Xu, J. R. Salvador, and G. P. Meisner, J. Electron. Mater. 42, 665 (2013).
- Hicks and Dresselhaus (1993) L. D. Hicks and M. S. Dresselhaus, Phys. Rev. B 47, 12727 (1993).
- Kuroki and Arita (2007) K. Kuroki and R. Arita, J. Phys. Soc. Jpn. 76, 083707 (2007).
- Chen et al. (2013) X. Chen, D. Parker, and D. J. Singh, Sci. Rep. 3, 3168 (2013).
- Usui et al. (2013) H. Usui, K. Suzuki, K. Kuroki, S. Nakano, K. Kudo, and M. Nohara, Phys. Rev. B 88, 075140 (2013).
- Usui et al. (2010) H. Usui, S. Shibata, and K. Kuroki, Phys. Rev. B 81, 205121 (2010).
- Shirai and Yamanaka (2013) K. Shirai and K. Yamanaka, J. Appl. Phys. 113, 053705 (2013).
- Parker et al. (2013) D. Parker, X. Chen, and D. J. Singh, Phys. Rev. Lett. 110, 146601 (2013).
- Mecholsky et al. (2014) N. A. Mecholsky, L. Resca, I. L. Pegg, and M. Fornari, Phys. Rev. B 89, 155131 (2014).
- Pei et al. (2011) Y. Pei, X. Shi, A. LaLonde, H. Wang, L. Chen, and G. J. Snyder, Nature (London) 473, 66 (2011).
- Bjerg et al. (2011) L. Bjerg, G. K. H. Madsen, and B. B. Iversen, Chem. Mater. 23, 3907 (2011).
- Ohkubo and Mori (2015) I. Ohkubo and T. Mori, Chem. Mater. 27, 7265 (2015).
- Shi et al. (2015) H. Shi, D. Parker, M. H. Du, and D. J. Singh, Phys. Rev. Appl. 3, 014004 (2015).
- Madsen (2006) G. K. H. Madsen, J. Am. Chem. Soc. 128, 12140 (2006).
- Curtarolo et al. (2013) S. Curtarolo, G. L. W. Hart, M. B. Nardelli, N. Mingo, S. Sanvito, and O. Levy, Nature Materials 12, 191 (2013).
- Wang et al. (2011) S. D. Wang, Z. Wang, W. Setyawan, N. Mingo, and S. Curtarolo, Phys. Rev. X 1, 021012 (2011).
- Bhattacharaya and Madsen (2015) S. Bhattacharaya and G. K. H. Madsen, Phys. Rev. B 92, 085205 (2015).
- Fergus (2012) J. W. Fergus, J. Eur. Ceram. Soc. 32, 525 (2012).
- Koumoto et al. (2010) K. Koumoto, Y. Wang, R. Zhang, A. Kosuga, and R. Funahashi, Ann. Rev. Mater. Res. 40, 363 (2010).
- Terasaki et al. (1997) I. Terasaki, Y. Sasago, and K. Uchinokura, Phys. Rev. B 56, R12685 (1997).
- Hebert et al. (2001) S. Hebert, S. Lambert, D. Pelloquin, and A. Maignan, Phys. Rev. B 64, 172101 (2001).
- Miyazaki et al. (2002) Y. Miyazaki, M. Onoda, T. Oku, K. Kikuchi, Y. Ishii, Y. Ono, Y. Morii, and T. Kajitana, J. Phys. Soc. Jpn. 71, 491 (2002).
- Koumoto et al. (2006) K. Koumoto, I. Terasaki, and R. Funahashi, MRS Bull. 31, 206 (2006).
- Ohtaki et al. (2009) M. Ohtaki, K. Araki, and K. Yamamoto, J. Electr. Mater. 38, 1234 (2009).
- Jood et al. (2014) P. Jood, R. J. Mehta, Y. Zhang, T. Borca-Tasciuc, S. X. Dou, D. J. Singh, and G. Ramanath, RSC Adv. 4, 6363 (2014).
- Ong et al. (2011) K. P. Ong, D. J. Singh, and P. Wu, Phys. Rev. B 83, 115110 (2011).
- Singh and Nordstrom (2006) D. J. Singh and L. Nordstrom, Planewaves Pseudopotentials and the LAPW Method, 2nd Edition (Springer,Berlin, 2006).
- Blaha et al. (2001) P. Blaha, K. Schwarz, G. Madsen, D. Kvasnicka, and J. Luitz, WIEN2k, An Augmented Plane Wave + Local Orbitals Program for Calculating Crystal Properties (K. Schwarz, Tech. Univ. Wien, Austria) (2001).
- Perdew et al. (1996) J. P. Perdew, K. Burke, and M. Ernzerhof, Phys. Rev. Lett. 77, 3865 (1996).
- Tran and Blaha (2009) F. Tran and P. Blaha, Phys. Rev. Lett. 102, 226401 (2009).
- Koller et al. (2011) D. Koller, F. Tran, and P. Blaha, Phys. Rev. B 83, 195134 (2011).
- Singh (2010a) D. J. Singh, Phys. Rev. B 82, 155145 (2010a).
- Kim et al. (2010) Y. S. Kim, M. Marsman, G. Kresse, F. Tran, and P. Blaha, Phys. Rev. B 82, 205212 (2010).
- Singh (2010b) D. J. Singh, Phys. Rev. B 82, 205102 (2010b).
- Madsen and Singh (2006) G. K. H. Madsen and D. J. Singh, Comput. Phys. Commun. 175, 67 (2006).
- Kolodziejczak and Zukotynski (1964) J. Kolodziejczak and S. Zukotynski, Phys. Status Solidi (b) 5, 145 (1964).
- Parker et al. (2015) D. S. Parker, A. F. May, and D. J. Singh, Phys. Rev. Appl. 3, 064003 (2015).
- Wood (1951) E. A. Wood, Acta Cryst. 4, 353 (1951).
- Johnston et al. (2010) K. E. Johnston, C. C. Tang, J. E. Parker, K. S. Knight, P. Lightfoot, and S. E. Ashbrook, J. Am. Chem. Soc. 132, 8732 (2010).
- Singh and Mazin (1997) D. J. Singh and I. I. Mazin, Phys. Rev. B 56, R1650 (1997).
- May et al. (2009) A. F. May, D. J. Singh, and G. J. Snyder, Phys. Rev. B 79, 153101 (2009).
- Singh (2010c) D. J. Singh, Phys. Rev. B 81, 195217 (2010c).
- Fan et al. (2014) X. Fan, W. Zheng, X. Chen, and D. J. Singh, Plos One 9, e91423 (2014).
- Bayerl and Kioupakis (2015) D. Bayerl and E. Kioupakis, Phys. Rev. B 91, 165104 (2015).
- Ohta et al. (2005) S. Ohta, T. Nomura, H. Ohta, M. Hirano, H. Hosono, and K. Koumoto, Appl. Phys. Lett. 87, 092108 (2005).
- Wang et al. (2013) N. Wang, H. Chen, H. He, W. Norimatsu, M. Kusonoki, and K. Koumoto, Sci. Rep. 3, 3449 (2013).
- Tachibana et al. (2008) M. Tachibana, T. Kolodiazhnyi, and E. Takayama-Moromachi, Appl. Phys. Lett. 93, 092902 (2008).
- Thurber and Mante (1965) W. R. Thurber and A. J. H. Mante, Phys. Rev. 139, A1655 (1965).
- Backhaus-Ricoult et al. (2014) M. Backhaus-Ricoult, J. R. Rustad, L. Moore, C. Smith, and J. Brown, Appl. Phys. A 116, 433 (2014).
- Chamberland and Sleight (1967) B. L. Chamberland and A. W. Sleight, Solid State Commun. 5, 765 (1967).
- Andersson and Magneli (1956) S. Andersson and A. Magneli, Die Naturwissenschaften 43, 495 (1956).
- Andersson et al. (1957) S. Andersson, B. Collen, U. Kuylenstierna, and A. Magneli, Acta Chem. Scand. 11, 1641 (1957).
- Walsh and Wills (2010) F. C. Walsh and R. G. A. Wills, Electrochimica Acta 55, 6342 (2010).
- Harada et al. (2010) S. Harada, K. Tanaka, and H. Inui, J. Appl. Phys. 108, 083703 (2010).
- Portehault et al. (2011) D. Portehault, V. Maneeratana, C. Candolfi, N. Oeschler, I. Veremchuk, Y. Grin, C. Sanchez, and M. Antonietti, ACS Nano 5, 9052 (2011).
- Backhaus-Ricoult et al. (2012) M. Backhaus-Ricoult, J. R. Rustad, D. Vargheese, I. Dutta, and K. Work, J. Electronic Materials 41, 1636 (2012).
- Casais et al. (1995) M. T. Casais, J. A. Alonso, I. Rasines, and M. A. Hidalgo, MRS Bull. 30, 201 (1995).
Figure Captions