Evolution of dispersion in the cosmic deuterium abundance
Abstract
Deuterium is created during Big Bang Nucleosynthesis, and, in contrast to the other light stable nuclei, can only be destroyed thereafter by fusion in stellar interiors. In this paper we study the cosmic evolution of the deuterium abundance in the interstellar medium and its dispersion using realistic galaxy evolution models. We find that models that reproduce the observed metal abundance are compatible with observations of the deuterium abundance in the local ISM and absorption line systems. In particular, we reproduce the low astration factor which we attribute to a low global star formation efficiency. We calculate the dispersion in deuterium abundance arising from different structure formation histories in different parts of the Universe. Our model also predicts a tight correlation between deuterium and metal abundances which could be used to measure the primordial deuterium abundance.
1 Introduction
Deuterium is created during Big Bang Nucleosynthesis (BBN) and can only be destroyed thereafter as its fusion temperature is of the order of K (Epstein, Lattimer & Schramm, 1976). Therefore, any detection of deuterium sets a lower limit on its primordial value and can be used to constrain the baryon-to-photon ratio .
The conversion from , provided by CMB measurements, to is not straightforward in view of the uncertainties in the nuclear cross sections. Although minute, these errors are becoming increasingly important as the quality of data increases. In this paper we consider two recent calculations: Coc et al. (2015), which results in for and Cyburt et al. (2015) with for . We stress that both results are compatible, within the quoted errors, with each other and with the abundance measured by Cooke et al. (2014), as well as with the value of deduced by Marcucci et al. (2015).
Deuterium is detected in several metal-poor damped Ly absorbers (DLAs) where is expected to be close to its primordial value. Early reported values of (Burles & Tytler, 1998a, b; O’Meara et al., 2001; Pettini & Bowen, 2001; Levshakov et al., 2002; Kirkman et al., 2003; O’Meara et al., 2006; Pettini et al., 2008; Srianand et al., 2010; Fumagalli, O’Meara & Prochaska, 2011) showed a high degree of dispersion which was significantly larger than the quoted errors. This dispersion may have been intrinsic (Fields et al., 2001) or most probably systematic. Following the observation of Pettini & Cooke (2012), Cooke et al. (2014) proposed to circumvent this difficulty by defining a Precision Sample of deuterium abundance measurements, which adhere to a strict set of selection criteria, thus ensuring its robustness. This sample, which consists of points at , provides a mean weighted value of the primordial abundance of . Subsequently two new obervations (Riemer-Sørensen et al., 2015; Balashev et al., 2015) were added to the literature albeit with significantly larger uncertainties.
Another set of observational constraints comes from local measurements, including Jupiter, interstellar matter (ISM) in the solar neighbourhood, the galactic disk and the warm neutral medium in the galactic halo (see Savage et al., 2007, for a compilation of results). Since deuterium is destroyed as gas is cycled through stars, the astration factor is a measure of the star formation and inflow history in the Galaxy. Unfortunately, local observations also suffer from large dispersion, partly due to the variance in dust depletion along different lines of sight (Linsky et al., 2006). Overall the results imply an astration factor in the range , reflecting relatively low star formation efficiency.
The chemical evolution of D/H has been extensively studied (see e.g. Audouze & Tinsley, 1974; Vangioni-Flam & Audouze, 1988; Steigman & Tosi, 1992; Vangioni-Flam et al., 1994; Scully et al., 1997; Romano et al., 2006; Steigman et al., 2007; Olive et al., 2012). In this paper we study the evolution of deuterium abundance in a full cosmological context and test to what extent the abundance observed at different redshifts can be thought of representing the primordial value. Using realistic galaxy evolution models we study the connection between deuterium and metal abundances, which provide complementary views on the star formation process. We show that models that succesfully explain the observed total mean metallicity abundance at high redshift are consistent with measurements in DLAs and the local ISM and predict a significant dispersion in which evolves with redshift. Finally, we predict a tight correlation between the deuterium and metal content in the ISM, which can be exploited for extending the range of systems used to measure .
2 Galaxy evolution model
We use an improved version of the galaxy evolution model developed in Dvorkin et al. (2015). We take (Mpc/h)3 as the total comoving volume in our calculation and divide it into smaller regions (Mpc/h)3. The volume is populated with dark matter (DM) halos according to the Sheth-Tormen mass function (MF) at accounting for large-scale clustering effects: regions with large-scale overdensities form halos more easily. We use the results of Barkana & Loeb (2004), for the MF bias caused by clustering (see their eqs. (6,7)). This correction provides a good fit to numerical simulations at least up to . For each region, we draw an overdensity from a Gaussian distribution with zero mean and variance Mpc, where is the variance of the overdensity field smoothed on a scale and employ the formulas from Barkana & Loeb (2004) to obtain the halo MF in the region. The actual mass distribution in each region is obtained by drawing halos from this biased MF. This procedure is equivalent to smoothing the real halo distribution on a scale of Mpc, roughly corresponding to the galaxy correlation length.
We build a merger tree for each halo using the algorithm in the GALFORM model (Parkinson, Cole & Helly, 2008) and follow its evolution backwards in time up to , saving the output in equally spaced redshift bins. We use as the minimal halo mass able to form stars. In this manner, we obtain the distribution of DM halos in the comoving volume as a function of redshift.
We then calculate the mean mass fraction in collapsed structures and the mean escape velocity, , in each region . These quantities serve as inputs for the chemical evolution code developed in Daigne et al. (2004, 2006) and Rollinde et al. (2009), which follows the exchange of mass between the gas within and outside of collapsed structures, the star formation rate (SFR) at each redshift and the rate of metal production in stars. The evolution of gas mass in collapsed structures is given by:
| (1) |
where is the SFR, is the rate of gas accretion, is the rate at which processed gas is returned to the ISM following stellar deaths and is the outflow rate. In our model is calculated from for every region, and the other terms in eq. (1) depend explicitly on the SFR.
The mass of stars formed in a given galaxy clearly depends on the amount of available baryonic fuel, which is determined by inflow and outflow processes. Therefore we use a phenomenological model where the SFR depends on the mass of the ISM at each time-step of the calculation:
| (2) |
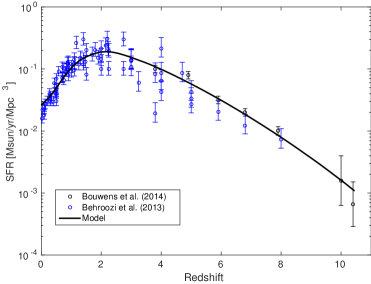
where M⊙ yr-1 Mpc-3, , and . In this model star formation is quenched as soon as the galaxy acquires a critical mass of . The mean cosmic SFR is shown in Figure 1 (black solid line) and compared with observations compiled by Behroozi, Wechsler & Conroy (2013) and the data from Bouwens et al. (2014).
The calculation of outflow rate is performed as in Daigne et al. (2006) and is given by:
| (3) |
where is the lifetime of a star with mass , is the stellar initial mass function (IMF), is the kinetic energy released when this star dies, and is the fraction of kinetic energy that powers the outflow. This value of was chosen by comparing the IGM metallicities predicted by the model and the observed oxygen and carbon abundances in the Ly-alpha forest (see discussion in Daigne et al., 2006). We assume a Salpeter IMF with slope for . Even though this choice differs from more recent IMFs (e.g Kroupa, 2001), notably in the low-mass end, we do not expect this to be important for deuterium abundance evolution. The effect of different IMFs on the mean deuterium abundance was discussed in Coc et al. (2015) and it was found that taking as the lower mass limit reduces the deuterium abundance at by less than , and the effect is even smaller at higher redshifts. Similarly, modifying the IMF slope to (Chabrier, Hennebelle & Charlot, 2014) amounts to change in deuterium abundance.
The rate at which processed gas is returned to the ISM is given by:
| (4) |
where is the remnant mass of a star of mass .
The evolution of the abundance of a specific element in the ISM and the intergalactic medium (IGM) is given by eqs. (6) and (7) in Daigne et al. (2004). For the sake of completeness we reproduce the equation for the ISM:
| (5) |
where is the rate at which element is ejected into the ISM and is given by:
| (6) |
and is computed from stellar yields.
3 Deuterium abundance
The evolution of deuterium abundance in the ISM is determined by the star formation history, the rate of stellar deaths, which return processed gas into the ISM and the inflow of primordial gas into the galaxy. We therefore expect different regions in the Universe to have different mean levels of deuterium abundance, according to their structure formation history. The mean evolution of deuterium abundance in our model assuming the primordial values of (Coc et al., 2015) and (Cyburt et al., 2015) is shown by the black lines on Figure 2 (upper and lower panels, respectively). The grey lines show the evolution in individual regions in our model, as discussed below. The abundances measured in DLAs at from Cooke et al. (2014) and Riemer-Sørensen et al. (2015) are shown in red and the measurement by Balashev et al. (2015) is shown as magenta. In addition, we show the deuterium abundance measured in the local ISM (Linsky et al., 2006; Prodanović, Steigman & Fields, 2010) (blue) (note that local measurements might have additional uncertainties due to dust depletion effects, see e.g. Hébrard & Moos (2003).
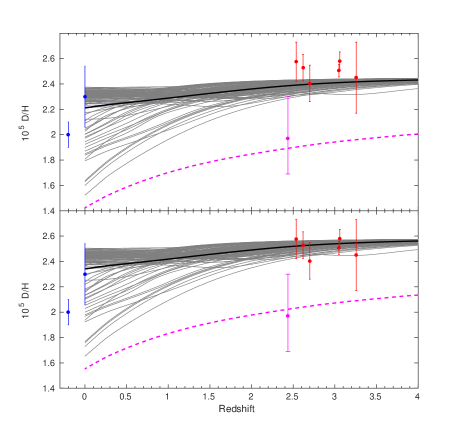
Comparing the two theoretically deduced values for taken from the recent studies of (Coc et al., 2015) and (Cyburt et al., 2015), we see that, as expected, there is no qualitative change in the results, except for a shift of the whole distribution.
We now turn to a more detailed analysis of the dispersion in the deuterium abundance by inspecting the individual regions shown by thin grey lines on Figure 2. Note that there are regions where the deuterium abundance reaches a minimum, then begins to rise. This effect occurs in regions where star formation was quenched early on so that deuterium is no longer destroyed. However if subsequent accretion of primordial material is significant, the deuterium abundance in the depleted ISM will increase.
Comparing with the available measurements in DLAs and in the local ISM, we see that our model is consistent with the data of Cooke et al. (2014) and Riemer-Sørensen et al. (2015), as well as with the local measurements. A few regions in our model also agree, within the quoted uncertainty, with the low deuterium abundance found by Balashev et al. (2015) for a absorption system. However, it is also possible that the true abundance of J is much lower than any of our models predict. In the most extreme star-forming region in our model, deuterium is depleted to of its initial value at , but at its abundance is still slightly above . This result is related to the relative inefficiency of star formation, as most material never went through a star formation phase. Standard theories of galaxy formation will therefore have difficulties explaining the extremely low deuterium abundance of J, in particular in view of its low metal abundance of . An interesting scenario is an early star formation episode that could have led to local depletion of deuterium. The dashed magenta curve on Figure 2 shows one such model with an addition of PopIII stars for which the SFR is , where is the metallicity of the IGM, Gyr-1 and we assumed a rather high critical metallicity of . This model results in early depletion of deuterium in the concerned region and is able to explain the low deuterium abundance reported by Balashev et al. (2015). However this model also predicts a relatively high metal abundance of . A possible solution would be to include strong outflows by supernovae ejecta that preferentially remove metals (through the chimney effect (McCray & Snow, 1979)) while preserving the low abundance of deuterium. Note, however, that column density in the analysis of Balashev et al. (2015) could be overestimated, yielding higher values of both and metallicity and bringing this point into the range predicted by our models.
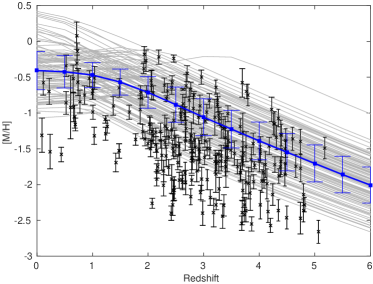
We also note that the dispersion in deuterium abundance is significantly smaller than the expected metallicity dispersion, shown in Figure 3, which spans several orders of magnitude. This is expected since both effects are the result of differences in the amount of matter that was cycled through stars, however in the case of metals the dispersion was effectively amplified by the stellar yields. We note that our model fails to account for the most metal-poor systems and thus underestimates the total dispersion. A complete treatment of this problem, including the effects of the structure of the galactic halo is beyond the scope of the present paper and we leave it to future work.
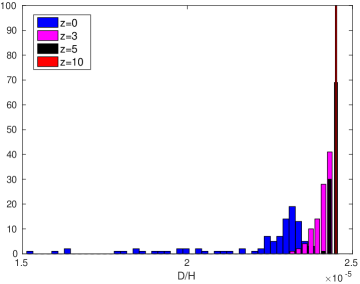
To better understand the dispersion of deuterium abundance, in Figure 4, we construct histograms of at different redshifts, assuming a primordial abundance of . At the deuterium abundance is at the primordial level everywhere, but it begins to slightly decline by . At the distribution is quite wide, so that more precise measurements of DLA absorption might detect a significant deviation from the primordial value and reveal the star formation history of these systems. Interestingly, at the distribution consists of a Gaussian-like feature around and a long low-abundance tail, which corresponds to regions where star formation continues at low redshifts. The evolution of dispersion with redshift reflects the star formation history in our model and thus in principle can constrain galaxy evolution models. Although current observational data does not provide sufficient statistics, we expect future surveys of absorption line systems to provide interesting constraints on star formation histories of high-redshift galaxies.
Deuterium and metal abundances are complementary tracers of the star formation history of a given region: star formation depletes deuterium while increasing the fraction of metals. We can thus expect these two quantities to be tightly correlated. This is in fact what happens in our model, as can be seen in Figure 5 (black circles). As noted above, our model does not reproduce the most metal-poor systems, probably because it does not resolve individual halos and their internal structure. However our results clearly demonstrate the small amount of astration even in systems with as well as the correlation between metallicity and . This suggests that DLAs with intermediate metallicity values might be interesting in the context of measuring the primordial deuterium abundance.
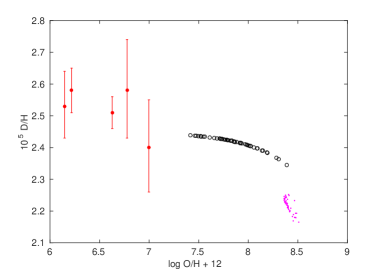
The correlation between and metallicity can be understood by considering our model of chemical evolution for deuterium and an arbitrary element . From eq. (5) and assuming negligible metal abundance in the IGM, negligible astration: and negligible enrichment of the ISM: (which hold when star formation is very inefficient) we obtain the ratio of the time derivative of deuterium abundance in the ISM to the time derivative of the abundance of element :
| (7) |
As long as this ratio is roughly constant in time, and metallicity will be related by the slope where the effective yield is . However if one of the aforementioned assumptions is violated, the correlation is destroyed. For example, the magenta dots in Figure 5 show the case with an early strong star formation episode with Gyr-1 for Gyr.
We stress that this theoretical relationship should be further explored, in particular the extent to which our assumptions are valid in realistic systems and the conclusions that can be drawn from a departure from this relation (i.e. a non-standard star formation history). We plan to explore these issues in the context of a more complete semi-analytic model that resolves individual halos, to be presented in a forthcoming paper.
4 Discussion
In this paper we developed a model that describes the evolution of the deuterium abundance in the context of cosmological structure formation. Employing realistic descriptions of the SFR and galactic outflows we were able to obtain a good fit to the observed deuterium abundance in the Precision Sample of Cooke et al. (2014) at as well as in the local ISM.
In addition, we calculated the disperison expected from different structure formation histories. We find that even in the most extreme cases deuterium abundance is never reduced below of its primordial value. Moreover, we find that the evolution of deuterium can be non-monotonic if matter accretion continues after the quenching of star formation, however, as expected, its abundance in the ISM never exceeds the primordial value.
An interesting outcome of our model is the tight correlation between the deuterium and metal abundances in any given region. This finding suggests that it might be possible to compile large samples from different environments in order to study the primordial deuterium abundance, rather than targeting only metal-poor systems. We note, however, that metal-rich systems are expected to contain large amounts of dust which will introduce additional scatter. According to our model, DLAs which are poor in deuterium are outstanding candidates to be further studied at high sensitivity for possible Population III abundance signatures, since in these systems deuterium was efficiently destroyed in parallel with metal enrichment. More observational and theoretical work is needed to improve our understanding of the relation between deuterium and metal abundances, which can provide important constraints on galaxy formation models.
Acknowledgements
We thank the galform team for making the code publicly available. The work of ID and JS was supported by the ERC Project No. 267117 (DARK) hosted by Université Pierre et Marie Curie (UPMC) - Paris 6, PI J. Silk. JS acknowledges the support of the JHU by NSF grant OIA-1124403. The work of KAO was supported in part by DOE grant DE-SC0011842 at the University of Minnesota. This work has been carried out at the ILP LABEX (under reference ANR-10-LABX-63) supported by French state funds managed by the ANR within the Investissements d’Avenir programme under reference ANR-11-IDEX-0004-02.
References
- Audouze & Tinsley (1974) Audouze, J., & Tinsley, B. M. 1974, ApJ, 192, 487
- Balashev et al. (2015) Balashev S. A., Zavarygin E. O., Ivanchik A. V., Telikova K. N., Varshalovich D. A., 2015, preprint (arXiv:1511.01797)
- Barkana & Loeb (2004) Barkana R., Loeb A., 2004, ApJ, 609, 474
- Behroozi, Wechsler & Conroy (2013) Behroozi P. S., Wechsler R. H., Conroy C., 2013, ApJ, 770, 57
- Bouwens et al. (2014) Bouwens R. J. et al., 2014, ApJ, 795, 126
- Burles & Tytler (1998a) Burles, S., & Tytler, D. 1998a, ApJ 499,699
- Burles & Tytler (1998b) Burles, S., & Tytler, D. 1998b, ApJ 507, 732
- Chabrier, Hennebelle & Charlot (2014) Chabrier, G., Hennebelle, P., Charlot, S., 2014, ApJ, 796, 75
- Coc et al. (2015) Coc A., Petitjean P., Uzan J.-P., Vangioni E., Descouvemont P., Illiadis C., Longland R., 2015, Phys. Rev. D, 92, 12
- Cooke et al. (2014) Cooke R. J., Pettini M., Jorgenson R. A., Murphy M. T., Steidel C. C., 2014, ApJ, 781, 31
- Cyburt et al. (2015) Cyburt R. H., Fields B. D., Olive K. A., Yeh T.-H., 2015, ArXiv e-prints
- Daigne et al. (2006) Daigne F., Olive K. A., Silk J., Stoehr F., Vangioni E., 2006, ApJ, 647, 773
- Daigne et al. (2004) Daigne F., Olive K. A., Vangioni-Flam E., Silk J., Audouze J., 2004, ApJ, 617, 693
- Dvorkin et al. (2015) Dvorkin I., Silk J., Vangioni E., Petitjean P., Olive K. A., 2015, MNRAS, 452, L36
- Epstein, Lattimer & Schramm (1976) Epstein R. I., Lattimer J. M., Schramm D. N., 1976, Nature, 263, 198
- Fields et al. (2001) Fields, B. D., Olive, K. A., Silk, J., Cassé, M., & Vangioni-Flam, E. 2001, ApJ, 563, 653
- Fumagalli, O’Meara & Prochaska (2011) Fumagalli M., O’Meara J. M., Prochaska J. X., 2011, Science, 334, 1245
- Hébrard & Moos (2003) Hébrard, G. & Moos, H. W., 2003, ApJ, 599, 297
- Kirkman et al. (2003) Kirkman, D., Tytler, D., Suzuki, N., O’Meara, J. M., & Lubin, D. 2003, ApJS, 149, 1
- Kroupa (2001) Kroupa, P., 2001, MNRAS, 322, 231
- Levshakov et al. (2002) Levshakov, S. A., DessaugesZavadsky, M., D’Odorico, S., & Molaro, P. 2002, ApJ, 565, 696
- Linsky et al. (2006) Linsky J. L. et al., 2006, ApJ, 647, 1106
- Marcucci et al. (2015) Marcucci L. E., Mangano G., Kievsky A., Viviani M., 2015, preprint (arXiv:1510.07877)
- Olive et al. (2012) Olive, K. A., Petitjean, P., Vangioni, E., & Silk, J. 2012, MNRAS, 426, 1427
- McCray & Snow (1979) McCray, R. & Snow, T.P. 1979, ARAA, 17, 213
- O’Meara et al. (2001) O’Meara, J.M., et al. 2001, ApJ, 522, 718
- O’Meara et al. (2006) O’Meara, J. M., Burles, S., Prochaska, J. X., et al. 2006, ApJ, 649, L61
- Parkinson, Cole & Helly (2008) Parkinson H., Cole S., Helly J., 2008, MNRAS, 383, 557
- Pettini & Bowen (2001) Pettini, M., & Bowen, D. V. 2001, ApJ, 560, 41
- Pettini & Cooke (2012) Pettini M., Cooke R., 2012, MNRAS, 425, 2477
- Pettini et al. (2008) Pettini, M., Zych, B. J., Murphy, M. T., Lewis, A., & Steidel, C. C. 2008, MNRAS, 391, 1499
- Prodanović, Steigman & Fields (2010) Prodanović T., Steigman G., Fields B. D., 2010, MNRAS, 406, 1108
- Rafelski et al. (2012) Rafelski M., Wolfe A. M., Prochaska J. X., Neeleman M., Mendez A. J., 2012, ApJ, 755, 89
- Riemer-Sørensen et al. (2015) Riemer-Sørensen S. et al., 2015, MNRAS, 447, 2925
- Rollinde et al. (2009) Rollinde E., Vangioni E., Maurin D., Olive K. A., Daigne F., Silk J., Vincent F. H., 2009, MNRAS, 398, 1782
- Romano et al. (2006) Romano, D. and Tosi, M. and Chiappini, C. and Matteucci, F., 2006, MNRAS, 369, 295
- Savage et al. (2007) Savage B. D., Lehner N., Fox A., Wakker B., Sembach K., 2007, ApJ, 659, 1222
- Scully et al. (1997) Scully, S., Cassé, M., Olive, K. A., & Vangioni-Flam, E. 1997, ApJ, 476, 521
- Srianand et al. (2010) Srianand, R., Gupta, N., Petitjean, P., Noterdaeme, P. & Ledoux, C. 2010, MNRAS, 405, 1888
- Steigman & Tosi (1992) Steigman, G., & Tosi, M. 1992, ApJ, 401, 150
- Steigman et al. (2007) Steigman, G., Romano, D., & Tosi, M. 2007, MNRAS, 378, 576
- Vangioni-Flam & Audouze (1988) Vangioni, E. & Audouze, J. 1988, AA, 193, 81
- Vangioni-Flam et al. (1994) Vangioni-Flam, E., Olive, K. A., & Prantzos, N. 1994, ApJ, 427, 618