N. Iso et al.Origin of the Broad Iron Line Feature and the Soft X-ray Variation in Seyfert Galaxies \Received \Accepted \KeyWordsX-rays: galaxies — Galaxies: Seyfert — Galaxies: nuclei — Accretion, accretion disks
Origin of the Broad Iron Line Feature and the Soft X-ray Variation in Seyfert Galaxies
Abstract
Many Seyfert galaxies are known to exhibit significant X-ray spectral variations and seemingly broad iron K-emission line features. In this paper, we show that the “variable partial covering model”, which has been successfully proposed for MCG-6-30-15 ([Miyakawa, Ebisawa & Inoue (2012)]) and 1H0707–495 (Mizumoto, Ebisawa & Sameshima 2014), can also explain the spectral variations in 2–10 keV as well as the broad iron line features in 20 other Seyfert galaxies observed with Suzaku. In this model, the absorbed spectral component through the optically-thick absorbing clouds has a significant iron K-edge, which primarily accounts for the observed seemingly broad iron line feature. Fluctuation of the absorbing clouds in the line of sight of the extended X-ray source results in variation of the partial covering fraction, which causes an anti-correlation between the direct (not covered) spectral component and the absorbed (covered) spectral component below 10 keV. Observed spectral variation in 2–10 keV in a timescale of less than day is primarily explained by such variations of the partial covering fraction, while the intrinsic soft X-ray luminosity is hardly variable.
1 Introduction
Significant and aperiodic X-ray variation is one of the main characteristics of the Active Galactic Nuclei (AGN). However, origin of the AGN X-ray variation has not been fully understood yet, in spite of extensive observational and theoretical studies (e.g., [Mushotzky, Done & Pounds (1993), Ulrich, Maraschi & Urry (1997)]).
In particular, many Seyfert galaxies are known to exhibit an intriguing spectral variation in the iron K-energy band ( keV). MCG-6-30-15 is a representative example; its iron emission line profile seems to be broadened and skewed (e.g., [Tanaka et al. (1995)]), and fractional variation of the energy spectrum significantly drops at the iron line energy band (Fabian et al., 2002; Matsumoto et al., 2003). A possible scenario to explain these phenomena is the “light-bending model”. In this model, the fluorescent iron line is emitted at the innermost part of the accretion disk, so that the line profile is broadened and skewed, and the disk-reflected photons are much less variable than the direct photons due to relativistic reverberation (Fabian and Vaughan, 2003; Miniutti & Fabian, 2004). Alternatively, the seemingly broad iron emission line feature may be interpreted due to iron K-edge feature caused by partial covering of the central X-ray source by intervening absorbers in the line of sight (e.g., Matsuoka et al. (1990); Inoue & Matsumoto (2003); Miller, Turner & Reeves (2008)). In this model, the apparent invariability of the iron energy band is explained as due to such relatively higher variation of the continuum that is caused by change of the amounts of the absorption (Inoue & Matsumoto, 2003).
Miyakawa, Ebisawa & Inoue (2012) (MEI2012 hereafter) proposed a “variable partial covering (VPC) model”, which is a sophistication of the latter idea. In this model, below 10 keV, the original X-ray luminosity of the AGN is not significantly variable, and the apparent X-ray variation is primarily caused by variation of the geometrical covering fraction of the extended X-ray source by the intervening clouds having internal ionization structures. MEI2012 applied the VPC model to Suzaku observations of MCG-6-30-15, and successfully explained not only the small fractional variation in the iron energy band, but also the spectral variations in 1 – 10 keV (see also Inoue, Miyakawa & Ebisawa (2011)), besides an independent hard-tail variations above 10 keV.
Mizumoto, Ebisawa & Sameshima (2014) (MES2014 hereafter) has shown that the VPC model can also explain the soft X-ray spectral variations of the narrow Seyfert 1 galaxy 1H0707–405 observed with XMM and Suzaku below 10 keV. Therefore, it is interesting to examine if the VPC model is valid for other Seyfert galaxies to explain the spectral variation below 10 keV and the broad iron emission line feature. In the present paper, we explore the Suzaku archive to select Seyfert galaxies that show similar X-ray spectral characteristics to MCG-6-30-15, and apply the VPC model to see if their X-ray spectral shapes and variations in 2–10 keV are explained by this model.
2 Observations and Data Reduction
| Observation | Target | Sequence | Start | XIS | ||||
| # | (J2000.0) | # | Date | (ks) | ||||
| Type I Seyfert | ||||||||
| 1 | Markarian 335 | 00:06:19.582 | +20:12:10.58 | 0.0254 | 701031010 | 2006-06-21 | 151 | 0 2 3 |
| 2 | TonS 180 | 00:57:19.940 | 22:22:59.10 | 0.0620 | 701021010 | 2006-12-09 | 120 | 0 3 |
| 3 | 1H 0323+342 | 03:24:41.161 | +34:10:45.86 | 0.0629 | 704034010 | 2009-07-26 | 84 | 0 3 |
| 4 | NGC 1365 | 03:33:36.310 | 36:08:27.80 | 0.0056 | 705031010 | 2010-06-27 | 151 | 0 3 |
| 705031020 | 2010-07-15 | 302 | 0 3 | |||||
| 5 | 3C 111 | 04:18:21.277 | +38:01:35.80 | 0.0485 | 705040010 | 2010-09-02 | 80 | 0 3 |
| 705040020 | 2010-09-09 | 79 | 0 3 | |||||
| 705040030 | 2010-09-14 | 80 | 0 3 | |||||
| 6 | 1H 0419–577 (1) | 04:26:00.715 | 57:12:01.69 | 0.1040 | 702041010 | 2007-07-25 | 205 | 0 3 |
| 7 | 1H 0419–577 (2) | – | – | – | 704064010 | 2010-01-16 | 123 | 0 3 |
| 8 | Arakelian 120 | 05:16:11.395 | 00:08:59.65 | 0.0323 | 702014010 | 2007-04-01 | 100 | 0 3 |
| 9 | NGC 3227 | 10:23:30.608 | +19:51:53.82 | 0.0037 | 703022010 | 2008-10-28 | 58 | 0 3 |
| 703022020 | 2008-11-04 | 53 | 0 3 | |||||
| 703022030 | 2008-11-12 | 56 | 0 3 | |||||
| 703022040 | 2008-11-20 | 64 | 0 3 | |||||
| 703022050 | 2008-11-27 | 79 | 0 3 | |||||
| 703022060 | 2008-12-02 | 51 | 0 3 | |||||
| 10 | NGC 3516 | 11:06:47.494 | +72:34:06.70 | 0.0088 | 704062010 | 2009-10-28 | 251 | 0 3 |
| 11 | NGC 3783 (1) | 11:39:01.721 | 37:44:18.60 | 0.0097 | 701033010 | 2006-06-24 | 75 | 0 2 3 |
| 12 | NGC 3783 (2) | – | – | – | 704063010 | 2009-07-10 | 210 | 0 3 |
| 13 | NGC 4051 | 12:03:09.686 | +44:31:52.54 | 0.0022 | 703023010 | 2008-11-06 | 274 | 0 3 |
| 703023020 | 2008-11-23 | 78 | 0 3 | |||||
| 14 | NGC 4151 | 12:10:32.659 | +39:24:20.74 | 0.0033 | 701034010 | 2006-12-18 | 124 | 0 3 |
| 15 | Markarian 766 | 12:18:26.484 | +29:48:46.15 | 0.0123 | 701035010 | 2006-11-16 | 98 | 0 3 |
| 16 | Markarian 205 | 12:21:43.967 | +75:18:37.99 | 0.0708 | 705062010 | 2010-05-22 | 100 | 0 3 |
| 17 | NGC 4593 | 12:39:39.492 | 05:20:39.16 | 0.0090 | 702040010 | 2007-12-15 | 118 | 0 3 |
| Observation | Target | Sequence | Start | XIS | ||||
| # | (J2000.0) | # | Date | (ks) | ||||
| Type I Seyfert | ||||||||
| 18 | IC 4329A | 13:49:19.277 | 30:18:33.83 | 0.0160 | 702113010 | 2007-08-01 | 25 | 0 3 |
| 702113020 | 2007-08-06 | 30 | 0 3 | |||||
| 702113030 | 2007-08-11 | 26 | 0 3 | |||||
| 702113040 | 2007-08-16 | 24 | 0 3 | |||||
| 702113050 | 2007-08-20 | 24 | 0 3 | |||||
| 19 | NGC 5548 | 14:17:59.513 | +25:08:12.45 | 0.0165 | 702042010 | 2007-06-18 | 31 | 0 3 |
| 702042020 | 2007-06-24 | 35 | 0 3 | |||||
| 702042040 | 2007-07-08 | 30 | 0 3 | |||||
| 702042050 | 2007-07-15 | 30 | 0 3 | |||||
| 702042060 | 2007-07-22 | 28 | 0 3 | |||||
| 702042070 | 2007-07-29 | 31 | 0 3 | |||||
| 702042080 | 2007-08-05 | 38 | 0 3 | |||||
| 20 | 4C 74.26 | 20:42:37.285 | +75:08:02.36 | 0.1034 | 702057010 | 2007-10-28 | 91 | 0 3 |
| 21 | Arakelian 564 | 22:42:39.309 | +29:43:31.55 | 0.0249 | 702117010 | 2007-06-26 | 99 | 0 3 |
| 22 | SWIFT J2127.4+5654 | 21:27:45.400 | +56:56:35.00 | 0.0147 | 702122010 | 2007-12-09 | 91 | 3 |
| 23 | NGC 7469 | 23:03:15.674 | +08:52:25.28 | 0.0159 | 703028010 | 2008-06-24 | 112 | 0 3 |
| Type II Seyfert | ||||||||
| 24 | NGC 2992 | 09:45:42.045 | 14:19:34.90 | 0.0077 | 700005010 | 2005-11-06 | 37 | 0 2 3 |
| 700005020 | 2005-11-19 | 37 | 0 2 3 | |||||
| 700005030 | 2005-12-13 | 46 | 0 2 3 | |||||
| 25 | MCG -5-23-16 | 09:47:40.170 | 30:56:55.91 | 0.0082 | 700002010 | 2005-12-07 | 95 | 0 2 3 |
| 26 | Centaurus A | 13:25:27.615 | 43:01:08.81 | 0.0018 | 704018010 | 2009-07-20 | 62 | 0 3 |
| 704018020 | 2009-08-05 | 51 | 0 3 | |||||
| 704018030 | 2009-08-14 | 55 | 0 3 | |||||
| 27 | IRAS 18325–5926 | 18:36:58.257 | 59:24:08.44 | 0.0194 | 702118010 | 2007-10-26 | 78 | 0 3 |
2.1 Instruments
The data used in this paper were taken by Suzaku (Mitsuda et al., 2007), which has two operating instruments, the X-ray Imaging Spectrometer (XIS; Koyama et al. (2007)) and the Hard X-ray Detector (HXD; Takahashi et al. (2007); Kokubun et al. (2007)). The XIS is composed of four CCD cameras, XIS0 to XIS3, each of which is located on the focal plane of the identical X-ray telescope module (Serlemitsos, et al. (2007)). The XIS is sensitive in 0.2 – 12.0 keV, and the field of view (FOV) is 178 178. A half power diameter for the point-spread function is 2. The XIS0, 2, and 3 have front-illuminated (FI) chips, and the XIS1 has a back-illuminated (BI) one. Since the non-X-ray background (NXB) level of the FI CCDs is significantly lower than that of the BI CCD in the iron K-band, we use only the FI CCDs in the present study. The entire XIS2 and a part of the XIS0 are dysfunctional since 2006 November and 2009 June, respectively, presumably due to micrometeorite hits. The available XIS FI cameras during each observation are shown in the last column of the observation log (Table 1). The HXD consists of two types of the detectors, PIN and GSO, achieving the combined sensitivity in 10 – 600 keV. We use only PIN in this study (10 – 60 keV), since our targets are not bright enough to make the GSO spectral study feasible. The PIN has a FOV of 34 square in FWHM.
2.2 Data Selection
We chose data from the Suzaku public archive. Our main purpose is to study X-ray intensity and spectral variations of the Seyfert galaxies that have similar spectral characteristics to MCG-6-30-15, in particular in the iron K-energy band. Therefore, we selected only targets which are classified as Seyfert galaxies, and known to show the seemingly broad iron K-line feature or a hint of that.
The unit of Suzaku observations is an observation “sequence”, which is a single continuous pointing period, typically for a day. For a given target, we combine the sequences carried out within a month to define a new “observation” (Table 1). To study spectral variations efficiently, we chose only the observations which satisfy the following conditions; (1) long enough total exposure time ( ksec) for an observation, (2) bright enough that the total accumulate counts in an observation are more than 50,000 counts in 0.2 – 10 keV, and (3) the sources are variable more than 10% in 4 – 10 keV in an observation. Thus, we selected 27 observations for 25 targets (using 50 sequences in total). The observation log is shown in Table 1.
2.3 Data Reduction
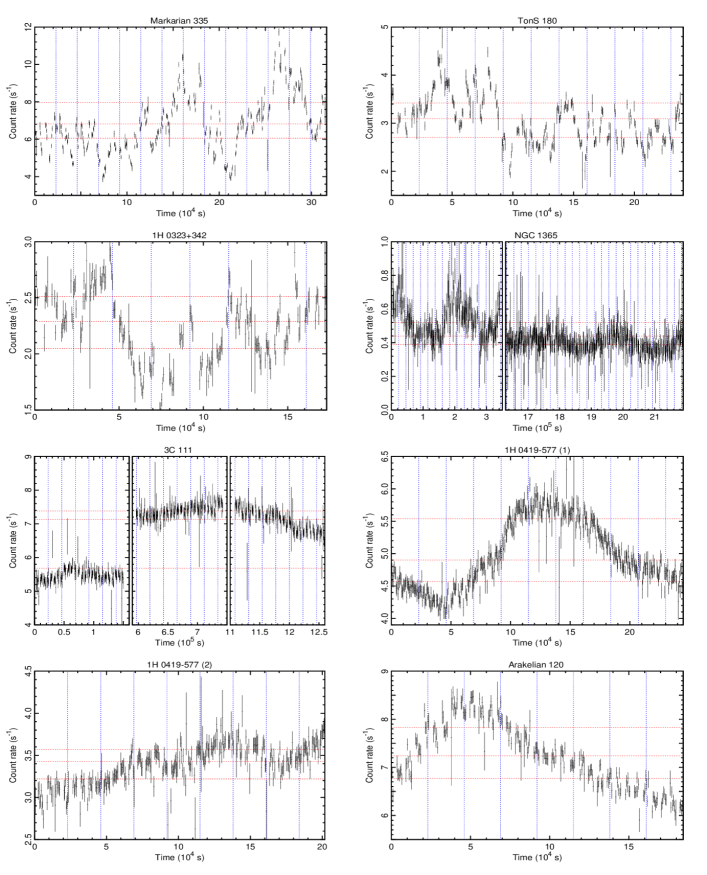
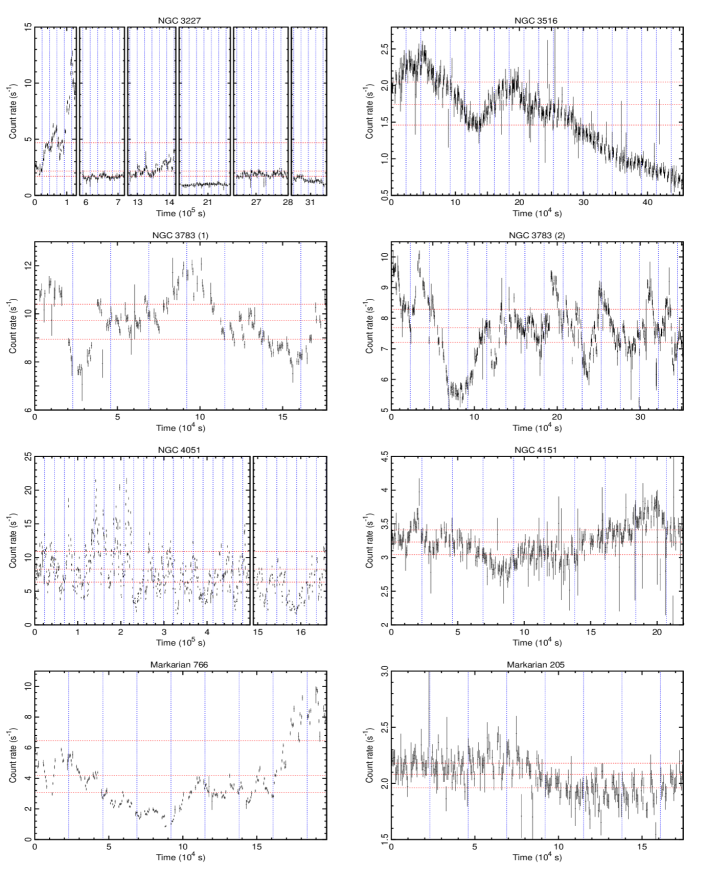
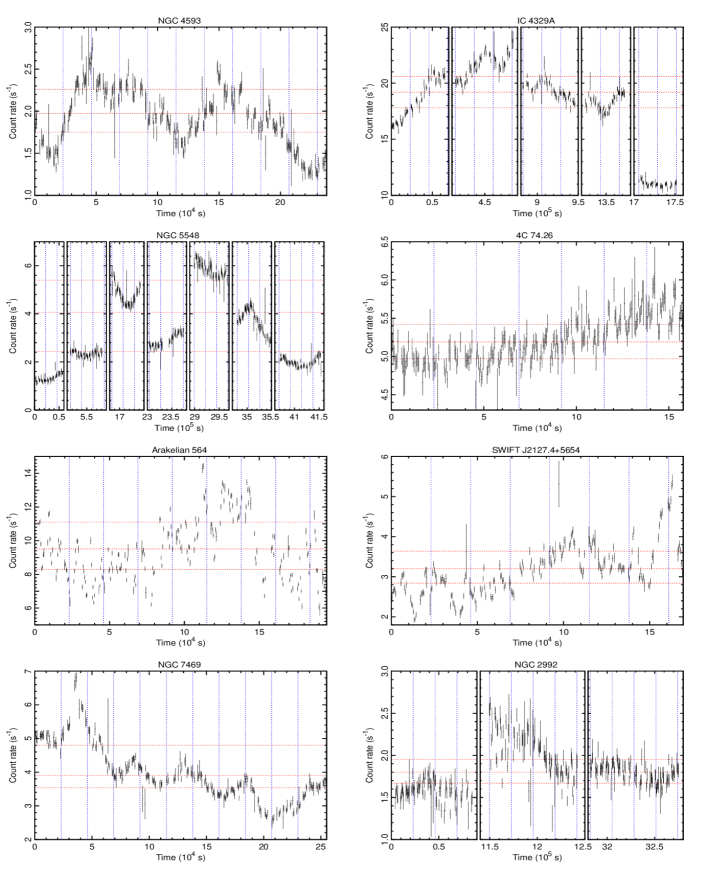
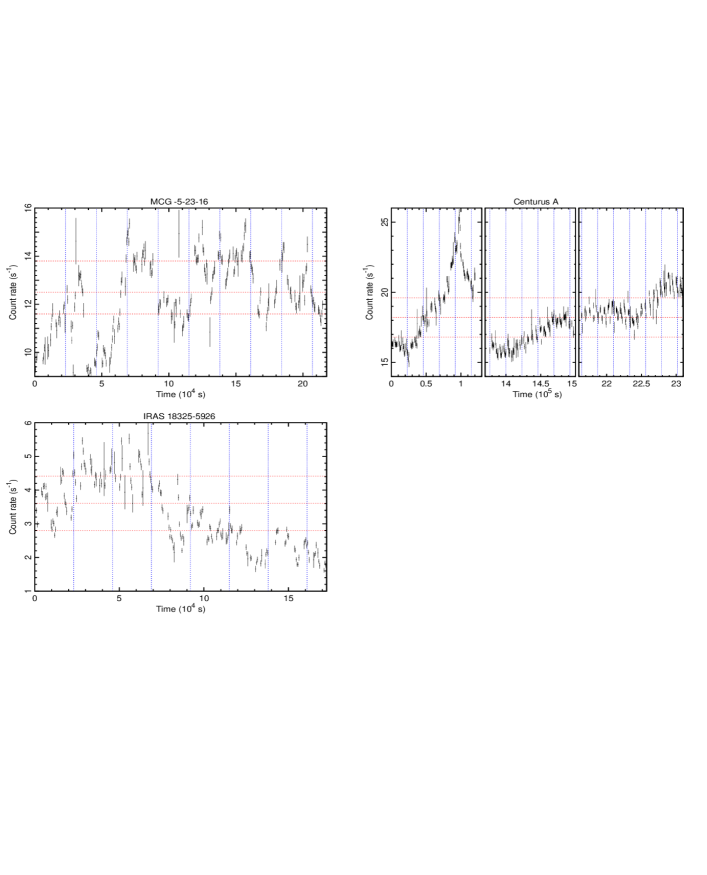
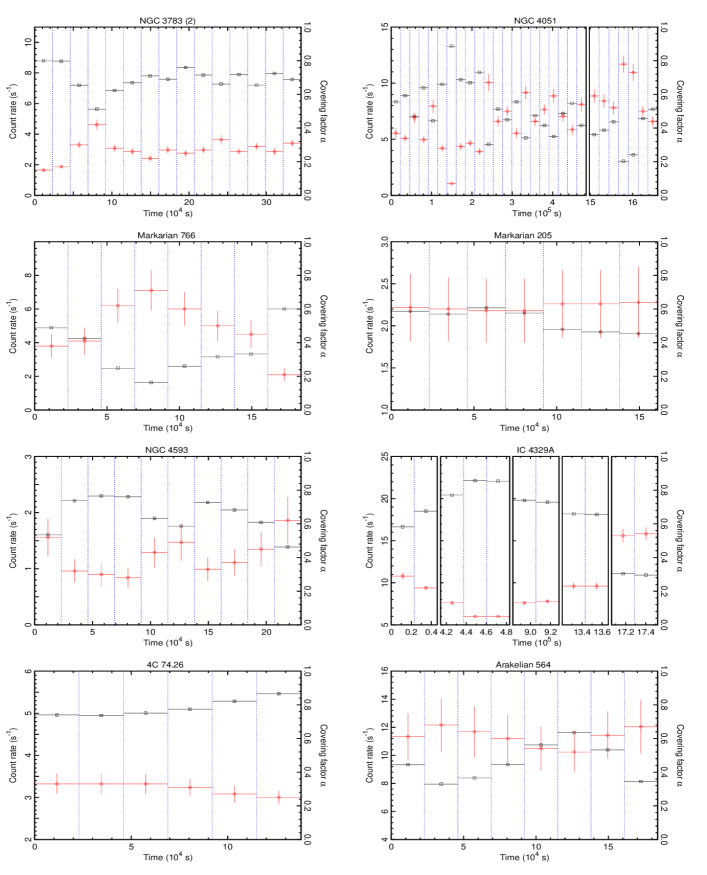
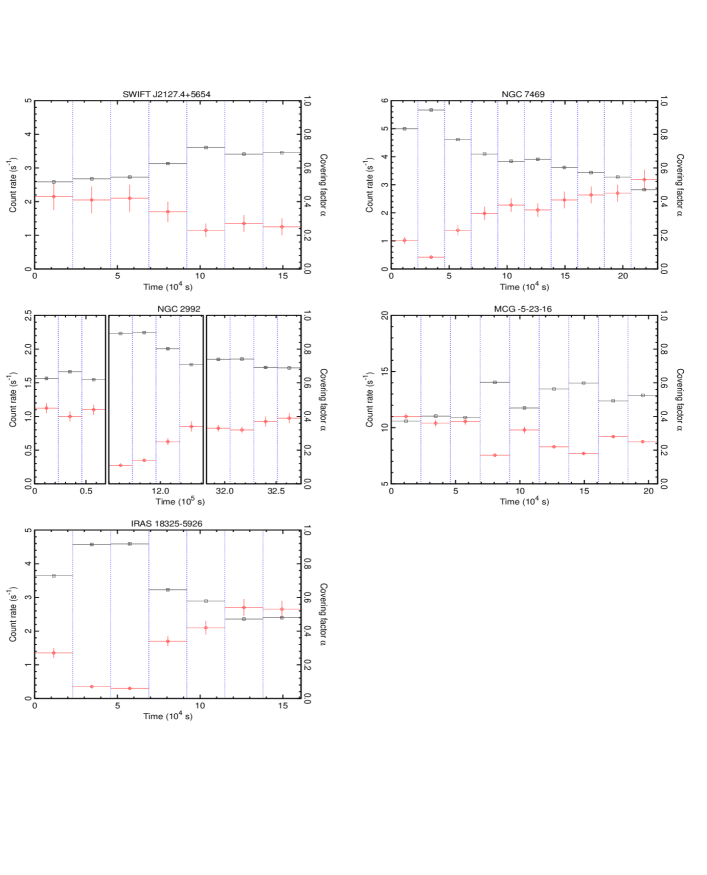
We reprocessed all the data under the standard pipeline version 2.5 and used HEASoft111See http://heasarc.nasa.gov/docs/software/lheasoft/ for detail. version 6.11 for data reduction. For the XIS, we excluded events obtained during passages through the South Atlantic Anomaly (SAA) and Earth elevation angle for the day-time Earth and for the night Earth. The source events were extracted from a 3 radius circle centered on the source. The background events were extracted from an annulus of 4–6 in radii when the source is located at the XIS nominal position, or from a 3 radius circle offset from the source avoiding the calibration sources at chip corners when the source is located at the HXD nominal position. Figure 1 shows the 0.2 – 12.0 keV light curves by XIS for all the 27 observations. As for the spectral analysis, we used redistribution matrix functions (RMFs) and ancillary response files (ARFs), created by the xisrmfgen and xissimarfgen (Ishisaki et al., 2007) tools. The three or two XIS FI spectra and responses were combined.
For the HXD/PIN, we exclude events obtained during passages through the SAA and elevation angle from dark Earth rim . The PIN background is composed of the NXB and Cosmic X-ray background (CXB). We simulated background data for the spectral analysis. The NXB spectrum was provided by the instrument team (Fukazawa et al., 2009), while the CXB spectrum was simulated by convolving the HEAO-1 model (Boldt, 1987) with the detector response.
3 Data Analysis and Results
3.1 Time-averaged spectra
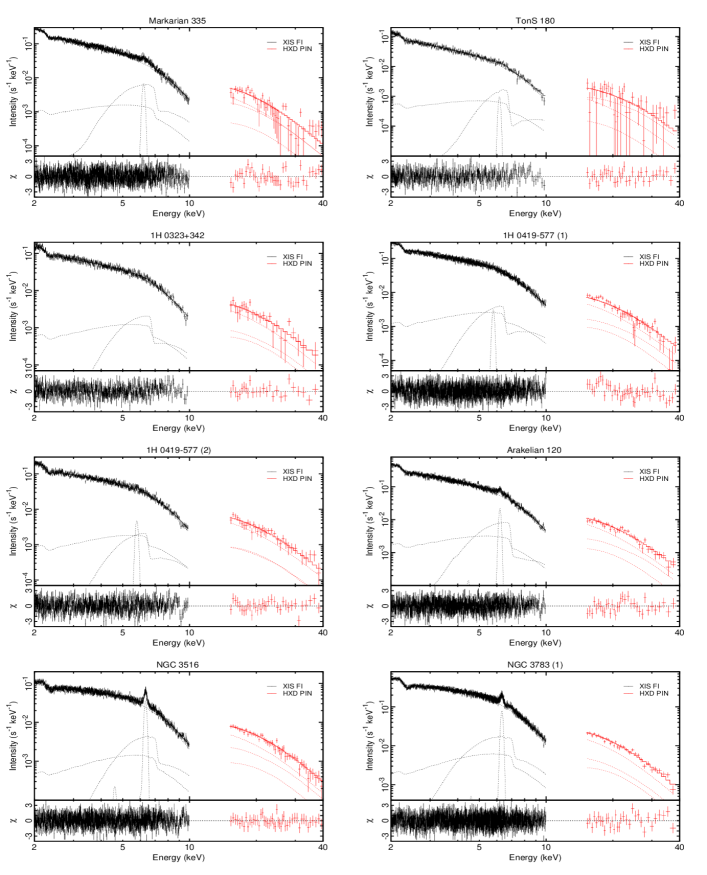
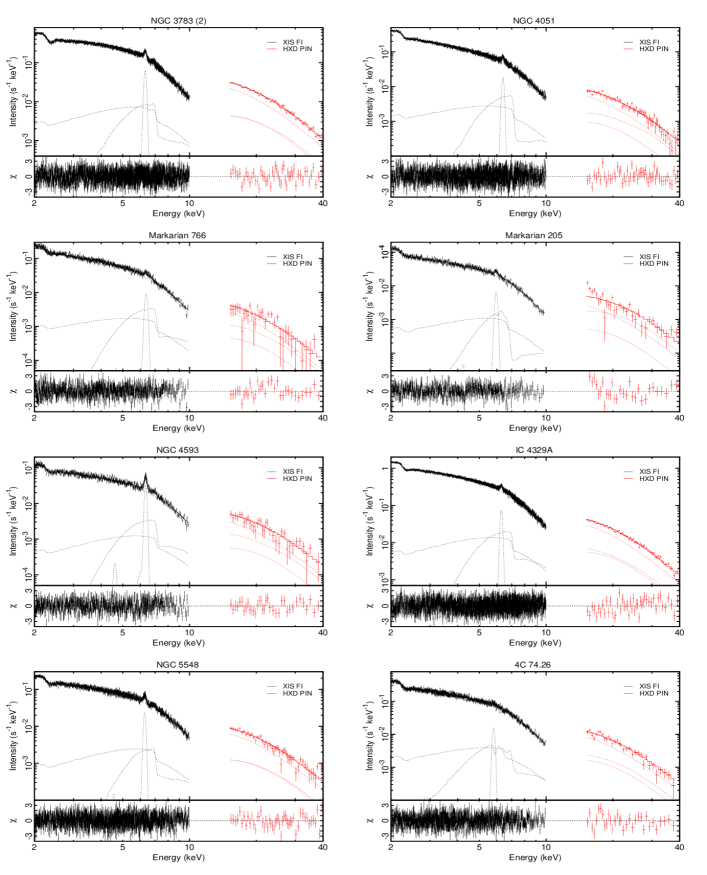
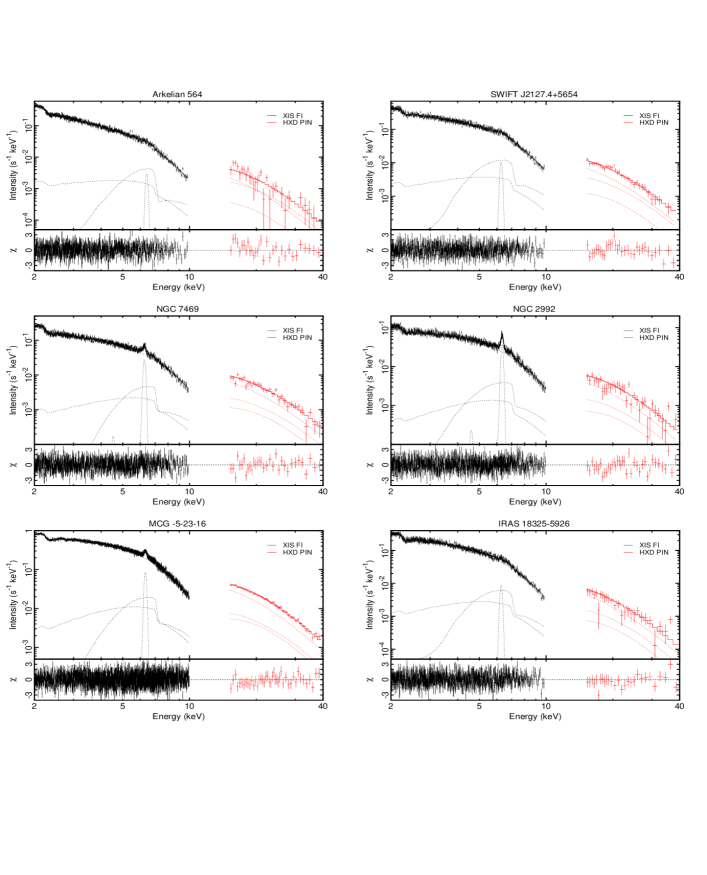
Since we are primarily interested in the iron K-line band, we use only 2 – 10 keV of the XIS data for spectral fitting, to avoid complexities in the softer ( 2 keV) energy band. We also use the PIN data in 10 – 40 keV, which help to constrain the underlying continuum to study iron K-band feature.
Firstly, we analyze the time-averaged spectra of the 27 observations from the 25 sources. We apply the same “3-component model” proposed by MEI2012. The model is represented as
| (1) |
where is the intrinsic cut-off power-law spectrum, and are the direct power-law normalization and the absorbed power-law normalization, respectively. , , and represent the transmissions due to high-ionized warm absorber, low-ionized warm absorber, and partial heavy absorber ( cm-2), respectively. Each warm-absorber has two parameters, the hydrogen column-density, , and the ionization parameter, , such that , and , where means the energy-dependent photo-absorption cross-section at . and are the reflection albedo and the reflection normalization by the neutral accretion disk, respectively (so that is the disk reflection component), and is a narrow iron K emission line. The interstellar extinction is also included in the model fitting, but not explicitly shown in Equation (1).
We used the X-ray spectral fitting package XSPEC version 12.7.0 for the spectral analysis. For the interstellar absorption and the disk reflection, we adopted phabs and pexrav (Magdziarz & Zdziarski, 1995) in XSPEC, respectively. Following MEI2012, the cut-off energy and the disk inclination angle are fixed at 160 keV and , respectively. is linked to so that , where is the solid-angle of the disk seen from the central source; we confirmed that changing the inclination angle only slightly changes the best-fit spectral parameters within statistical errors. For the warm absorbers, we use the table-grid model calculated by MEI2012 using XSTAR (version 2.1kn8), where redshift was fixed at 0.001.
In the following, we set the acceptance criterion of the successful model fitting as the reduced . The 4 sources did not satisfy the criterion; NGC 1365 (reduced ), NGC 3227 (1.23), NGC 4151 (1.24), and Centaurus A (1.42). 3C 111 satisfied the fitting criterion (reduced ), but the heavily absorbed component () was not required. Since the heavily absorbed component is the most important player in our VPC model to produce the broad iron line feature and the spectral variation below 10 keV, we drop 3C 111 from further study.
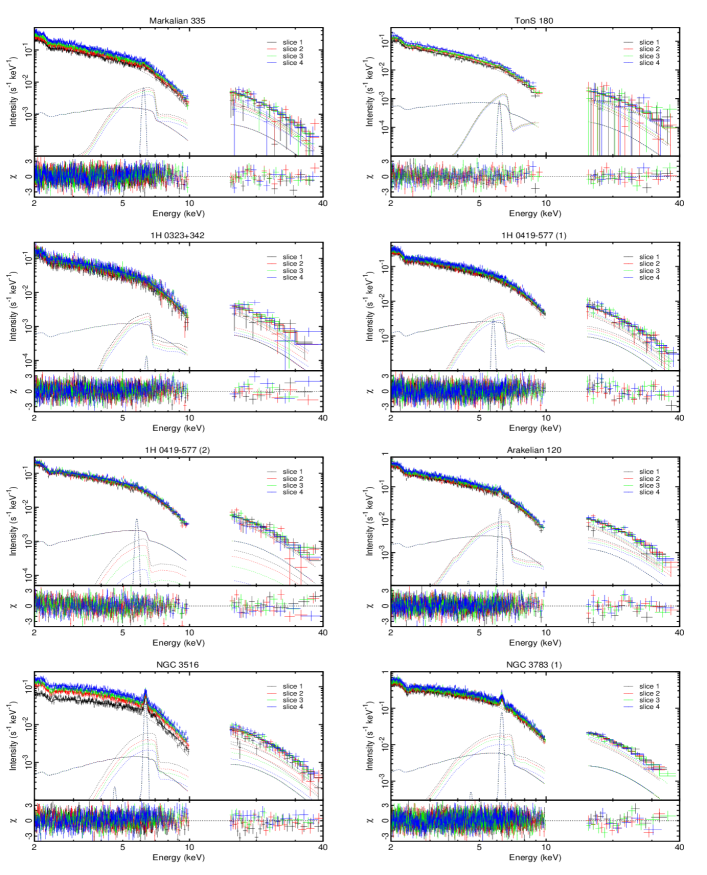
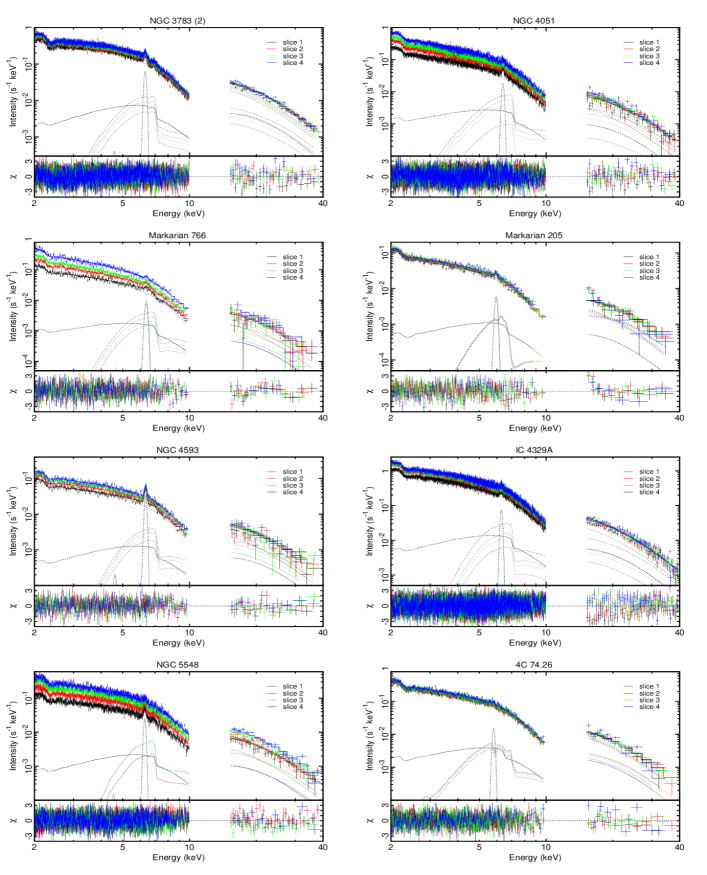
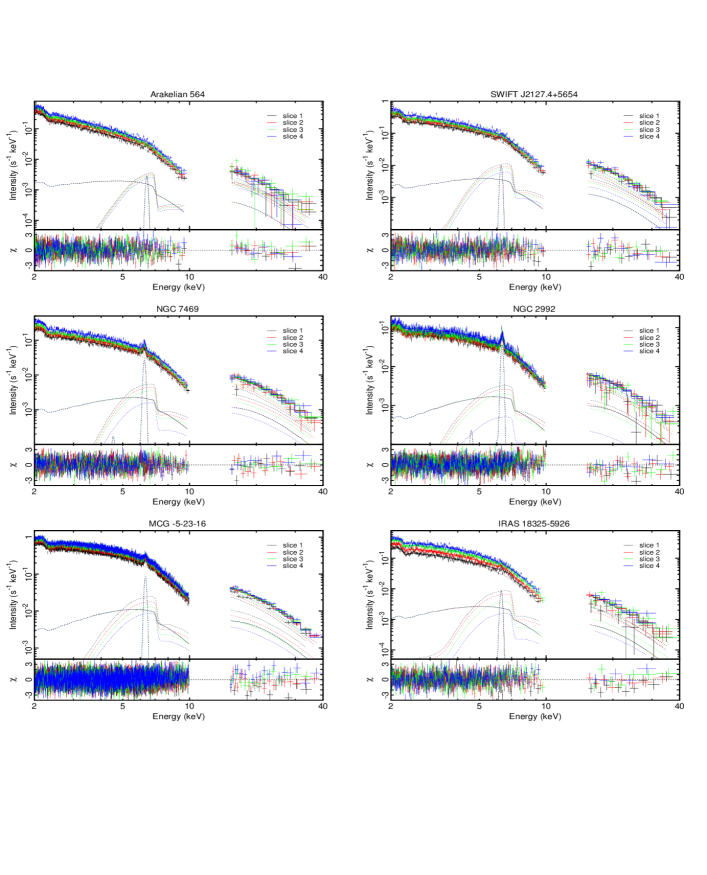
Consequently, 22 observations out of 20 sources are successfully represented with the 3-component model (Figure 2), and used for further study. The best-fit parameters of the 22 time-averaged spectra are summarized in Table 2.
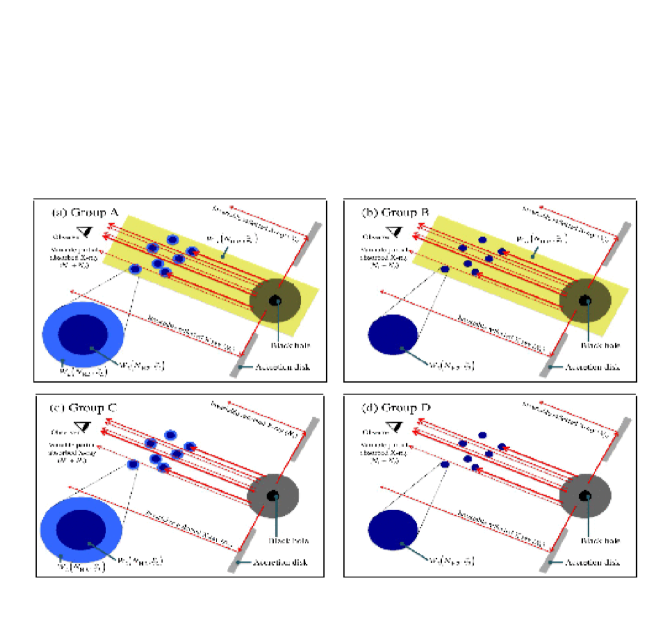
In the case of MCG-6-30-15, all the high-ionized absorber (), low-ionized absorber (), and the heavy absorber () were required (MEI2012). However, we found the three absorbers are not always necessary. In fact, only one of the 22 spectra requires all the three absorbers (we call it as Group A). In addition to the heavy absorber, 7 spectra require only the high-ionized absorber (Group B), and one requires only the low-ionized absorber (Group C). 13 require none besides the heavy absorber (Group D). We accept these differences as diversity of the Seyfert galaxies, for the time being, being not able to find an obvious reason to explain the difference. Our model for Group A, B, C and D are illustrated in Figure 3.
3.2 Intensity-sliced spectra
Next, we study spectral variations during each of the 22 observations (out of 20 sources), the average spectra of which were successfully fitted by the 3-component model. We examine if the VPC model proposed by MEI2012 may explain the observed spectral variations or not.
3.2.1 Model
To prepare, we briefly review the VPC model in the following: Let’s define the “total normalization”, , and the partial covering fraction, , so that
| (2) |
and
| (3) |
Here, we consider such a situation that the total normalization, , represents the intrinsic AGN luminosity, and the X-ray source having a finite size is partially covered by fragmented heavy absorbing clouds (with the absorption ), where the geometrical partial covering fraction is .
Detailed study of spectral variations of MCG-6-30-15 by MEI2012 revealed, surprisingly, that the low-ionized warm absorption is related to the same partial covering fraction , such that
| (4) |
where is the common amount of the column density of the low-ionized absorber while the spectra vary. This relation was unexpected, since the low-ionized absorption and the partial covering fraction due to should be in principle independent (see equation 1). MEI2012 interpreted this relation as that the low-ionized absorber () and the heavy absorber () are parts of the same absorbing clouds (Figure 3), so that the “double partial covering” with the same covering fraction is presumably the case (MES2014).
Consequently, the 3-component model (1) is rewritten as
| (5) |
MEI2012 applied this model to the eight intensity-sliced spectra of MCG-6-30-15 observed with Suzaku, where the good-time intervals (GTIs) are determined using XIS below 10 keV. is assumed to be invariable, and fixed to be 0.3 times the average of . The iron line parameters are also fixed to those obtained from the time-averaged spectra. These spectra were explained well in 1 – 40 keV by only variation of , whereas is invariable besides the brightest one (where is 1.5 times greater); all the other spectral parameters are invariable (=common to all the variable spectra).
3.2.2 Model Fitting
Following MEI2012, we create the intensity-sliced spectra based on the XIS flux, and examine the VPC model (5). For each observation, we define four intensity ranges in the 0.2 – 12.0 keV light curve so that the photon counts for each intensity range be approximately equal, and create the four intensity-sliced energy spectra. The red dotted horizontal lines in Figure 1 indicate the intensity boundaries for each observation.
We try to fit the four intensity-sliced spectra in 2 – 40 keV simultaneously with the model (5) only making variable. If necessary, is varied in addition. Other parameters are common to all the four spectra, and the best-fit values are determined from the model fitting (Table 3).
As a result, we successfully fitted the intensity-sliced spectra of the 20 observations of 18 sources only varying . The rest two sources (Markarian 766 and NGC 5548) require to be slightly variable: Markarian 766 requires for the brightest spectrum to be 1.3 times greater than the rest. NGC 5548 requires the for the brighter two spectra to be 1.7 times higher than the dimmer two. We summarize the spectral fitting results with the VPC model for the 22 intensity-sliced spectra in Figure 4 and Table 3.
3.3 Time-sliced spectra
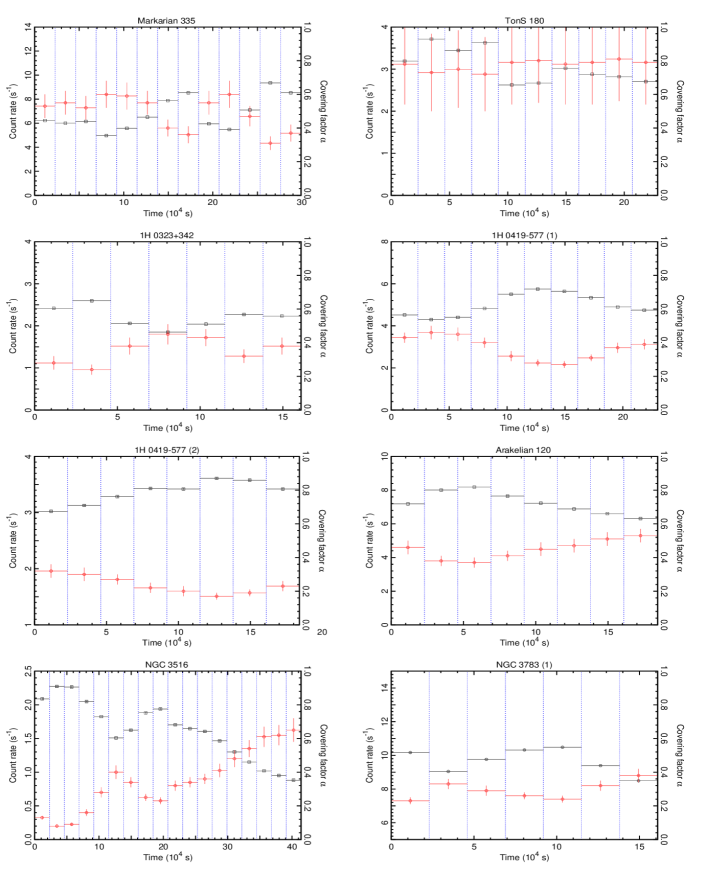
Next, we see if time sequences of the soft X-ray energy spectra are also explained by the VPC model with the time-varying partial covering fractions. In the XIS light-curves, we define boundaries of the time-sliced spectra every sec, which corresponds to four Suzaku orbital periods. The blue vertical dotted lines in Figure 1 show the time-boundaries for each observation, and we made energy spectra from each time bin. Numbers of the time-sliced spectra in a single observation are from 6 (4C 74.26) to 28 (NGC 4051). For each observation, a time-series of the XIS and PIN spectra are fitted simultaneously with the VPC model in Equation (5), while spectral variation above 10 keV is hardly constrained, because the photon statistic is not sufficient. We first try to fit the spectra only allowing the partial covering fraction to vary. If not successful (i.e., ), the total normalization is varied in addition.
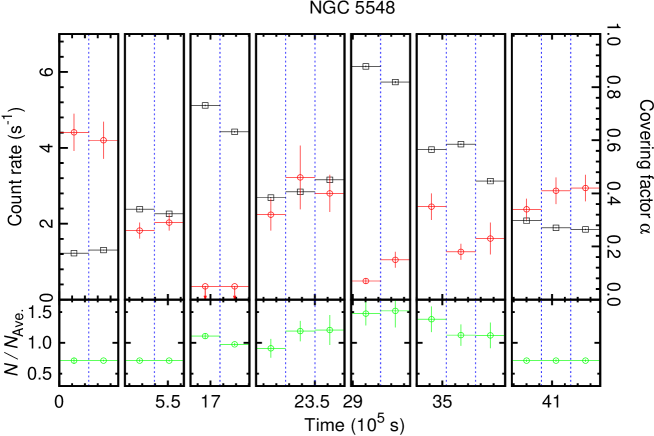
As a result, we found that the XIS spectral variations are explained only varying for 21 observations from 19 sources. Figure 5 shows variation of the observed counting rates in 0.2 – 12 keV and the partial covering fraction for each of the 21 observations. Anti-correlation between the counting rate and the partial covering fraction is obvious. Namely, apparent soft X-ray flux and spectral variations below 10 keV are primarily caused by variation of the partial covering fraction. Only the remaining source, NGC 5548, needs varying the total normalization in addition to within a single observation. Figure 6 shows variation of the counting rates and partial covering fraction for NGC 5548. Note that observation of NGC5548 spans more than sec, which is the longest in our samples, and the total normalization is still invariable within time-scales less than several sec. This suggests that the intrinsic luminosity variation of Seyfert galaxies has a timescale longer than sec.
3.4 Variation in the Iron Line Energy Band
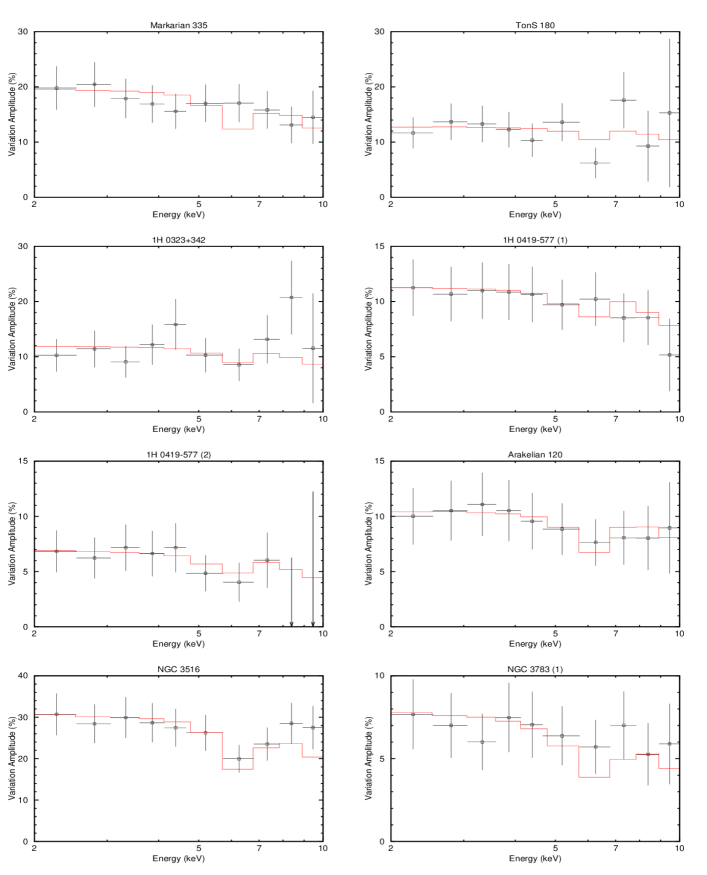
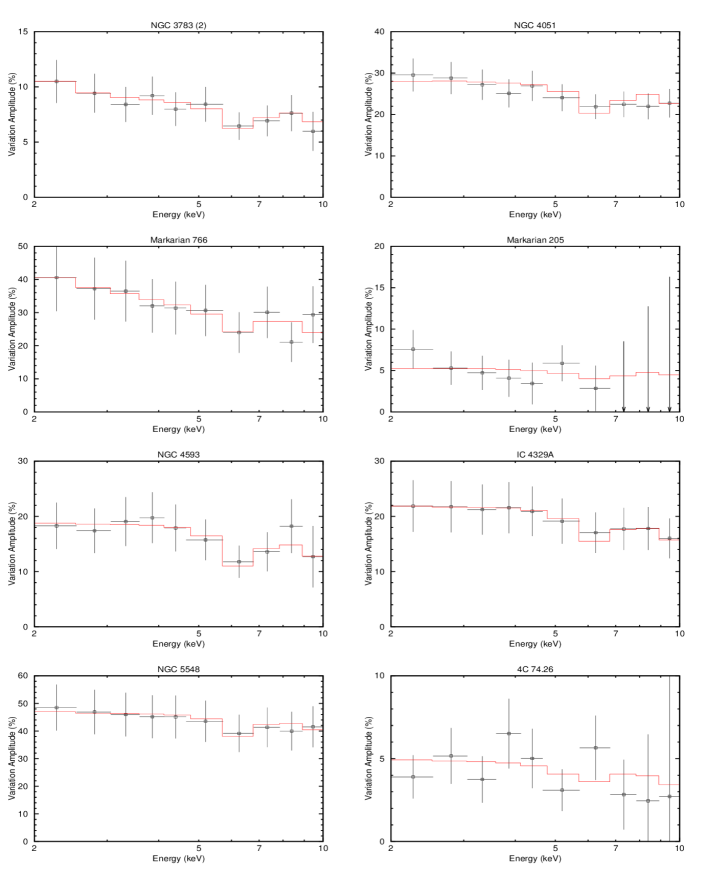
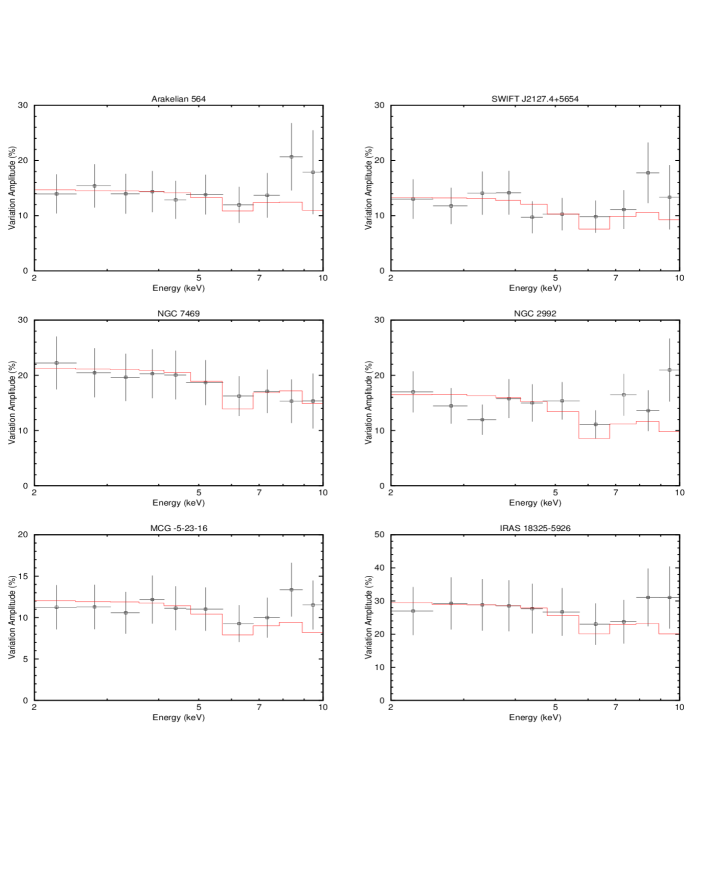
In order to study variation in the iron line energy band, we calculate the Root Mean Square (RMS) spectra for the 22 observations. We use the same time-series of the spectra used in the previous section. Namely, RMS spectra are calculated with a bin-width of sec.
For a time-series of , where are background-subtracted counting rates, are their errors, and is number of the time-bins, the RMS variability is given as
| (6) |
where , and the error is
| (7) |
(Edelson et al. 2002). For each observation, we computed the RMS variability for 15 energy band with Equation (6) to constitute the RMS spectrum. We used only the XIS data in 2 – 10 keV to focus the iron line energy band. The 22 RMS spectra are shown in Figure 7 (in black).
Since each time-sliced spectrum is fitted successfully with the VPC model, the RMS model spectra can be calculated from the best-fit VPC model spectra. These model RMS spectra are also shown in Figure 7 (in red). We find that the observed RMS spectra and the model RMS spectra agree well, and both tend to show drops at the iron line energy band (6 – 7 keV). The reason for that is discussed in section 4.1.
4 Discussion
4.1 Origin of the Broad Iron Line Feature and the Soft X-ray Variation
We have seen that the Variable Partial Covering (VPC) model, which has been proposed for MCG-6-30-15 (MEI2012) and 1H0707–495 (MES2014), can explain the 2–10 keV spectral variation of 20 other Seyfert galaxies observed with Suzaku. The original VPC model for MCG-6-30-15 requires three types of the absorbers; optically-thick partial absorbing clouds, optically-thin envelopes of the clouds, and a uniformly surrounding highly ionized absorber (Group A in Figure 3). 1H0707–495 does not require the highly ionized absorber (Group C in Figure 3; MES2014), and the 20 targets studied in this paper are grouped into four depending on the number and types of the absorbers required (Figure 3). The optically-thick partial absorbers are always required, where the hydrogen-column densities are cm-2 and the partial covering fraction is variable from 0.1 to (Table 3).
The heavily absorbed spectral components by such optically-thick absorbing clouds exhibit strong iron K-edge, which, together with the distant reflection feature (narrow iron emission line and weak iron K-edge), can explain the observed spectral feature in the iron K-band (Figure 2). Because such thick absorbers are completely opaque at 2 keV (Figure 2), variation of the partial covering fraction can cause significant soft X-ray flux variations even if the intrinsic X-ray luminosity is invariable. In fact, the observed flux and spectral variations below keV within a time scale of day are explained by only variation of the partial covering fraction, while the intrinsic luminosity below 10 keV is assumed to be constant (Figures 4 and 5).
It is well-known that fractional variation at the broad iron line-like feature in MCG-6-30-15 is significantly reduced (Fabian et al. (2002), Matsumoto et al. (2003), Inoue & Matsumoto (2003)). In the VPC model when the total normalization (intrinsic luminosity) is invariable, change of the partial covering fraction causes anti-correlation between the direct (uncovered) spectral component and the absorbed (covered) spectral component below 10 keV (Figure 4). Thus, flux variations of the direct component and the absorbed component cancel each other. The fluxes from these components are the closest where the absorbing material is most transparent, just below the iron edge at 7.1 keV. Consequently, the cancellation of the two spectral components works most effectively at around 5.5–7 keV, and the fractional variation is reduced (Figure 7; see also Inoue, Miyakawa & Ebisawa (2011) and MEI2012). Also, the 6.4 keV iron emission line is not expect to vary with the continuum, as it is emitted from outer parts of the accretion disk. These effects work together to reduce the fractional variation at around the iron energy band.
Among the datasets used in this paper, span of the NGC5548 observation is the longest, for 50 days. Its soft X-ray luminosity does vary, by a factor of two over sec, while the covering fraction varies more significantly at much shorter timescales (Figure 6). Presumably, soft X-ray flux variation of Seyfert galaxies have two different origins with different timescales; intrinsic luminosity variation over days and variation of the partial covering fraction below a timescale of day (see also MES2014).
4.2 Hard X-ray Variations
We could fit the variable spectra in 2 – 10 keV only varying the partial covering fraction (Figures 4 and 5). When the same GTIs determined based on the XIS counting rates below 10 keV are used for PIN in 10 – 40 keV, we see some, but not very significant, residuals above 10 keV (Figure 4); this was also the case for MCG-6-30-15 (MEI2012). Note, in the VPC model, variation of hardly affects the spectral variation above 10 keV, where effect of the photo-absorption is minimum. Namely, if the hard-tail variations above 10 keV were correlated with the intensities below 10 keV, we would have seen much more significant systematic discrepancies above 10keV. Thus, the current results suggest that the hard-tails above 10 keV are rather independently variable and averaged when sorted by the intensities below 10 keV. In fact, presence of such independently variable hard components above 10 keV is confirmed through completely different approach in MCG-6-30-15 (Noda et al. 2011) and NGC3516 (Noda et al. 2013). For 1H0707–495, the VPC model almost perfectly represents the flux variation in 0.5 – 1 keV in timescales within day, while less satisfactorily in higher energies (MES2014); this also suggests the commonness of the independently variable hard component in Seyfert galaxies. In summary, we propose that observed X-ray flux/spectral variation of Seyfert galaxies is explained by variation of the partial covering fraction in timescales below day and the intrinsic soft X-ray luminosity variation over sec, both of which are mainly responsible for 10 keV, and independent hard X-ray variations above 10 keV.
4.3 Origin of the Optically-thick Absorbing Clouds
From the observed timescales of the X-ray spectral variation and the ionization condition, MEI2012 estimated sizes and locations of the partial absorbing clouds, and proposed that the partial covering clouds in the VPC model are the broad line region (BLR) clouds. We revisit this model assuming the BLR parameters estimated from optical observations. We assume the following typical BLR parameters; size of BLR, cm, BLR cloud size, cm, and a BLR cloud velocity, cm s-1 (Petterson 2006).
First, the absorbing clouds should be optically thick at the iron K-edge, such that cm-2, and (Table 2). Ionization parameter of a BLR cloud may be estimated as follows;
| (8) |
thus the assumption of the optical-thickness is valid.
Next, we estimate the X-ray emission region size and the variation timescale. We do not see either full-covering nor the no-covering, and a typical covering fraction is (Figure 5). Thus, if we take the X-ray emission region size , , namely . If normalized by the Schwarzschild radius, cm, . Presumably, this is reasonable as an X-ray emitting corona surrounding the central black hole. Also, typical flux variation timescale due to passage of a BLR cloud may be estimated as sec, which agrees with observations (Figure 5).
We notice that, in MCG-6-30-15 and the 20 Seyfert galaxies analyzed in this paper, such moderate 6.4 keV emission lines with typical equivalent-widths of eV are observed, that are consistent with the fluorescence from the distant cold reflectors with which we assumed. If the central X-ray sources are almost fully surrounded by thick and cold absorbers in these AGNs, much stronger fluorescent lines would have been observed (e.g., Reynolds et al. 2009). Thus, the weakness of the observed fluorescent emission line suggests that the partial absorbing materials are directional and/or localized, occupying a much smaller solid angle than . It has been pointed out by theoretical simulations that accretion disks in AGNs tend to have disk winds or outflows, which imprints a variety of spectroscopic signatures including absorption lines and edges in the X-ray/UV spectra (e.g., Proga and Kallman 2004, Sim et al. 2010, Nomura et al. 2013). So, the partial covering clouds may be a part of such fragmented and directional disk winds or outflows. Furthermore, Doppler motion of the outflowing clouds will smear the narrow emission line features, which would make the fluorescent lines less noticeable.
According to the simulation by Nomura et al. (2013), where condition of the Broad Absorption Line (BAL) quasars is studied, the broad iron K-absorption lines due to very fast outflow ( km s-1) of low-ionized material () are observed only in a narrow range of the viewing angle between and . When the viewing angle is larger (closer to edge-on), the BAL will not be produced, as the outflow gas will be too thick ( cm-2) and the velocity will be too low. These conditions are, however, rather suitable for the optically-thick partial absorbing clouds, which are required in our VPC model. Thus, the Seyfert galaxies observed through the optically-thick partial absorbers may be the outflowing AGNs seen close to edge-on. In fact, such AGN outflow gas might be origin of the BLR clouds (Patterson 2006).
4.4 Comments on the Relativistic Disk-line Model
Our VPC model explains the observed broad and unvarying iron line features from Seyfert galaxies in terms of fluctuation of the partial absorbers in the line of sight. An alternative model which might explain the broad and unvarying iron line features is the “relativistic disk-line model” (Fabian et al. 2014 and references therein), where the fluorescent iron lines are supposed to be emitted from the innermost region of the illuminated accretion disk, significantly skewed and broadened by strong relativistic effects. In this scenario, suppression of the iron line variability is explained by relativistic “light-bending effect” (Miniutti & Fabian 2004), where the disk-reflected photons are less variable than the direct photons from the illuminating source, while the height of a point-like illuminating source above the accretion disk varies.
Whereas the light-bending model qualitatively explains the invariability of the broad iron emission line, it does not seem to explain the observed spectral variations quantitatively (see, e.g., Goosmann et al. 2006, Niedźwiecki and Miyakawa 2010, Życki et al. 2010, Gallo et al. 2015). The most significant parameter to cause observable spectral changes in the light-bending model is the height of the point-like source above the accretion disk. So that the light-bending model to remain compelling, it should explain quantitatively the observed spectral variations (Figures 4 and 5), as well as the RMS spectra (Figure 7) by only change of the source height above the disk.
Presumably, a critical point of the relativistic disk-line model is its extreme concentration of the disk-reflected emission within the innermost region where the relativistic effects are the strongest. For instance, in extreme cases, a prediction was made based on the disk-line model that much of the X-ray emission should originate from within only a few gravitational radii (e.g., Fabian and Vaughan 2003, Fabian et al. 2009). If this is the case, since the AGN is surrounded by many absorbing clouds far outside, when an absorber greater than the X-ray emission region size moves across the line-of-sight, we shall see an abrupt total eclipse, but never a gradual partial eclipse. However, observational evidences are being accumulated for Seyfert galaxies that the extended X-ray sources are partially and progressively obscured by intervening absorbers with comparable sizes (e.g., McKerna & Yaqoob 1998, Maiolino et al. 2010, Sanfrutos, M. 2013, Kaastra et al. 2014, Marinucci et al. 2014, Beuchert et al. 2015). In an occultation event identified in MCG-6-30-15, the partial covering fraction varied gradually by 0.32 within 20 ksec by a BLR cloud far outside (Marinucci et al. 2014). This strongly suggests that the X-ray source is more extended than the absorber, contrary to the assumption of the relativistic disk-line model.
More unambiguous constraint of the X-ray emission region size may come from the X-ray micro-lensing observations. Chartas et al. (2012) observed progressive profile changes of the fluorescent iron emission lines from the gravitationally lensed quasar RX J1131–1231, when the caustic passes over the inner accretion disk. The lines are distorted by general relativistic and Doppler effects, and the line emitting radius is directly measured from these effects as 15 times the gravitational radius. Mosquera et al. (2013) directly measured the X-ray emission region size of Q2237+0305; the half-light radius of the hard X-ray (3.5 – 21.5 keV) is cm, which is an order of magnitude smaller than that of the optical emission, and marginally smaller than that of the soft X-ray emission (1.1 – 3.5 keV). It is particularly of interest that the lower-limit of the X-ray emission region size is directly constrained. Taking the black hole mass estimates as (Morgan et al. 2010) or 2.4 (Assef et al. 2011), hard X-ray emission region size (half-light radius) is constrained as or times the gravitational radius, respectively. These micro-lensing results are consistent with the partial covering scenario that X-ray emission region is extended as much as a few tens of the gravitational radius and comparable in size with the partial absorbing clouds in the line-of-sight. So that the relativistic reflection scenario works, the innermost disk region has to be sufficiently illuminated, and at least a part of the X-ray emitting corona should lie within about 10 gravitational radii (Fabian et al. 2014). Future micro-lensing observations are expected to constrain the lower-limit of the X-ray emission region size more tightly, and tell if the relativistic disk-line scenario is truly feasible or not.
5 Conclusions
In this paper, we have studied origin of the soft X-ray spectral variation and broad iron line feature commonly observed in Seyfert galaxies. We have applied the Variable Partial Covering (VPC) model, which was originally proposed for MCG-6-30-15 (Miyakawa, Ebisawa & Inoue (2012)) and has been shown to be successful to 1H0707–495 as well (Mizumoto, Ebisawa & Sameshima, 2014), to 20 other Seyfert galaxies observed with Suzaku. In the VPC model, most spectral variations below 10 keV in a timescale within day are explained by variation of the partial covering fraction of the extended X-ray source due to fluctuations of the optically-thick absorbing clouds in the line of sight. Not only the broad iron line features, but also the 2 – 10 keV spectral variations are successfully explained by the VPC model. We conclude that observed X-ray flux/spectral variation of Seyfert galaxies is explained by variation of the partial covering fraction in timescales below day and the intrinsic soft X-ray luminosity variation over sec, both of which are mainly responsible for 10 keV, and independent hard X-ray variations above 10 keV.
This research has made use of public Suzaku data obtained through the Data ARchives and Transmission System (DARTS), provided by the Institute of Space and Astronautical Science (ISAS) at Japan Aerospace Exploration Agency (JAXA). For data reduction, we used software provided by the High Energy Astrophysics Science Archive Research Center (HEASARC) at NASA/Goddard Space Flight Center. HS is financially supported by JSPS Grant-in-Aid for JSPS Fellows Grant Number 12J10755, and MM is supported by JSPS KAKENHI Grant Number 15J07567.
References
- (1) Assef, R. J., Denney, K. D., Kochnek, C. S., et al. 2011, ApJ, 742, 93
- (2) Beuchert, T. et al. 2015, A&A, 584, A82
- Boldt (1987) Boldt, E. 1987, Phys. Rep., 146, 215
- (4) Chartas, G., Kochanek, C. S., Dai, X., Moore, D., Mosquera, A. M. & Blackburne, J. A. 2012, ApJ, 757, 137
- (5) Edelson, R. et al. 2002, ApJ, 568, 610
- Fabian et al. (1989) Fabian, A. C., Rees, M. J., Stella, L., & White, N. E. 1989, MNRAS, 238, 729
- Fabian et al. (2002) Fabian, A. C., et al. 2002, MNRAS, 335, L1
- Fabian and Vaughan (2003) Fabian, A. C. & Vaughan, S. 2003, MNRAS, 340, L28
- (9) Fabian, A. C. et al. 2009, Nature, 459, 540
- (10) Fabian, A.C., Parker, M.L., Wilkins, D.R., Miller, J.M., Kara, E., Reynolds, C.S. and Dauser, T. 2014, MNRAS, 439, 2307
- Fukazawa et al. (2009) Fukazawa, Y., et al. 2009, PASJ, 61, S17
- (12) Gallo, L. et al. 2015, MNRAS, 446, 633
- (13) Goosmann, R. W. et al. 2006, A&A, 454, 741
- Ishisaki et al. (2007) Ishisaki, Y., et al. 2007, PASJ, 59, S113
- Inoue & Matsumoto (2003) Inoue, H., & Matsumoto, C. 2003, PASJ, 55, 625
- Inoue, Miyakawa & Ebisawa (2011) Inoue, H., Miyakawa, T. & Ebisawa, K. 2011, PASJ, 63, S669
- (17) Kaastra, J. S. et al. 2014, Science, 345, 64
- Kokubun et al. (2007) Kokubun, M., et al. 2007, PASJ, 59, S53
- Koyama et al. (2007) Koyama, K., et al. 2007, PASJ, 59, S23
- Magdziarz & Zdziarski (1995) Magdziarz, P., & Zdziarski, A. A. 1995, MNRAS, 273, 837
- (21) Marinucci, A. et al. 2014, ApJ, 787, 83
- Matsumoto et al. (2003) Matsumoto, C., Inoue, H., Fabian, A. C.,& Iwasawa, K. 2003, PASJ, 55, 615
- (23) McKernan, B. & Yaqoob, T. 1998, ApJ, 501, L29
- Miller, Turner & Reeves (2008) Miller, L., Turner, L. J., & Reeves, J. N. 2008, A&A, 483, 437
- (25) Maiolino, R. et al. 2010, A&A, 517, A47
- Matsuoka et al. (1990) Matsuoka, M., Piro, L., Yamauchi, M. & Murakami, T. 1990, ApJ, 361, 440
- Miniutti & Fabian (2004) Miniutti, G., & Fabian, A. C. 2004, MNRAS, 349, 1435
- Mitsuda et al. (2007) Mitsuda, K., et al. 2007, PASJ, 59, S1
- Miyakawa, Ebisawa & Inoue (2012) Miyakawa, T., Ebisawa, K. & Inoue, H. 2012, PASJ, 64, 140 (MEI2012)
- Mizumoto, Ebisawa & Sameshima (2014) Mizumoto, M., Ebisawa, K. & Sameshima, H. 2014, PASJ, 66, 122 (MES2014)
- (31) Morgan, C. W., Kochane, C. S., Morgan, N. D. & Falco, E. E. 2010, ApJ, 712, 1129
- (32) Mosquera, A. M., Kochanek, C. S., Chen, B., Dai, X., Blackburne, J. A. & Chartas, G. 2013, ApJ, 769, 53
- Mushotzky, Done & Pounds (1993) Mushotzky, R. F. , Done, C. & Pounds, K. A. 1993, ARA&A, 31, 717
- (34) Niedźwiecki, A & Miyakawa, T. 2010, A&A, 509, 22
- (35) Noda, H., Makishima, K., Uehara, Y., Yamada, S. & Nakazawa, K. 2011, PASJ, 63, 449
- (36) Noda, H., Makishima, K., Nakazawa, K. & Yamada, S. 2013, ApJ, 771, 100
- (37) Nomura, M., Ohsuga, K., Wada, K., Susa, H. & Misawa, T., 2013, PASJ, 65, 40
- (38) Peterson, B.M. 2006, in ”The Broad-Line Region in Active Galactic Nuclei”, in Physics of Active Galactic Nuclei at All Scales, Springer Lecture Notes in Physics Series, Vol. 693, ed. Danielle Alloin, Rachel Johnson, and Paulina Lira, p. 77.
- (39) Proga, D. & Kallman, T. R., 2004, ApJ, 616, 688
- (40) Reynolds, C. S, Fabian, A. C., Brenneman, L. W., Miniutti, G., Uttley, P & Gallo, L. C., 2009, MNRAS, 397, L21
- (41) Sanfrutos, M. et al. 2013, MNRAS, 436, 1588
- (42) Sim, S. A., Proga, D., Miller, L., Long, K. S. & Turner, T. J. 2010, MNRAS, 408, 1396
- Serlemitsos, et al. (2007) Serlemitsos, P. J. et al. 2007, PASJ, 59, S9
- Takahashi et al. (2007) Takahashi, T., et al. 2007, PASJ, 59, S35
- Tanaka et al. (1995) Tanaka, Y., et al. 1995, Nature, 375, 659
- (46) Tanaka, Y., Boller, T., Gallo, L. & Keil, R. 2004, PASJ, 56, L9
- Ulrich, Maraschi & Urry (1997) Ulrich, M-H. , Maraschi, L. & Urry, C. M. 1997, ARA&A, 35, 445
- (48) Życki, P. T., Ebisawa, K., Niedzwiecki, A. & Miyakawa, T. 2010, PASJ, 62, 1185
| (1) | (2) | (3) | (4) | (5) | (6) | (7) | (8) | (9) | (10) | |
| Target | Re- | |||||||||
| log | log | log | (d.o.f) | |||||||
| Markarian 335 | 1.07 | |||||||||
| – | – | (1167) | ||||||||
| TonS 180 | 1.02 | |||||||||
| – | – | (425) | ||||||||
| 1H 0323+342 | 0.93 | |||||||||
| – | – | (498) | ||||||||
| 1H 0419–577 (1) | 1.06 | |||||||||
| – | (1280) | |||||||||
| 1H 0419–577 (2) | 1.07 | |||||||||
| – | – | (706) | ||||||||
| Arakelian 120 | 0.90 | |||||||||
| – | – | (1068) | ||||||||
| NGC 3516 | 0.98 | |||||||||
| – | (1153) | |||||||||
| NGC 3783 (1) | 0.98 | |||||||||
| – | (1561) | |||||||||
| NGC 3783 (2) | 1.08 | |||||||||
| (1789) | ||||||||||
| NGC 4051 | 1.11 | |||||||||
| – | (1666) | |||||||||
| Markarian 205 | 1.05 | |||||||||
| – | – | (425) | ||||||||
| Markarian 766 | 1.02 | |||||||||
| – | (663) | |||||||||
| (1) | (2) | (3) | (4) | (5) | (6) | (7) | (8) | (9) | (10) | |
| Target | Re- | |||||||||
| log | log | log | (d.o.f) | |||||||
| NGC 4593 | 1.04 | |||||||||
| – | – | (600) | ||||||||
| IC 4329A | 1.01 | |||||||||
| – | – | (1877) | ||||||||
| NGC 5548 | 1.05 | |||||||||
| – | (1435) | |||||||||
| 4C 74.26 | 1.05 | |||||||||
| – | – | (1007) | ||||||||
| Arakelian 564 | 0.98 | |||||||||
| – | (770) | |||||||||
| SWIFT J2127.4 | 0.94 | |||||||||
| – | – | (645) | ||||||||
| NGC 7469 | 0.93 | |||||||||
| – | (875) | |||||||||
| NGC 2992 | 1.05 | |||||||||
| – | – | (860) | ||||||||
| MCG-5-23-16 | 1.08 | |||||||||
| – | – | (1829) | ||||||||
| IRAS 18325 | 1.02 | |||||||||
| – | – | (817) | ||||||||
| ∗*∗*footnotemark: Errors correspond to 90 % confidence limits. Meaning of the tables columns are the following: (1) Target name. (2) Hydrogen column-density of the interstellar matter ( cm-2). (3) Hydrogen column density ( cm-2) and logarithm of the ionization parameter for . (4) Hydrogen column density ( cm-2) and logarithm of the ionization parameter for . (5) Normalization of the direct component (10-3 photons s-1 cm-1 keV-1 at 1 keV). (6) Normalization of the absorbed component (10-3 photons s-1 cm-1 keV-1 at 1 keV). (7) Hydrogen column-density ( cm-2) and logarithm of the ionization parameter for . (8) Photon-index of the power-law component. (9) Iron line energy (keV), intensity (10-5 photons s-1 cm-2) and equivalent-width (eV). (10) Reduced and the degree of freedom. | ||||||||||
| (1) | (2) | (3) | (4) | (5) | (6) | (7) | (8) | (9) | |
| Target | |||||||||
| Re- | |||||||||
| log | log | log | (d.o.f) | ||||||
| Markarian 335 | |||||||||
| 1.03 | |||||||||
| – | – | (1709) | |||||||
| TonS 180 | |||||||||
| 0.90 | |||||||||
| – | – | (476) | |||||||
| 1H 0323+342 | |||||||||
| 0.97 | |||||||||
| – | – | (1357) | |||||||
| 1H 0419–577 (1) | |||||||||
| 1.01 | |||||||||
| – | (1877) | ||||||||
| 1H 0419–577 (2) | |||||||||
| 1.07 | |||||||||
| – | – | (867) | |||||||
| Arakelian 120 | |||||||||
| 1.00 | |||||||||
| – | – | (1383) | |||||||
| NGC 3783 (1) | |||||||||
| 1.05 | |||||||||
| – | (2447) | ||||||||
| NGC 3783 (2) | |||||||||
| 1.04 | |||||||||
| (4417) | |||||||||
| ∗*∗*footnotemark: Errors correspond to 90 % confidence limits. Meaning of the tables columns are the following: (1) Target name. (2) Hydrogen column-density of the interstellar matter ( cm-2). (3) Hydrogen column density ( cm-2) and logarithm of the ionization parameter for . (4) Normalization of the power-law component (10-3 photons s-1 cm-1 keV-1 at 1 keV). (5) Four partial covering fractions corresponding to the four intensity-sliced spectra. (6) Common hydrogen column density ( cm-2) of the low-ionized absorber and logarithm of the ionization parameter for . (7) Hydrogen column-density ( cm-2) and logarithm of the ionization parameter for . (8) Photon-index of the power-law component. (9) Reduced and the degree of freedom. | |||||||||
| (1) | (2) | (3) | (4) | (5) | (6) | (7) | (8) | (9) | |
|---|---|---|---|---|---|---|---|---|---|
| Target | |||||||||
| Re- | |||||||||
| log | log | log | (d.o.f) | ||||||
| NGC 3516 | |||||||||
| 1.12 | |||||||||
| – | (1448) | ||||||||
| NGC 4051 | |||||||||
| 1.10 | |||||||||
| – | (4870) | ||||||||
| Markarian 205 | |||||||||
| 1.21 | |||||||||
| – | – | (479) | |||||||
| Markarian 766 | \ldelim{30.3pt[] | ||||||||
| 1.12 | 1.08 | ||||||||
| – | (812) | ||||||||
| \ldelim{11pt[] | |||||||||
| NGC 4593 | |||||||||
| 0.97 | |||||||||
| – | – | (699) | |||||||
| IC 4329A | |||||||||
| 1.04 | |||||||||
| – | – | (6262) | |||||||
| NGC 5548 | \ldelim{20.3pt[] | ||||||||
| 1.00 | |||||||||
| 1.00 | \ldelim{20.3pt[] | – | (3024) | ||||||
| (1) | (2) | (3) | (4) | (5) | (6) | (7) | (8) | (9) | |
|---|---|---|---|---|---|---|---|---|---|
| Target | |||||||||
| Re- | |||||||||
| log | log | log | (d.o.f) | ||||||
| 4C 74.26 | |||||||||
| 1.03 | |||||||||
| – | – | (1272) | |||||||
| Arakelian 564 | |||||||||
| 1.05 | |||||||||
| – | (969) | ||||||||
| SWIFT J2127.4 | |||||||||
| 1.00 | |||||||||
| – | – | (783) | |||||||
| NGC 7469 | |||||||||
| 0.93 | |||||||||
| – | (1076) | ||||||||
| NGC 2992 | |||||||||
| 1.03 | |||||||||
| – | – | (1660) | |||||||
| MCG-5-23-16 | |||||||||
| 1.09 | |||||||||
| – | – | (4692) | |||||||
| IRAS 18325 | |||||||||
| 1.09 | |||||||||
| – | – | (980) | |||||||