Peering through the Dust: NuSTAR Observations of Two FIRST-2MASS Red Quasars
Abstract
Some reddened quasars appear to be transitional objects in the merger-induced black hole growth/galaxy evolution paradigm, where a heavily obscured nucleus starts to be unveiled by powerful quasar winds evacuating the surrounding cocoon of dust and gas. Hard X-ray observations are able to peer through this gas and dust, revealing the properties of circumnuclear obscuration. Here, we present NuSTAR and XMM-Newton/Chandra observations of FIRST-2MASS selected red quasars F2M 0830+3759 and F2M 1227+3214. We find that though F2M 0830+3759 is moderately obscured ( cm-2) and F2M 1227+3214 is mildly absorbed ( cm-2) along the line-of-sight, heavier global obscuration may be present in both sources, with cm-2 and cm-2, for F2M 0830+3759 and F2M 1227+3214, respectively. F2M 0830+3759 also has an excess of soft X-ray emission below 1 keV which is well accommodated by a model where 7% of the intrinsic AGN X-ray emission is scattered into the line-of-sight. While F2M 1227+3214 has a dust-to-gas ratio (/) consistent with the Galactic value, the / value for F2M 0830+3759 is lower than the Galactic standard, consistent with the paradigm that the dust resides on galactic scales while the X-ray reprocessing gas originates within the dust-sublimation zone of the broad-line-region. The X-ray and 6.1m luminosities of these red quasars are consistent with the empirical relations derived for high-luminosity, unobscured quasars, extending the parameter space of obscured AGN previously observed by NuSTAR to higher luminosities.
1 Introduction
Supermassive black holes (SMBHs) reside at the center of almost every massive galaxy. There, these objects can grow by accretion and be observed as active galactic nuclei (AGN). In addition to being among the most energetic sources in the Universe, AGN may also play a key role in the evolution of the galaxies in which they live (e.g., Kormendy & Ho, 2013; Alexander & Hickox, 2012; Heckman & Best, 2014). SMBH mass is correlated with galaxy mass (e.g., Ferrarese & Merritt, 2000; Gebhardt et al., 2000; Graham & Scott, 2013), suggesting common physical processes that link the life cycles of both systems. Additionally, theoretical simulations invoke feedback from thermal and/or kinetic energy associated with black hole accretion to match observed galaxy properties (e.g., Scannapieco et al., 2012). One mechanism that triggers SMBH fueling and concurrent galaxy growth is major galaxy mergers, where the nucleus is predicted to be enshrouded by large amounts of dust and gas before powerful AGN winds expel this obscuring material (e.g., Sanders et al., 1988; Hopkins et al., 2005), unveiling the typical unobscured AGN identified by optical surveys such as the Sloan Digital Sky Survey (SDSS, York et al., 2000; Schneider et al., 2002). However, the phase where AGN feedback heats gas within the host galaxy, thereby regulating star formation, is expected to be short-lived, on the order of several hundred million years (e.g., Hopkins et al., 2008; Glikman et al., 2012), meaning that such objects are rare.
Though these transitional AGN occupy a low space density in the Universe (e.g., deg-2 to a = 14.5 magnitude (AB) limit; Glikman et al., 2012), they provide a unique opportunity to study SMBH and galaxy co-evolution in action. Among the best candidates for these systems are “red quasars” which are a class of obscured AGN quite different from the type described by the unification model (Antonucci, 1993; Urry & Padovani, 1995; Netzer, 2015). Unlike the Type 2 AGN explained by unification, which are identified by having only narrow emission lines in their optical spectra, red quasars, as defined by Glikman et al. (2004), have broad emission lines akin to Type 1 to Type 1.9 AGN. However, they have large amounts of dust that attenuate optical emission and reddens their spectra, making them difficult to identify based on optical-only diagnostics. These AGN are thus discovered by their red optical to infrared colors (i.e., either , , , , or (24m)/; Glikman et al., 2004, 2007; Brusa et al., 2005, 2010; Hickox et al., 2007; Fiore et al., 2008, 2009) and/or red infrared colors (i.e., , 111 and refer to the WISE passbands at 3.4m and 4.6m, respectively. We note that such color selections described above do not exlusively identify broad-lined AGN, but also select narrow-lined AGN or those lacking any emission lines.; Glikman et al., 2004; Banerji et al., 2012; Stern et al., 2012; Assef et al., 2013). WISE has also identified a population of “hot, dust-obscured galaxies” (Hot DOGs), which, with infrared luminosities exceeding 1013 , may be the most luminous AGN in the Universe (Assef et al., 2015; Tsai et al., 2015).222WISE Hot DOGs are selected by having very red WISE colors, i.e. strong detections in the (12m) and (22m) bands with faint or non-detections in and . These sources include both narrow-lined and broad-lined AGN.
Additional multi-wavelength constraints, such as detections in the radio (Glikman et al., 2004, 2007, 2012, 2013) and high X-ray to optical fluxes (Brusa et al., 2010), are sometimes invoked in identifying red quasar candidates to mitigate contamination from dusty star-forming galaxies or stars. Such multi-wavelength diagnostics have revealed sources which appear to be in a transitional stage between galaxy coalesence and evacuation. For instance, galactic-scale outflows have been detected in red quasars initially discovered on the basis of their X-ray, optical, and infrared properties (Brusa et al., 2007, 2015). Radio observations of 2MASS-selected reddened quasars have revealed young radio jets, suggesting that they are in the early stages of black hole growth where the expansion of radio lobes can impart feedback onto the host galaxy (Georgakakis et al., 2012). Optical to far-infrared photometry of a sample of reddened quasars show evidence of outflows that can inhibit host-galaxy star formation (Farrah et al., 2012). Hubble imaging of red quasars presented by Glikman et al. (2004), found by cross-correlating the FIRST and 2MASS surveys, shows that they have “train-wreck” morphological traits indicative of merger activity (Urrutia et al., 2008; Glikman et al., 2015). After correcting for extinction, these FIRST-2MASS red quasars are among the most luminous AGN at every redshift (Glikman et al., 2012; Banerji et al., 2015), similar to the Hot DOGs discovered by WISE (Assef et al., 2015; Tsai et al., 2015).
Though reddened AGN have been identified in X-ray surveys (e.g., Hickox et al., 2007; Fiore et al., 2008, 2009; Brusa et al., 2010), there are few studies of targeted X-ray follow-up of infrared-selected red quasar samples (e.g., Brusa et al., 2005). While most of these targeted red quasars are detected in X-rays, very few have an adequate number of observed photons to enable characterization of their X-ray properties. For instance, Wilkes et al. (2002) studied a sample of 26 2MASS-selected reddened AGN with Chandra, but due to the short exposure times (1 - 4.5 ks), analysis of the X-ray obscuration was limited to hardness ratios333, where represents the number of counts in the hard band and is the number of counts in the soft band, which in Wilkes et al. (2002) are the 2.5 - 8 keV and 0.5 - 2 keV bands, respectively. since insufficient counts were detected for a proper spectral-fitting analysis. Wilkes et al. (2005) followed-up five of these AGN with XMM-Newton, two of which were narrow-lined objects and three of which were broad-lined AGN, and detected hundreds to over a thousand counts, enabling spectral fitting that better reveal their X-ray properties. They found three objects to have moderate X-ray absorption ( cm-2), as well as a “soft excess” component below 2 keV in the three broad-lined AGN, which they attributed to emission from extended ionized gas.
Unlike the 2MASS-selected reddened AGN, which tend to be lower luminosity sources at a median redshift of 0.23 and include many Type 2 objects (Cutri et al., 2002), FIRST-2MASS red quasars are Type 1 AGN at much higher luminosities (Glikman et al., 2004, 2007; Brusa et al., 2005; Banerji et al., 2012, 2015), and there is mounting evidence that their reddening is largely due to host galaxy dust related to merger activity (e.g., Urrutia et al., 2008; Glikman et al., 2015). Urrutia et al. (2005) presented the first X-ray analysis of FIRST-2MASS red quasars. Similar to the study from Wilkes et al. (2002), 11 of the 12 objects targeted by Chandra were detected, but only six had enough counts for a crude spectral fit. One of these objects, F2M 0830+3759, was followed-up with XMM-Newton for 50 ks by Piconcelli et al. (2010), where they obtained a significantly flatter spectral index than reported by Urrutia et al. (2005) ( versus ), indicating that the properties derived from the shorter X-ray exposures may reflect limited signal-to-noise in the spectra rather than trace intrinsic physical processes of the quasars. Interestingly, Piconcelli et al. (2010) report a soft-excess below 1 keV, similar to what is reported by Wilkes et al. (2005) in their three broad-lined AGN observed by XMM-Newton.
Since these studies have been published, substantial improvements in tools used for the X-ray modeling of obscured AGN have become available. In particular, the Murphy & Yaqoob (2009) MYTorus model, the Ikeda et al. (2009) torus model, the spherical and toroidal absorption models of Brightman & Nandra (2011, BNTorus), and the Liu & Li (2014) clumpy torus model self-consisently account for the transmitted, Compton-scattered, and Fe fluorescent line emission through an obscuring medium with column densities ranging from moderate ( cm-2) to extremely Compton-thick ( cm-2 for the BNTorus model, and cm-2 for the remaining models). However, only the BNTorus and MYTorus models are publicly available. The latter model has the capability to emulate a patchy obscuring medium, where the line-of-sight and global column densities are independent parameters. This mode may be of particular relevance to red quasars where presumably the accretion disk is viewed directly (allowing broad lines in the optical and/or infrared spectra to be observed), while large amounts of obscuring gas may be present out of the line-of-sight (see Figure 2 in Yaqoob, 2012). Such physically motivated models allow a more reliable estimate of the gas column density to be calculated, as well as the obscuring geometry to be constrained, compared to the phenomenological absorbed power law models used in previous studies.
Here, we use NuSTAR (Harrison et al., 2013) and archival Chandra and XMM-Newton observations to study the broad-band X-ray properties of two FIRST-2MASS selected red quasars from the sample reported in Glikman et al. (2012): F2M 0830+3759 and F2M 1227+3214. Of the fourteen FIRST-2MASS red quasars observed to date in X-rays (Urrutia et al., 2005; Evans et al., 2010), these 2 sources are the nearest and have X-ray count rates that indicated they would be bright enough to ensure detection of counts in the NuSTAR bandpass with a relatively short exposure time. We calculated the 444, where and are the monochromatic luminosites (erg s-1 Hz-1) at 2 keV and 12m, respectively, in the rest-frame (e.g. Gandhi et al., 2009). values for the FIRST-2MASS sources that have existing X-ray information, assuming a powerlaw spectrum where for all sources to derive the monochromatic 2 keV luminosity, and calculated reddening-corrected 12m monochromatic luminosities from the optical and infrared spectra. F2M 0830+3759 and F2M 1227+3214 have the highest values, indicating that they are stronger in X-rays compared to the other FIRST-2MASS sources yet studied.
We modeled the X-ray spectra for F2M 0830+3759 and F2M 1227+3214 over the energy range 0.5-79 keV, where the high energy coverage of NuSTAR is essential for obtaining the best constraints on the X-ray obscuration, the intrinsic X-ray continuum, and the geometry of the X-ray reprocessor. In addition to assessing the X-ray obscuring medium and how it relates to the optical reddening, we compare the observed X-ray luminosities with the infrared 6.1m luminosities, placing these objects in context with other obscured AGN studied by NuSTAR. Throughout, we adopt a cosmology of = 70 km s-1 Mpc-1, and , and use AB magnitudes.
2 Multi-wavelength Observations
2.1 Optical and Infrared Properties of F2M 0830+3759 and F2M 1227+3214
F2M 0830+3759 and F2M1227+3214 were selected by the FIRST-2MASS survey, which required them to be detected independently in the FIRST and 2MASS surveys, within a 2′′ search radius, effectively restricting the sample to sources with strong core radio emission. Objects also had to pass optical to near-infrared colors cuts of and , where and come from the 2MASS survey (Skrutskie et al., 2006) while the magnitude comes from the Guide Star Catalog II (GSCII; Lasker et al., 2008) which is produced by digitizing the second-generation Palomar Observatory and UK Schmidt sky surveys (POSS-II; Reid et al., 1991). The resultant sample contained 120 quasars with , reaching reddenings as high as . The sample’s redshift range extends from to .
Both F2M 0830+3759 and F2M 1227+3214 appear in the spectral atlas of Glikman et al. (2012) with optical spectra from the Keck and Lick observatories, respectively, dating back to 2001 and 1998, respectively. Since then, F2M 1227+3214 had been observed by SDSS with a spectrum that extends to longer wavelength. We obtained a near-infrared spectrum of this source on UT 2015 March 13 at the Apache Point Observatory 3.5m telescope with the TripleSpec cross-dispersed near-infrared spectrograph (Wilson et al., 2004). The quasar was exposed for 16 minutes using an ABBA dither pattern along the slit followed by an observation of an A0V telluric standard. The data were reduced using the Spextool software following the procedude described in Cushing et al. (2004) and Vacca et al. (2003).
We plot the spectra of both sources in Figure 1, showing the optical spectrum of F2M 0830+3759 in the top panel, and the newly combined optical-through-near-infrared spectrum of F2M 1227+3214 in the lower panel. We plot both spectra on a log-log scale to enhance the appearance of features over the broad wavelength and flux ranges apparent in these spectra. Vertical dashed lines mark the location of prominent AGN lines, namely Pa, Pa, Pa, H, [O III] 5007Å, H and [O II] 3727Å. Both quasars also show strong emission from [Ne III] at 3869Å and 3967Å.
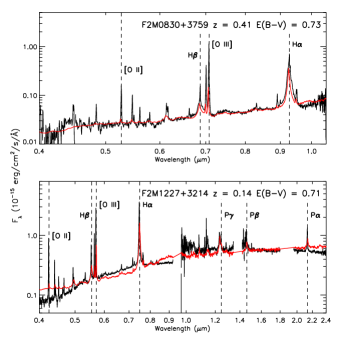
To determine the reddening of these sources, we fit the optical-to-near-infrared quasar template of Glikman et al. (2006) attenuated by a Small Magellanic Cloud (SMC) dust law following the procedure described in Section 5 of Glikman et al. (2012). Figure 1 shows the best-fit reddened template plotted atop the data (red line). We recover the same value for F2M 0830+3759 as reported in Glikman et al. (2012), which appears well-fit by this model. However, the added near-infrared spectrum of F2M 1227+3214 lowers our measured from the Glikman et al. (2012) value of 0.94 mag to 0.71 mag. The reddening law produces a poorer fit to this system, especially at the shortest wavelengths, suggesting that the new reddening value may be an underestimate (see Glikman et al., 2012, for a discussion of different reddening laws applied to F2M red quasars, where the SMC law returns the best fit for these sources).
In addition to the optical and near-infrared (in the case of F2M 1227+3214) spectroscopy, we also utilize photometric data from the optical, via SDSS, through the near-infrared, via 2MASS, to the mid-infrared, via WISE (F2M 0830+3759 was also observed with Spitzer and analyzed independently by Urrutia et al., 2012). These data provide at least a dozen photometric data points which we use to model the spectral energy distribution (SED) using the Cigale SED fitting code (Noll et al., 2009; Serra et al., 2011). Figure 2 shows the resultant SED fits at rest-frame wavelengths with photometric data overplotted. The SED model includes components for a star formation history with a double decreasing exponential function, Draine & Li (2007) dust emission, and Fritz et al. (2006) AGN-heated dust emission.
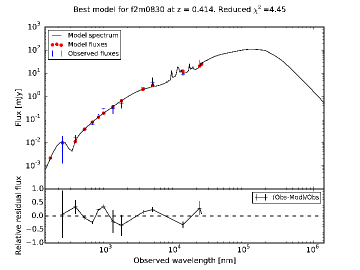
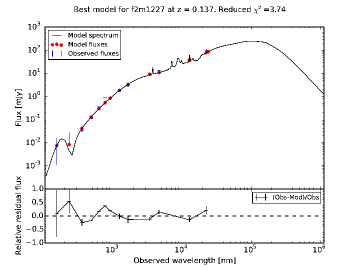
To estimate the bolometric luminosities of these quasars, we integrate under the model between 3500Å and 400m; reddening attenuates the ultraviolet emission at lower wavelengths which is then reprocessed into infrared emission which we measure here. We find luminosities of erg s-1 for F2M 0830+3759 and erg s-1 for F2M 1227+3214. Since most of the energy is attributed to the dust emission at wavelengths beyond m, where we do not have data to constrain the model, we also compute a conservative lower limit to the luminosities of these quasars by integrating only out to m. Our conservative limits for the luminosities are erg s-1 for F2M 0830+3759 and erg s-1 for F2M 1227+3214. We summarize the reddening values and bolometric luminosities calculated here, as well as the rest-frame, non-absorption corrected 6.1m luminosities () derived from the SED modeling in Table 1.
| Source | R.A. | Decl. | z | Log () | Log () | Log ()1 | |
|---|---|---|---|---|---|---|---|
| (erg s-1 Hz-1) | (erg s-1) | (erg s-1) | |||||
| F2M 0830+3759 | 08 30 11.12 | +37 59 51.8 | 0.41 | 0.73 | 31.60 | 45.10 | 45.59 |
| F2M 1227+3214 | 12 27 49.15 | +32 14 59.0 | 0.14 | 0.71 | 30.53 | 44.60 | 45.12 |
| 1Bolometric luminosities are calculated from integrating the model SED fit between 3500Å and 24m, | |||||||
| i.e., corresponding to the conservative value quoted in the text. | |||||||
| Source | NuSTAR Observations | Archival Observations | |||
|---|---|---|---|---|---|
| ObsID | Date | Observatory | ObsID | Date | |
| F2M 0830+3759 | 60001109002 | 2014 Sep | XMM-Newton | 0554540201 | 2008 Nov |
| F2M 1227+3214 | 60001108002 | 2014 Jul | Chandra | 4138 | 2003 Apr |
2.2 Radio Properties
Though these quasars were selected from the FIRST survey, they are not necessarily radio loud objects. Before calculating radio loudness ( = log(/)), the optical emission in -band is corrected for extinction using the measured values. Following Ivezić et al. (2002), Glikman et al. (2007) calculated radio loudness using:
| (1) |
where is the extinction-corrected -band magnitude and is the FIRST flux density (log(/3631 Jy)). We find that = 1.14 and 0.7 for F2M 0830+3759 and F2M 1227+3214, respectively. While the latter source is radio quiet (), F2M 0830+3759 is considered radio-intermediate (; Miller et al., 2011). Miller et al. (2011) demonstrated that radio-intermediate quasars often have an excess of X-ray emission compared to radio-quiet quasars, with the amount of excess ranging from slight to as high as a factor of several. This enhanced X-ray brightness, putatively from jet-linked emission, becomes more pronounced on average for the radio-loud quasar population.
VLA data exist for F2M 0830+3759, which has a measured radio spectral index (, ) of -1.06 (Glikman et al., 2007). This is steeper than observed in flat-spectrum objects, where , which are interpreted as having radio-jets beamed in the direction along the line-of-sight. We can therefore assume that any jet-associated emission does not directly intersect our line-of-sight. However, as F2M 0830+3759 and F2M 1227+3214 are stronger in X-rays compared with the red quasars observed thus far, there can be a boost to the X-ray emission from a jet-linked contribution.
2.3 NuSTAR
NuSTAR, launched in 2012 June, is the first focusing hard X-ray telescope above 10 keV in orbit, sensitive to energies between 3 to 79 keV (Harrison et al., 2013). It consists of two co-aligned mirror modules which focus hard X-rays onto two Focal Plane Modules, FPMA and FPMB. With a field-of-view of , NuSTAR has an angular resolution of 18′′ (FWHM). Due to its high-energy sensitivity, it is an ideal instrument for studying obscured AGN as it recovers X-ray emission that is attenuated at lower energies.
The details of the X-ray observations for F2M 0830+3759 and F2M 1227+3214 are summarized in Table 2. F2M 0830+3759 was observed with NuSTAR for 22 ks on UT 2014 September 19 (ObsID: 60001109002), while F2M 1227+3214 was observed for 23 ks on UT 2014 July 31 (ObsID: 60001108002). Data were reduced with nupipeline, which is part of the NuSTAR Data Analysis Software NuSTARDAS v.1.4.1, CALDB v.20140814 (Perri et al. 2013).555http://heasarc.gsfc.nasa.gov/docs/nustar/analysis/nustar_swguide.pdf The spectra were extracted from a circular region 40′′ in radius around the source from both the FPMA and FPMB detectors. This radius was chosen to be large enough to encompass emission from the quasar whilst being small enough to minimize background photons. The background spectra were extracted from annuli with inner radii of 90′′ and outer radii of 240′′, centered on the quasar; no serendipitous sources are detected in these background regions. These spectra were grouped by 20 counts per bin, with 116934 net counts detected in F2M 0830+3759 and 108233 net counts detected in F2M 1227+3214. We note that as neither of these sources were detected by Swift BAT (Baumgartner et al., 2013), these data represent the first observations of these quasars above 10 keV.
2.4 XMM-Newton: F2M 0830+3759
XMM-Newton observed F2M 0830+3759 for 52 ks in 2008 November (PI: Piconcelli, ObsID: 0554540201; Piconcelli et al., 2010). Though it was also observed with Chandra for 9 ks (Urrutia et al., 2005), we use only the XMM-Newton data due to the superior signal-to-noise from the longer observation. The data were reduced with the XMM-Newton Science Analysis System (SAS) package using HEASOFT v.6.16 to apply standard filtering to the events file and remove time intervals with background flaring. We extracted spectra from a 35′′ aperture radius centered on the source for all three XMM-Newton detectors (PN, MOS1, and MOS2). For the MOS observations, we extracted the background region from an annulus around the source, free of serendipitous sources, with an inner radius of 45′′ and outer radius of 100′′. Since the object was close to the chip gap in the PN dector, the background here was instead extracted from several source-free circular regions near the quasar. About 7000 net counts were detected by PN and 2700 counts by each of the MOS detectors. The MOS spectra were grouped such that each bin contains at least 20 counts, while the superior sensitivity of PN allowed us to group the data such that each bin contains at least 50 counts.
2.5 Chandra: F2M 1227+3214
F2M 1227+3214 was targeted with Chandra ACIS-I (Garmire et al., 2003) on 2003 April 30 for 3.7 ks (PI: Laurent-Muehleisen, ObsID: 4183), though this work represents the first time results from these data are published other than in the Chandra Source Catalog (Evans et al., 2010). We processed the data with the CIAO v4.5, with CALDB v4.5.5.1 (Fruscione et al., 2006), using the chandra_repro task to produce a filtered events file, removing periods of anomalously high background. Due to Chandra’s superior angular resolution, the source spectrum was extracted using a 5′′ radius aperture around the object using the CIAO tool specextract, with the background extracted from an annulus around the quasar with inner radius 10′′ and outer radius 30′′. The spectrum was grouped by a minimum of 15 counts per bin, with a total of 83429 net counts detected.
3 Spectral Analysis
We simultaneously fit the NuSTAR spectra (3-79 keV) and the archival X-ray spectra (0.5-8 keV for Chandra, 0.5-10 keV for XMM-Newton) using XSpec v12.8.2 (Arnaud, 1996), where the background is automatically subtracted. A constant factor was included in the modeling to account for calibration differences between NuSTAR and Chandra, and NuSTAR and XMM-Newton. For F2M 0830+3759, we find that the ratio between the FPMA (FPMB) normalization and the XMM-Newton PN detector is (), which is higher than the () cross-calibration difference reported in Madsen et al. (2015). The ratio between the FPMA (FPMB) and Chandra normalizations for F2M 1227+3214 is (), which is consistent within the uncertainties of the values reported between NuSTAR and Chandra grating spectroscopy in Madsen et al. (2015).666Cross-calibration between NuSTAR and ACIS CCD spectroscopy is not performed in Madsen et al. (2015). The larger differences in the relative normalizations between detectors than those presented in Madsen et al. (2015) in F2M 0830+3759 could be induced by uncertainties from the lower signal-to-noise in our spectra, compared with the bright calibration sources studied in Madsen et al. (2015). Indeed, past studies using joint spectral fitting of NuSTAR with XMM-Newton show similar cross-calibrational uncertainties to those we find here (e.g., Baloković et al., 2014). Additionally, AGN variability can play a role in the cross-calibrational differences. We tested this by including the 9 ks Chandra spectrum in the joint fitting, finding the cross-calibration constant for Chandra relative to XMM-Newton (1.48+/-0.09) to be more consistent with that found between NuSTAR and XMM-Newton, suggesting that the source varies over time and was fainter during the epoch of the XMM-Newton observation, perhaps due to the direct emission that is scattered into our line-of-sight (see below for details). Errors on the spectral fit parameters are quoted at the 90% confidence interval, corresponding to a of 2.7 for one interesting parameter.
3.1 F2M 0830+3759
We initially fit the NuSTAR and XMM-Newton spectra with an absorbed power law model, with an absorption component fixed to the Galactic value (= cm-2; Kalberla et al., 2005) and an additional component at the redshift of the quasar which was left free () :
| (2) |
where is the normalization of the power-law, is the photoelectric cross-section, and the constant factor accounts for cross-calibration differences between XMM-Newton PN, MOS1 and MOS2 detectors and the NuSTAR FPMA and FPMB modules. Here, the absorption is modeled as a foreground screen of extinction. We note that though we write the equation in the rest-frame, we used XSpec model components zphabs and zpowerlaw here and below, where applicable, to appropriately account for redshift dependencies when modeling the observed-frame spectra and calculating flux.
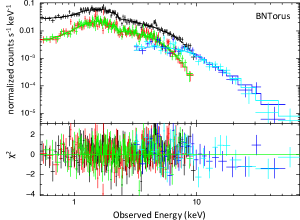
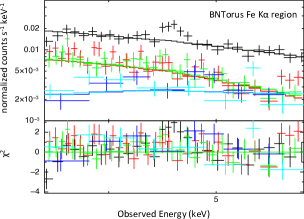
This simple phenomenological model indicates at least moderate absorption ( cm-2). Additionally, 6.4 keV (rest-frame) Fe K emission is also clearly evident, which is a signature of X-rays reflecting off either distant matter or the accretion disk (e.g., Krolik & Kallman, 1987; George & Fabian, 1991; Shu et al., 2011; Ricci et al., 2014). We therefore fitted these spectra with physically motivated models that self-consistently account for the effects of photoelectric absorption, Compton scattering, and Fe K fluorescence emission in the presence of moderate ( cm-2) to Compton-thick ( cm-2) column densities. We model the intrinsic spectrum as a powerlaw, which is then modified by absorption and Compton scattering. Both the Brightman & Nandra (2011) BNTorus and Murphy & Yaqoob (2009) MYTorus models realize these physical processes through a suite of Monte-Carlo simulations, producing pre-defined tables for input spectra with a range of physical parameters that are imported into XSpec for spectral fitting; such “look-up” tables allow the spectra to be fitted without having to integrate Monte Carlo results while modeling the spectra, which would result in impractical run times. MYTorus restricts the opening angle to 60∘ and fixes the Fe abundance to solar, while the BNTorus model allows the opening angle and Fe abundances to be free parameters; in both models, the inclination angle of the torus () can range from 0∘ (face-on) to 90∘ (edge-on), with the boundary between a face-on and edge-on geometry at 60∘ for MYTorus while this boundary between edge- and face-on depends on the torus opening angle in the BNTorus model.
We note that Liu & Li (2015) simulated X-ray torus reprocessing for Compton-thick column densities (1024-1025 cm-2) for the geometries assumed by MYTorus and BNTorus in an attempt to reproduce the reported spectra of these models. They found that the latter model over-predicted the reflection component at low energies and over-predicted the Fe K equivalent width for edge-on geometries relative to their calculations, while their results were fully consistent with the MYTorus model. However, Brightman et al. (2015) simulated spectra in the energy range 3-79 keV with the BNTorus model for various torus opening angles and values of . As they find that the MYTorus model fit to these simulated spectra recovers the input parameters for the case where the BNTorus model opening angle is 60∘, we include this model in the analysis below for completeness, freezing the opening angle to 60∘.
Soft excess emission is present in F2M 0830+3759 below 1 keV, which we attribute to AGN emission that “leaks” through the obscuring medium, either through the opening of the torus or holes in a clumpy obscuring medium, and either directly enters our line-of-sight or is subsequently scattered off a distant optically thin medium before transversing our line-of-sight. If such emission resulted from photons scattered by the torus itself, we would see signatures of this process in the reflected or transmitted spectrum, but modeling the spectra with just these processes fails to fit the soft emission. We therefore include a scattered powerlaw to our model to account for this component, similar to partial covering models used in previous works with phenemenological modeling (e.g., Winter et al., 2009; Turner & Miller, 2009; LaMassa et al., 2009, 2011; Mayo & Lawrence, 2013).
The BNTorus model can be represented as:
| (3) |
where the BNTorus component depends on the equatorial column density (), the opening angle of the torus (), the inclination angle of the torus (), and energy () since the probability that a photon will undergo Compton-scattering depends on its incident energy. To preserve the self-consistency of the model, the powerlaw slope () and normalization () of the scattered emission are tied to the BNTorus values, with a constant multiplicative factor left free to measure the scattering fraction. The absorption due to the Galaxy (= cm-2; Kalberla et al., 2005) is kept frozen. The first contant factor accounts for cross-calibration differences among the XMM-Newton PN, MOS1, and MOS2 detectors and the NuSTAR FPMA and FPMB detectors.
The MYTorus model instead has separate components for the transmitted, Compton-scattered, and fluorescent line emission:
| (4) |
where
-
•
MYTorusZ is the component that modifies the transmitted spectrum, where we used the MYTorus multiplicative table mytorus_Ezero_v00.fits,
-
•
MYTorusS describes the Compton-scattered emission, where we have used the Monte-Carlo realization with a powerlaw termination energy of 200 keV (i.e., MYTorus table
mytorus_scatteredH200_v00.fits)777As we work within an energy range far below the cut-off energy, the choice of MYTorus termination energy, which can range from 100-500 keV, has a small impact on our results and -
•
MYTorusL (mytl_V000010nEp000H200_v00.fits) accounts for fluorescent line emission.
All of these MYTorus components have a dependence on column density, inclination angle, energy, and redshift. To preserve the physical self-consistency, the powerlaw normalization and slope are tied together among the MYTorus components and scattering model during the fitting; and the column densities ( and ) are also tied among the MYTorus components. These constraints are required by the definition of the MYTorus model and input tables. The relative normalizations between the Compton-scattered emission () and the fluorescent line emission () are tied to each other and is allowed to be free (see e.g., Murphy & Yaqoob, 2009; Yaqoob, 2012; LaMassa et al., 2014).
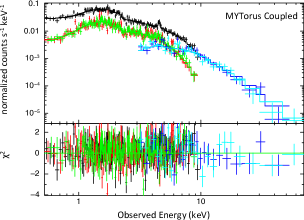
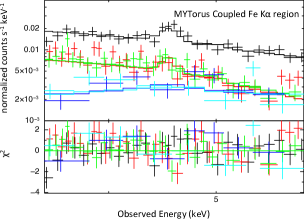
Both models provide a good global fit to the spectra (Figure 3, left), though the MYTorus model does a much better job of fitting the Fe K complex than the BNTorus model (Figure 3, right). However, the fitted inclination angles suggest that complexities exist in the X-ray reprocessor that are not accounted for in the presumed geometry of the models. While is largely unconstrained in the BNTorus model fit (i.e., 62.5∘), due to the column density being independent of inclination angle in this model, it has a very narrow allowed range in the MYTorus fit (60.1 60.8∘), indicating a grazing incidence angle between the AGN continuum and the obscuring medium. This latter result indicates that the model is attempting to reconcile the competing effects of a strong reflection component, producing the Fe K line, and a weakly absorbed transmitted continuum. These effects could result from multiple absorption components at physically different locations, suggesting that the X-ray reprocessor might not be a homogenous medium, or that a gradient in column density exists over the X-ray reprocessor such that the integrated emission provides a significantly different column density than that viewed along the line-of-sight.
| Source | 11 represents the line-of-sight obscuration, while denotes the global column density. | (DOF) | ||||
|---|---|---|---|---|---|---|
| (1022 cm-2) | (1024 cm-2) | |||||
| F2M 0830+3759 | 1.66 | 2.1 | 2.1 | 0.37 | 0.07 | 445.6 (432) |
| F2M 1227+3214 | 1.99 | 0.34 | 122The normalization was frozen to unity during the fitting since it was unconstrained when left free. | 0.55 | 92.3 (95) |
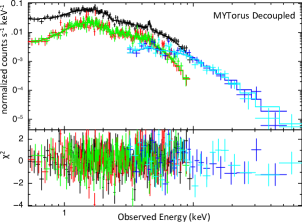
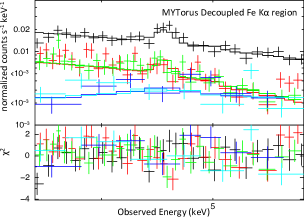
We therefore fitted these spectra with MYTorus in “decoupled” mode, where the line-of-sight and global column densities are allowed to be distinct from each other and fit independently, consistent with a patchy obscuring medium. Here, a portion of the observed X-ray emission results from X-ray reflection off of the far-side of the obscuring medium that enters the line-of-sight without further interaction with the absorber. In this case, the global column density () associated with this far-side reflection has an inclination angle frozen to 0∘ since it emulates the physics of a face-on torus. Conversely, is fixed at 90∘ for the line-of-sight column density () since this describes the absorption that reprocesses the transmitted component. Unlike the coupled mode, the column densities are fit independently, where is tied together between the MYTorusS and MYTorusL components. Again, the powerlaw parameters and relative normalizations ( and ) are tied together and is allowed to be free. We note that the fixed covering factor assumed in the MYTorus model does not greatly impact the derived column density values for covering factors below 0.8: the reflection spectrum for a face-on torus (i.e., the component associated with a 0∘ inclination angle) remains constant until the inclination angle intercepts the edge of the torus, or when the opening angle of the torus becomes narrow. As the covering factor approaches unity, the spectrum would best be described by, e.g., the spherical absorption model of Brightman & Nandra (2011).
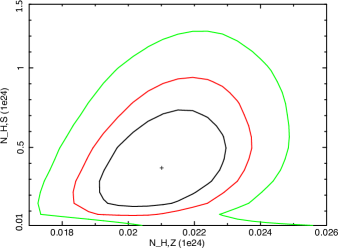
The decoupled MYTorus fit to the observed spectrum, with a close-up of the Fe K region, is shown in Figure 4. As summarized in Table 3, the line-of-sight absorption is moderate ( cm-2) while the global column density is much higher, though not Compton-thick within the 90% confidence level ( cm-2). We illustrate this further in Figure 5, where we show contour plots between the line-of-sight and global column densities. At the 68% and 90% confidence level, the colum densities are different, though future observations would be needed to improve the significance to the 99% confidence interval. We found that the higher energy coverage of NuSTAR plays a critical role in determining the global column density as the upper limit on is unconstrained with only the XMM-Newton data, as we discuss in more detail below. We note that the global column density does not necessarily mean that this obscuration is on galactic-sized scales. Rather, this absorption represents gas near the black hole that plays a role in reprocessing the AGN emission, but does not intersect the direct view to the central engine.
Finally, we find that 7% of the intrinsic AGN continuum “leaks” through the patchy obscuring medium and is subsequently scattered into our line-of-sight. When modeling this soft excess emission with a thermal component (the apec model in XSpec), which would be appropriate if this emission is due to star-formation, instead of a scattered powerlaw model, we find that in order to find a good fit to the data (=472.2 for 431 DOF), becomes largely unconstrained, with an unphysical nominal value (), suggesting that scattered AGN light is the more likely source of this emission.
As noted above, there could be an enhancement of X-ray emission due to putative jet-linked radiation which could contribute to the light which we have interpreted as being due to leakage of the intrinsic AGN continuum through the circumnuclear medium or could dilute the Fe K line and reflection component, thereby affecting the line-of-sight column measurement. Our data, however, are not of high enough quality to determine whether this possible contamination exists and could be disentangled from the remaining X-ray emission.
3.1.1 Comparison with Previous X-ray Analysis
F2M 0830+3759 was first observed in X-rays with Chandra with an exposure time of 9 ks (Urrutia et al., 2005). The Fe K line was detected in this observation and was assumed to be a Doppler broadened line, where they find a line width of keV. They also obtain a much steeper photon index () than we find here and steeper than found by Piconcelli et al. (2010) in their re-analysis of the F2M 0830+3759 Chandra spectrum ().
Piconcelli et al. (2010) reported the 50 ks XMM-Newton observation of F2M 0830+3759, which resulted in a much higher quality spectrum than previously available. They fitted the soft-excess below 1 keV in a similar way as reported here, albeit with phenomenological modeling instead of the physically motivated BNTorus (Brightman & Nandra, 2011) and MYTorus (Murphy & Yaqoob, 2009) models since they were unavailable at the time. To accommodate the soft-excess, they included an additional power law component with the same photon index as the intrinsic continuum, finding a best-fit of 1.510.06 and = 0.130.02. Though they find a good statistical fit to the spectrum with this model, they note that a marginally better fit is obtained when fitting a photoionized absorber model with XSTAR888In this model, the absorption is dependent on the ionization parameter, which is defined by , where is the luminosity of the ionizing source, is the plasma density, and is the radial distance between the source and the absorber. (Kallman & Bautista, 2001). In both cases, this absorption is along the line-of-sight and the soft-excess likely results from distant scattering of the intrinsic AGN continuum that leaks through openings in the absorbing medium. Piconcelli et al. (2010) do not interpret the Fe K line to be Doppler broadened. They calculate a rest-frame Fe K EW of 16860 eV, which is similar to the value we obtain (169 eV). Here, we are able to extend the Piconcelli et al. (2010) analysis further, inferring both the line-of-sight and global column densities, and relaxing the inherent assumption of infinite column density in the pexrav reflection model they used.
3.2 F2M 1227+3214
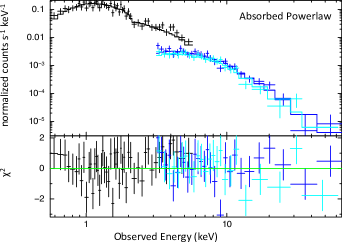
We fitted the Chandra and NuSTAR data for this source using an absorbed power-law model as parameterized in Equation 2. Here, the Galactic absorption is cm-2 (Kalberla et al., 2005). As shown in Figure 6, this simple model provides a good fit to the data, and is typical of a Type 1 AGN spectrum, with =1.99 (e.g., Mainieri et al., 2002; Lanzuisi et al., 2013) and a mild absorption along the line-of-sight of =3.4 cm-2.
To test whether there may be higher global obscuration out of the line-of-sight, we fit the spectra of F2M 1227+3214 with MYTorus in decoupled mode. Here, we replaced the MYTorusZ component, which modifies the zeroth-order transmitted continuum, with zphabs zpowerlaw since the line-of-sight column density is lower than that capable of being modeled with MYTorus ( cm-2). This replacement is justified since Compton-scattering has a negligible impact on the shape of the transmitted spectrum for line-of-sight column densities under 1022 cm-2. Fitting the spectra with MYTorusZ causes the model to underpredict the observed emission at energies 2 keV due the minimum attenuation for the model being too high compared with the observed spectrum. Similar to the decoupled mode MYTorus set-up, the inclination angle of the MYTorusS and MYTorusL components is frozen at 0∘. From this fitting, we derive a 90% confidence level upper limit on the global column density of cm-2. The fit parameters from this modeling are summarized in Table 3.
| Source | Counts | Counts | |||
|---|---|---|---|---|---|
| Chandra/XMM-Newton | NuSTAR | ||||
| F2M 0830+3759 | 12433112 | 116934 | 0.95 | 1.78 | 2.90 |
| F2M 1227+3214 | 83429 | 108233 | 1.30 | 1.10 | 2.33 |
| Source | |||
|---|---|---|---|
| F2M 0830+3759 | 44.840.06 | 45.110.06 | 45.350.06 |
| F2M 1227+3214 | 43.850.06 | 43.790.06 | 44.120.06 |
3.2.1 Effects of Variability
As the NuSTAR observations are non-contemporaneous with the archival XMM-Newton and Chandra observations, variability could affect our spectral modeling and the derived column density and absorption-corrected luminosity values. Here we explore the extent of such possible effects by fitting the spectra from the lower energy and higher energy observations independently to determine whether the results are inconsistent with those found from joint fitting.
When we apply the coupled MYTorus model to the XMM-Newton spectra of F2M 0830+3759, we find similar results from the joint fitting, where the inclination of the reprocessor is constrained to be at a grazing incidence angle. Conversely, the fit to the NuSTAR-only spectra results in an inclination angle that is completely unconstrained. We then fit these spectra independently with the MYTorus model in decoupled mode and find that the global column density is unconstrained in both cases. The measured line-of-sight column density is 2.0 cm-2 when modeling the XMM-Newton only spectra while it has a much larger allowed range when fitting just the NuSTAR spectra ( cm-2). Though there is a wide range of allowed column density values, the results from this independent modeling do not contradict the values we derive when fitting the spectra jointly.
For F2M 1227+3214, we applied the modified MYTorus decoupled model discussed above, where the MYTorusZ component was replaced with an absorbed powerlaw model to attenuate the transmitted emission, since the MYTorus models have a lower column density limit of 1022 cm-2 which is higher than the line-of-sight column density for this source. When fitting the Chandra and NuSTAR data independently, we find that the global column density is completely unconstrained. While we are able to measure the line-of-sight column density when fitting the Chandra spectrum, finding it in agreement with the value derived from the joint fit ( cm-2), it is consistent with zero when modeling just the NuSTAR data; this latter result is expected since the line-of-sight obscuration is too weak to impact the harder X-ray emission, so it has no measurable effect on the spectrum.
The results of these exercises indicate that any variability present between observational epochs is within the allowed parameter space that would be inferred from any given epoch. The broad-band 0.5-79 keV coverage allow us to place much tighter constraints on the physical properties of the X-ray reprocessor than we would be able to obtain with coverage in only one band. However, as the allowed values, especially for the global column densities, span a wide range, it is possible that the more precise values we obtain from the joint fitting do not reflect a constant column density between epochs since we are unable to rule out variation within the permitted ranges.
Indeed, even contemporaneous lower and higher energy coverage could be limited in its utility to determine whether obscuration changes occurred. As pointed out by Marinucci et al. (2016) who studied the XMM-Newton and NuSTAR spectra of nearby Compton-thick AGN NGC 1068, the 10 keV spectra can exhibit no changes over time, yet the spectrum above 10 keV can vary. During a monitoring campaign where NGC 1068 was observed jointly with XMM-Newton and NuSTAR, they found that the XMM-Newton spectra remained constant, but that the NuSTAR spectrum varied between 2012 (reported in Bauer et al., 2015) and 2014, after which the source returned to the previous state in 2015. Assuming the circumnuclear obscuring medium takes the form of a patchy distribution, they attribute the excess emission above 10 keV observed in 2014 to be due to a cloud moving out of the line-of-sight, changing the effective column density by more than cm-2, unveiling the central engine at higher energies. As we do not have observations above 10 keV at earlier times for the FIRST-2MASS red quasars, we are unable to test for such an effect in our data. However, unlike NGC 1068, the normalization of the spectrum for F2M 0830+3759 at energies below 10 keV did vary between the Chandra and XMM-Newton observations, though the spectral shape, through which the column density is determined, stayed constant. In this case, even in the presence of flux variability, the measured column density affecting the lower energy spectrum shows no evidence of significantly changing.
4 Discussion
From the fits to the X-ray spectra we derive the observed X-ray fluxes (Table 4) and rest-frame intrinsic (i.e., absorption and reflection corrected) luminosities (Table 5). The reported errors reflect the statistical error of the fit (i.e., the uncertainty of ther powerlaw normalization at the 90% confidence level), which is lower than the systematic errors due to absolute calibration of the detectors. Both objects have intrinsic X-ray luminosities consistent with quasars (i.e., erg s-1). However, the X-ray spectral properties are quite different between the two sources. While F2M 1227+3214 has a simple X-ray spectrum well characterized by a single absorbed power law model with mild absorption, applying the MYTorus decoupled mode to this source indicates that the global column density may be up to two orders of magnitude higher. Though the spectra of F2M 1227+3214 has hints that the global column density may be much higher than that along the line-of-sight, the spectrum of F2M 0830+3759 requires that this be the case.
Such significantly different column densities globally versus along the line-of-sight, where the former is much higher than the latter, is consistent with the expecations of the red quasar paradigm: these sources may be in the midst of expelling their cocoons of obscuring gas, making the view to the central engine relatively unobscured and broad-emission line gas visible, while large gas column densities out of the line-of-sight are still present and play a role in reprocessing the observed X-ray emission. Indeed, the fact that the global column density is shown by our X-ray observations to be below the Compton-thick regime is consistent with the picture presented in Glikman et al. (2012), where the red quasars are observed in a phase after the Compton-thick gas is evacuated, as in the Hopkins et al. (2005) model. Additionally, if these systems were viewed from another angle, namely through the heavier global columns of gas, they may possibly be viewed as Type 2 (narrow-line) quasars, analagous to those discovered in SDSS (Zakamska et al., 2003; Reyes et al., 2008; Jia et al., 2013; Lansbury et al., 2014, 2015). Since the soft excess is well accommodated by a model in which the AGN continuum is scattered, this suggests that this emission arises from physical processes associated with black hole fueling rather than other activity within the host galaxy.
Below, we relate the X-ray properties to the optical and infrared characteristics of these sources.
4.1 Optical Reddening versus X-ray Obscuration
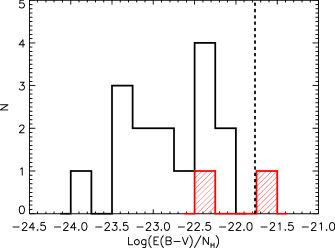
Here, we compare the optical reddening in these quasars, as quantified by their values derived above, with their X-ray obscuration determined by their fitted values. Maiolino et al. (2001a) reported that the / values for nearby AGN are significantly different from the Milky Way value ( mag cm2; Bohlin et al., 1978), and that there are systematic differences depending on intrinsic 2-10 keV luminosity: more luminous AGN with L erg s-1 have systematically lower / values relative to the Galactic standard by factors of several to a hundred, while low-luminosity AGN ( erg s-1) have higher values than observed in the Milky Way (albeit with only three objects in their sample in the latter group). In Figure 7, we compare the / values for the red quasars with the L erg s-1 sample from Maiolino et al. (2001a). In that work, Maiolino et al. (2001a) compare to the line-of-sight column density when the spectra require multiple absorption components to be fitted with a partial covering model. To be consistent with this practice, / is calculated using the line-of-sight column density for the FIRST-2MASS quasars presented here.
F2M 1227+3214 has an / value roughly consistent with the Galactic standard, while F2M 0830+3759 is lower, though on the higher end of the sample presented in Maiolino et al. (2001a). For this latter source, the discrepancy between the measured and Galactic / values could be due to physically disparate scales between the dust attenuating the optical emission and the gas obscuring and reprocessing the X-ray emission. Indeed, though we have a direct view of the broad line region in F2M 0830+3759, Hubble images show that it resides in the remnant of a merger (Urrutia et al., 2008), where dust tends to be distributed on galactic, rather than circumnuclear, scales. Within the dust sublimation zone of the broad-line region, gas can attenuate and reprocess the X-ray emission (e.g., Risaliti et al., 2009, 2010, 2011; Maiolino et al., 2010).
4.2 The - Plane
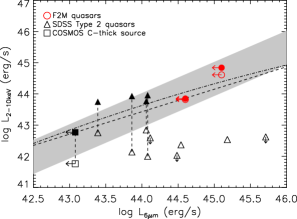
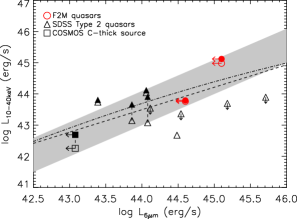
A significant fraction of the mid-infrared emission in AGN arises from circumnuclear dust heated by the central engine, making such reprocessed emission a tracer of the intrinsic AGN power (e.g., Spinoglio & Malkan, 1989; LaMassa et al., 2010). Relationships between the observed X-ray emission and the mid-infrared luminosity can then give a sense of the AGN obscuration (e.g., Alexander et al., 2008; Gandhi et al., 2009; Goulding et al., 2011; LaMassa et al., 2009, 2011; Stern et al., 2014; Lansbury et al., 2014, 2015). However, as pointed out by Yaqoob & Murphy (2011) the ratio of the X-ray to mid-infrared luminosity is also strongly affected by the steepness of the AGN X-ray continuum and global covering fraction of the obscuring medium, so we caution that this ratio is not a clean diagnostic of X-ray obscuration. Lutz et al. (2004) presented a relationship between absorption-corrected 2-10 keV luminosities and 6m luminosities for Type 1 and Type 2 Seyfert galaxies (grey shaded region in Figure 8, left). However, this relation appears to flatten at higher luminosities when samples of more distant and more luminous unobscured AGN from COSMOS (dashed line in Figure 8; Fiore et al., 2009) and SDSS (dot-dashed line in Figure 8; Stern, 2015) are considered.
In Figure 8 we compare the rest-frame X-ray luminosities with the rest-frame mid-infrared 6m luminosities of the FIRST-2MASS quasars, the SDSS Type 2 quasar candidates studied in Lansbury et al. (2014, 2015) and the Compton-thick source, ID 330, discovered in the NuSTAR COSMOS survey (Civano et al., 2015).999The Lutz et al. (2004), Fiore et al. (2009), and Stern (2015) relations in the right-hand panel of Figure 8 are estimated by assuming an X-ray power-law continuum with =1.8. The 6m luminosities for the SDSS Type 2 quasars represent emission from the AGN heated dust, estimated by fitting the SEDs of these sources (Lansbury et al., 2014, 2015) while the 6m luminosities for the Compton-thick COSMOS AGN and the FIRST-2MASS quasars are the total mid-infrared emission, including that from the host galaxy.101010Such host galaxy mid-infrared emission is likely negligible for the FIRST-2MASS sources (c.f., Stern, 2015). The open symbols represent the non-absorption corrected X-ray luminosities while the filled symbols are intrinsic X-ray luminosities, if data exist to calculate this quantity; dashed lines connect the absorbed and intrinsic X-ray luminosities for the same source. We note, however, that the absorption corrected X-ray luminosity is based on the column densities measured from the joint fitting of spectra obtained during different epochs, and the column density could have varied between the epochs and/or between the infrared and X-ray observations.
While the SDSS Type 2 quasars and the Compton-thick COSMOS AGN tend to have absorbed 2-10 keV X-ray luminosities below that predicted by their mid-infrared luminosities, several of these objects have 10-40 keV emission more consistent with the empirical relations derived by Lutz et al. (2004), Fiore et al. (2009), and Stern (2015). This result is consistent with the paradigm that obscuration is suppressing the lower energy X-ray emission while higher energy X-rays pierce through the high columns of gas, suffering much less attenuation. Indeed, where data are available to correct the X-ray luminosities for absorption, the SDSS Type 2 quasars have intrinsic X-ray luminosities similar to the FIRST-2MASS quasars. Both of the red quasars, however, have 2-10 keV luminosities consistent with the - relations derived for luminous quasars by Fiore et al. (2009) and Stern (2015). Unlike the SDSS Type 2 quasars and the Compton-thick source from COSMOS, the difference between the intrinsic and absorbed X-ray luminosities is not extreme since the line-of-sight obscuration is mild to moderate.
5 Conclusions
We have presented the X-ray analysis, including NuSTAR data, of two red quasars, F2M 0830+3759 and F2M 1227+3214, representing the first detection of theses sources at energies above 10 keV. Such red quasars, selected from the FIRST and 2MASS surveys, are hypothesized to be a transitional link between heavily enshrouded supermassive black hole growth caused by major galaxy mergers and the traditional Type 1 quasars efficiently discovered in optical surveys (Glikman et al., 2007, 2012, 2013; Brusa et al., 2005, 2007; Banerji et al., 2012, 2015). Indeed, Hubble imaging of F2M 0830+3759 reveals a train-wreck host galaxy, evidence of a past major merger (Urrutia et al., 2008). Additionally, after correcting for reddening, these quasars are among the most luminous AGN at every redshift (Glikman et al., 2012; Banerji et al., 2015), though less extreme than the WISE-discovered Hot DOGs (Assef et al., 2015; Tsai et al., 2015). We summarize the main results below, where both the broad-band X-ray coverage (0.5 - 79 keV) from Chandra/XMM-Newton and NuSTAR and physically motivated X-ray models are crucial for providing clear insight into the physical processes at play in these luminous obscured AGN:
-
•
Both F2M 0830+3759 and F2M 1227+3214 have mild-to-moderate absorption along the line-of-sight (= cm-2 and cm-2, respectively). When fitting the spectra of these objects with MYTorus in decoupled mode, we find global column densities () of cm-2 and cm-2 for F2M 0830+3759 and F2M 1227+3214, respectively. Though this global gas obscuration is physically distinct from the gas which attenuates the emission along the line-of-sight to the central engine, it plays a role in reprocessing the observed X-ray spectrum. This obscuration geometry is consistent with the red quasar paradigm: while a direct view of the central engine is not completely blocked (i.e., broad emission lines are visible in the infrared spectrum), gas with large column densities is present near the black hole.
-
•
F2M 0830+3759, as originally pointed out by Piconcelli et al. (2010), has soft excess X-ray emission below 1 keV, which is well accommodated by a model where 7% of the intrinsic AGN continuum leaks through holes in a patchy obscuring medium and is then scattered into or directly enters our line-of-sight.
-
•
While F2M 1227+3214 has a measured / value largely consistent with that of our Galaxy, the dust to gas ratio in F2M 0830+3759 is lower than the Galactic standard, though on the upper end of the distribution reported in the Maiolino et al. (2001a) sample (Figure 7). Since F2M 0830+3759 lives in a host galaxy with a morphology indicative of a recent major merger (Urrutia et al., 2008), the dust that reddens the optical quasar emission can be distributed on galaxy-wide scales, while the X-ray obscuring gas is likely circumnuclear, and perhaps within the dust sublimation zone of the broad-line region (e.g., Risaliti et al., 2009, 2010, 2011; Maiolino et al., 2010). Hence the disagreement between the observed and Galactic dust to gas ratio is perhaps to be expected.
-
•
F2M 0830+3759 and F2M 1227+3214 have observed X-ray to 6m luminosities consistent with the empirical relations derived for local Seyfert galaxies (Lutz et al., 2004) and unobscured quasars (Fiore et al., 2009; Stern, 2015), unlike the Type 2 SDSS quasars (Lansbury et al., 2014, 2015) and the Compton-thick AGN discovered in the NuSTAR survey of COSMOS (Civano et al., 2015), where the observed X-ray luminosities are heavily diminished. Thus, X-ray observations of luminous obscured quasars, such as the two sources presented here, present a unique opportunity to test the X-ray to mid-infrared relationship in a new regime.
Red quasars similar to the sources discussed here may represent a short-lived, yet critical phase, in the growth of black holes and subsequent evolution of their host galaxies. NuSTAR data combined with recent advances in X-ray modeling, provide an unprecedented opportunity to peer through the obscuration and unravel the physical complexities of these systems. In particular, X-ray models that are capable of estimating a patchy distribution, where the line-of-sight column density is independently disentangled from the global column density, is of particular relevance for accurately understanding this population of AGN. Currently, two X-ray models have this capability: the clumpy torus model from Liu & Li (2014) and the decoupled mode of the MYTorus model, and only the latter one is publicly available. Future observations of more red quasars will be essential for determining whether many have larger column densities than indicated purely by line-of-sight obscuration, and how this three-dimensional information may be related to larger-scale host galaxy obscuration.
References
- Alexander & Hickox (2012) Alexander, D. M., & Hickox, R. C. 2012, New A Rev., 56, 93
- Alexander et al. (2008) Alexander, D. M., Chary, R.-R., Pope, A., et al. 2008, ApJ, 687, 835
- Antonucci (1993) Antonucci, R. 1993, ARA&A, 31, 473
- Arnaud (1996) Arnaud, K. A. 1996, Astronomical Data Analysis Software and Systems V, 101, 17
- Assef et al. (2015) Assef, R. J., Eisenhardt, P. R. M., Stern, D., et al. 2015, ApJ, 804, 27
- Assef et al. (2013) Assef, R. J., Stern, D., Kochanek, C. S., et al. 2013, ApJ, 772, 26
- Baloković et al. (2014) Baloković, M., Comastri, A., Harrison, F. A., et al. 2014, ApJ, 794, 111
- Bauer et al. (2015) Bauer, F. E., Arévalo, P., Walton, D. J., et al. 2015, ApJ, 812, 116
- Baumgartner et al. (2013) Baumgartner, W. H., Tueller, J., Markwardt, C. B., et al. 2013, ApJS, 207, 19
- Banerji et al. (2015) Banerji, M., Alaghband-Zadeh, S., Hewett, P. C., & McMahon, R. G. 2015, MNRAS, 447, 3368
- Banerji et al. (2012) Banerji, M., McMahon, R. G., Hewett, P. C., et al. 2012, MNRAS, 427, 2275
- Bohlin et al. (1978) Bohlin, R. C., Savage, B. D., & Drake, J. F. 1978, ApJ, 224, 132
- Brightman et al. (2015) Brightman, M., Baloković, M., Stern, D., et al. 2015, ApJ, 805, 41
- Brightman & Nandra (2011) Brightman, M., & Nandra, K. 2011, MNRAS, 413, 1206
- Brusa et al. (2015) Brusa, M., Bongiorno, A., Cresci, G., et al. 2015, MNRAS, 446, 2394
- Brusa et al. (2010) Brusa, M., Civano, F., Comastri, A., et al. 2010, ApJ, 716, 348
- Brusa et al. (2005) Brusa, M., Comastri, A., Daddi, E., et al. 2005, A&A, 432, 69
- Brusa et al. (2007) Brusa, M., Zamorani, G., Comastri, A., et al. 2007, ApJS, 172, 353
- Civano et al. (2015) Civano, F., Hickox, R. C., Puccetti, S., et al. 2015, ApJ, 808, 185
- Cushing et al. (2004) Cushing, M. C., Vacca, W. D., & Rayner, J. T. 2004, PASP, 116, 362
- Cutri et al. (2002) Cutri, R. M., Nelson, B. O., Francis, P. J., & Smith, P. S. 2002, IAU Colloq. 184: AGN Surveys, 284, 127
- Dale et al. (2014) Dale, D. A., Helou, G., Magdis, G. E., et al. 2014, ApJ, 784, 83
- Draine & Li (2007) Draine, B. T., & Li, A. 2007, ApJ, 657, 810
- Evans et al. (2010) Evans, I. N., Primini, F. A., Glotfelty, K. J., et al. 2010, ApJS, 189, 37
- Farrah et al. (2012) Farrah, D., Urrutia, T., Lacy, M., et al. 2012, ApJ, 745, 178
- Ferrarese & Merritt (2000) Ferrarese, L., & Merritt, D. 2000, ApJ, 539, L9
- Fiore et al. (2009) Fiore, F., Puccetti, S., Brusa, M., et al. 2009, ApJ, 693, 447
- Fiore et al. (2008) Fiore, F., Grazian, A., Santini, P., et al. 2008, ApJ, 672, 94
- Fritz et al. (2006) Fritz, J., Franceschini, A., & Hatziminaoglou, E. 2006, MNRAS, 366, 767
- Fruscione et al. (2006) Fruscione, A., McDowell, J. C., Allen, G. E., et al. 2006, Proc. SPIE, 6270, 62701V
- Gandhi et al. (2009) Gandhi, P., Horst, H., Smette, A., et al. 2009, A&A, 502, 457
- Garmire et al. (2003) Garmire, G. P., Bautz, M. W., Ford, P. G., Nousek, J. A., & Ricker, G. R., Jr. 2003, Proc. SPIE, 4851, 28
- Gebhardt et al. (2000) Gebhardt, K., Bender, R., Bower, G., et al. 2000, ApJ, 539, L13
- Georgakakis et al. (2012) Georgakakis, A., Grossi, M., Afonso, J., & Hopkins, A. M. 2012, MNRAS, 421, 2223
- George & Fabian (1991) George, I. M., & Fabian, A. C. 1991, MNRAS, 249, 352
- Glikman et al. (2015) Glikman, E., Simmons, B., Mailly, M., et al. 2015, arXiv:1504.02111
- Glikman et al. (2013) Glikman, E., Urrutia, T., Lacy, M., et al. 2013, ApJ, 778, 127
- Glikman et al. (2012) Glikman, E., Urrutia, T., Lacy, M., et al. 2012, ApJ, 757, 51
- Glikman et al. (2007) Glikman, E., Helfand, D. J., White, R. L., et al. 2007, ApJ, 667, 673
- Glikman et al. (2006) Glikman, E., Helfand, D. J., & White, R. L. 2006, ApJ, 640, 579
- Glikman et al. (2004) Glikman, E., Gregg, M. D., Lacy, M., et al. 2004, ApJ, 607, 60
- Goulding et al. (2011) Goulding, A. D., Alexander, D. M., Mullaney, J. R., et al. 2011, MNRAS, 411, 1231
- Graham & Scott (2013) Graham, A. W., & Scott, N. 2013, ApJ, 764, 151
- Harrison et al. (2013) Harrison, F. A., Craig, W. W., Christensen, F. E., et al. 2013, ApJ, 770, 103
- Heckman & Best (2014) Heckman, T. M., & Best, P. N. 2014, ARA&A, 52, 589
- Hickox et al. (2007) Hickox, R. C., Jones, C., Forman, W. R., et al. 2007, ApJ, 671, 1365
- Hopkins et al. (2008) Hopkins, P. F., Hernquist, L., Cox, T. J., & Kereš, D. 2008, ApJS, 175, 356
- Hopkins et al. (2005) Hopkins, P. F., Hernquist, L., Cox, T. J., et al. 2005, ApJ, 630, 705
- Ikeda et al. (2009) Ikeda, S., Awaki, H., & Terashima, Y. 2009, ApJ, 692, 608
- Ivezić et al. (2002) Ivezić, Ž., Menou, K., Knapp, G. R., et al. 2002, AJ, 124, 2364
- Jia et al. (2013) Jia, J., Ptak, A., Heckman, T., & Zakamska, N. L. 2013, ApJ, 777, 27
- Kalberla et al. (2005) Kalberla, P. M. W., Burton, W. B., Hartmann, D., et al. 2005, A&A, 440, 775
- Kallman & Bautista (2001) Kallman, T., & Bautista, M. 2001, ApJS, 133, 221
- Kormendy & Ho (2013) Kormendy, J., & Ho, L. C. 2013, ARA&A, 51, 511
- Krolik & Kallman (1987) Krolik, J. H., & Kallman, T. R. 1987, ApJ, 320, L5
- LaMassa et al. (2014) LaMassa, S. M., Yaqoob, T., Ptak, A. F., et al. 2014, ApJ, 787, 61
- LaMassa et al. (2011) LaMassa, S. M., Heckman, T. M., Ptak, A., et al. 2011, ApJ, 729, 52
- LaMassa et al. (2010) LaMassa, S. M., Heckman, T. M., Ptak, A., et al. 2010, ApJ, 720, 786
- LaMassa et al. (2009) LaMassa, S. M., Heckman, T. M., Ptak, A., et al. 2009, ApJ, 705, 568
- Lansbury et al. (2014) Lansbury, G. B., Alexander, D. M., Del Moro, A., et al. 2014, ApJ, 785, 17
- Lansbury et al. (2015) Lansbury, G. B., Gandhi, P., Alexander, D. M., et al. 2015, arXiv:1506.05120
- Lanzuisi et al. (2013) Lanzuisi, G., Civano, F., Elvis, M., et al. 2013, MNRAS, 431, 978
- Lasker et al. (2008) Lasker, B. M., Lattanzi, M. G., McLean, B. J., et al. 2008, AJ, 136, 735
- Liu & Li (2015) Liu, Y., & Li, X. 2015, MNRAS, 448, L53
- Liu & Li (2014) Liu, Y., & Li, X. 2014, ApJ, 787, 52
- Lutz et al. (2004) Lutz, D., Maiolino, R., Spoon, H. W. W., & Moorwood, A. F. M. 2004, A&A, 418, 465
- Madsen et al. (2015) Madsen, K. K., Harrison, F. A., Markwardt, C., et al. 2015, arXiv:1504.01672
- Mainieri et al. (2002) Mainieri, V., Bergeron, J., Hasinger, G., et al. 2002, A&A, 393, 425
- Maiolino et al. (2010) Maiolino, R., Risaliti, G., Salvati, M., et al. 2010, A&A, 517, A47
- Maiolino et al. (2001a) Maiolino, R., Marconi, A., Salvati, M., et al. 2001, A&A, 365, 28
- Marinucci et al. (2016) Marinucci, A., Bianchi, S., Matt, G., et al. 2016, MNRAS, 456, L94
- Mayo & Lawrence (2013) Mayo, J. H., & Lawrence, A. 2013, MNRAS, 434, 1593
- Miller et al. (2011) Miller, B. P., Brandt, W. N., Schneider, D. P., et al. 2011, ApJ, 726, 20
- Murphy & Yaqoob (2009) Murphy, K. D., & Yaqoob, T. 2009, MNRAS, 397, 1549
- Netzer (2015) Netzer, H. 2015, arXiv:1505.00811
- Noll et al. (2009) Noll, S., Burgarella, D., Giovannoli, E., et al. 2009, A&A, 507, 1793
- Piconcelli et al. (2010) Piconcelli, E., Vignali, C., Bianchi, S., et al. 2010, ApJ, 710, 992
- Reid et al. (1991) Reid, I. N., Brewer, C., Brucato, R. J., et al. 1991, PASP, 103, 661
- Reyes et al. (2008) Reyes, R., Zakamska, N. L., Strauss, M. A., et al. 2008, AJ, 136, 2373
- Ricci et al. (2014) Ricci, C., Ueda, Y., Ichikawa, K., et al. 2014, A&A, 567, A142
- Risaliti et al. (2011) Risaliti, G., Nardini, E., Salvati, M., et al. 2011, MNRAS, 410, 1027
- Risaliti et al. (2010) Risaliti, G., Elvis, M., Bianchi, S., & Matt, G. 2010, MNRAS, 406, L20
- Risaliti et al. (2009) Risaliti, G., Salvati, M., Elvis, M., et al. 2009, MNRAS, 393, L1
- Sanders et al. (1988) Sanders, D. B., Soifer, B. T., Elias, J. H., Neugebauer, G., & Matthews, K. 1988, ApJ, 328, L35
- Scannapieco et al. (2012) Scannapieco, C., Wadepuhl, M., Parry, O. H., et al. 2012, MNRAS, 423, 1726
- Schneider et al. (2002) Schneider, D. P., Richards, G. T., Fan, X., et al. 2002, AJ, 123, 567
- Serra et al. (2011) Serra, P., Amblard, A., Temi, P., et al. 2011, ApJ, 740, 22
- Shu et al. (2011) Shu, X. W., Yaqoob, T., & Wang, J. X. 2011, ApJ, 738, 147
- Skrutskie et al. (2006) Skrutskie, M. F., Cutri, R. M., Stiening, R., et al. 2006, AJ, 131, 1163
- Spinoglio & Malkan (1989) Spinoglio, L., & Malkan, M. A. 1989, ApJ, 342, 83
- Stern (2015) Stern, D. 2015, ApJ, 807, 129
- Stern et al. (2014) Stern, D., Lansbury, G. B., Assef, R. J., et al. 2014, ApJ, 794, 102
- Stern et al. (2012) Stern, D., Assef, R. J., Benford, D. J., et al. 2012, ApJ, 753, 30
- Tsai et al. (2015) Tsai, C.-W., Eisenhardt, P. R. M., Wu, J., et al. 2015, ApJ, 805, 90
- Turner & Miller (2009) Turner, T. J., & Miller, L. 2009, A&A Rev., 17, 47
- Urrutia et al. (2012) Urrutia, T., Lacy, M., Spoon, H., et al. 2012, ApJ, 757, 125
- Urrutia et al. (2008) Urrutia, T., Lacy, M., & Becker, R. H. 2008, ApJ, 674, 80
- Urrutia et al. (2005) Urrutia, T., Lacy, M., Gregg, M. D., & Becker, R. H. 2005, ApJ, 627, 75
- Urry & Padovani (1995) Urry, C. M., & Padovani, P. 1995, PASP, 107, 803
- Vacca et al. (2003) Vacca, W. D., Cushing, M. C., & Rayner, J. T. 2003, PASP, 115, 389
- Wilkes et al. (2002) Wilkes, B. J., Schmidt, G. D., Cutri, R. M., et al. 2002, ApJ, 564, L65
- Wilkes et al. (2005) Wilkes, B. J., Pounds, K. A., Schmidt, G. D., et al. 2005, ApJ, 634, 183
- Wilson et al. (2004) Wilson, J. C., Henderson, C. P., Herter, T. L., et al. 2004, Proc. SPIE, 5492, 1295
- Winter et al. (2009) Winter, L. M., Mushotzky, R. F., Reynolds, C. S., & Tueller, J. 2009, ApJ, 690, 1322
- Yaqoob (2012) Yaqoob, T. 2012, MNRAS, 423, 3360
- Yaqoob & Murphy (2011) Yaqoob, T., & Murphy, K. D. 2011, MNRAS, 412, 835
- York et al. (2000) York, D. G., Adelman, J., Anderson, J. E., Jr., et al. 2000, AJ, 120, 1579
- Zakamska et al. (2003) Zakamska, N. L., Strauss, M. A., Krolik, J. H., et al. 2003, AJ, 126, 2125