Measuring the Distribution and Excitation of Cometary CH3OH Using ALMA
Abstract
The Atacama Large Millimeter/submillimeter Array (ALMA) was used to obtain measurements of spatially and spectrally resolved CH3OH emission from comet C/2012 K1 (PanSTARRS) on 28-29 June 2014. Detection of 12-14 emission lines of CH3OH on each day permitted the derivation of spatially-resolved rotational temperature profiles (averaged along the line of sight), for the innermost 5000 km of the coma. On each day, the CH3OH distribution was centrally peaked and approximately consistent with spherically symmetric, uniform outflow. The azimuthally-averaged CH3OH rotational temperature () as a function of sky-projected nucleocentric distance (), fell by about 40 K between and 2500 km on 28 June, whereas on 29 June, fell by about 50 K between 0 km and 1500 km. A remarkable ( K) rise in at 1500-2500 km on 29 June was not present on 28 June. The observed variations in CH3OH rotational temperature are interpreted primarily as a result of variations in the coma kinetic temperature due to adiabatic cooling, and heating through Solar irradiation, but collisional and radiative non-LTE excitation processes also play a role.
keywords:
Comets: individual (C/2012 K1 (PanSTARRS), techniques: interferometric, submillimeter, molecular processes1 Introduction
Comets are believed to have formed around 4.5 Gyr ago and contain ice, dust and debris left over from the formation of the Solar System. Their compositions can therefore reveal information on the physical and chemical properties of the protosolar disk and prior interstellar cloud. Much of our knowledge on cometary compositions comes from remote (ground-based) observations, for which relatively low angular resolution and spatial coverage limits the amount of information that can be obtained. In particular, there is a lack of understanding concerning the physical and chemical structure of the near-nucleus coma, at distances less than a few thousand kilometres from the nucleus.
The first cometary observations with ALMA were reported by Cordiner et al. (2014), who measured the distributions of HCN, HNC and H2CO in the inner comae of comets C/2012 F6 (Lemmon) and C/2012 S1 (ISON). By virtue of its large abundance in comets and its complex energy level structure, methanol (CH3OH), is the most readily-detectable molecule for probing the coma temperature at radio/sub-mm wavelengths. Here, we briefly summarise some early results that exploit the unprecedented resolution and sensitivity of ALMA to provide new information on the distribution and temperature of CH3OH in the inner coma of comet C/2012 K1 (PanSTARRS).
2 Observations
ALMA observations of C/2012 K1 (PanSTARRS) were obtained on 2014-06-28 19:07-20:05 and 2014-06-28 17:37-18:26 at a heliocentric distance AU and geocentric distance AU. The CH3OH band near 251.9 GHz was observed on 28 June and the band near 338.5 GHz was observed on 29 June. Atmospheric conditions were outstanding throughout (with zenith PWV mm). Thirty 12-m antennae, with baseline lengths 20-650 m, resulted in an angular resolution of at 252 GHz and at 338 GHz, with 488 kHz spectral resolution. The data were flagged, calibrated and imaged using standard CASA routines (see Cordiner et al., 2014). Twelve individual CH3OH emission lines (originating from the rotational level, with , ) were detected on 28 June and fourteen lines (originating from the level, with , ) were detected on 29 June.


3 Results
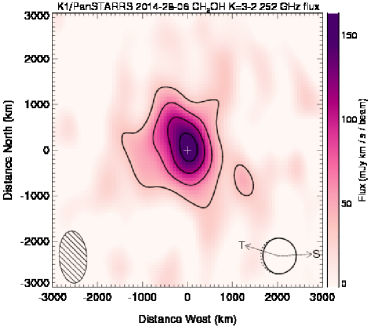
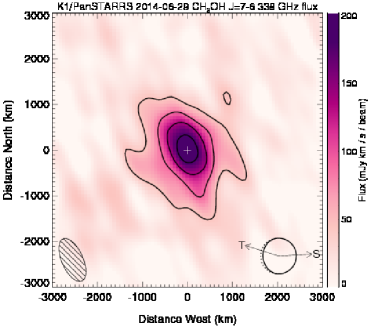
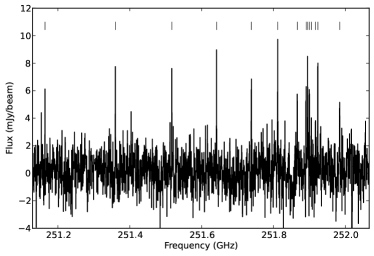
Fig. 1 shows the observed CH3OH flux maps integrated over the strongest lines detected in each band. To first order (given the noise), these ALMA maps are consistent with azimuthal symmetry about the peak, and can be modeled under the assumption of an isotropic outflow from the nucleus (Cordiner et al., 2014). To obtain the highest spectroscopic signal-to-noise ratio as a function of radius, the spectral data cubes were azimuthally averaged about the emission peak, allowing for a significant improvement in sensitivity (particularly towards larger radii). The data were binned into a series of -thick annuli centered on the emission peak, and the average flux was taken in each annulus, resulting in azimuthally-averaged spectra () as a function of sky-projected radius from the optocenter. The for ( km) are shown in Fig. 2.
From the observed emission line strengths, an excitation diagram technique was used to derive the CH3OH rotational temperature () as a function of , following a similar method to that described by Disanti et al. (2006). Integrated line intensities (and their statistical errors) for each annulus were first converted to brightness temperature units (K km s-1) using the Rayleigh-Jeans approximation. Then using the standard (optically thin) relationship between brightness temperature and column density (e.g. Cummins et al., 1986), the column density () corresponding to each line flux () was plotted as a function of upper-state energy (), and the gradient () of this diagram was derived. Assuming LTE, the excitation temperature for which represents (the mean rotational temperature along the line of sight), and the error on is calculated from . This technique has the advantage over the conventional rotational diagram method that blended lines can be included through use of the weighted mean energy () of the blended transitions. Further details of this analysis will be provided in a future article (Cordiner et al., in prep.).
4 Discussion and Conclusion
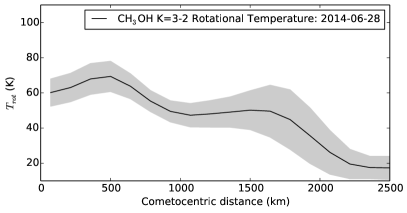
Fig. 3 shows the azimuthally-averaged temperature profiles as a function of sky-projected distance from the emission peak, for both sets of CH3OH observations. Both datasets show a general trend for decreasing rotational temperatures as a function of distance between and 1500 km, although the decrease was much slower on June 28th than June 29th. In fact, on June 28th (for the band), a possible increase in occurred (from K to K) between and 500 km. This was followed by a relatively slow decrease with radius to K at km. Conversely, on June 29th (for the band), there was a rapid decrease in from K to K between and 1400 km, followed by a significant increase to K at km.
The maximum radial extent of the CH3OH flux detected by ALMA was approx. km. However, contemporaneous position-switched observations of the 338 GHz CH3OH band were obtained using the APEX telescope on June 29th. These (single-pointing) data provide a measure of the mean rotational temperature within the (26,000 km) APEX beam. A value of K was derived, which shows that over the larger values of probed by APEX, the temperature was significantly less than in the inner few thousand km probed by ALMA. Such variations in temperature with distance from the nucleus have been observed previously by long-slit IR spectroscopy (e.g. Bonev et al., 2013), and are predicted by theoretical studies due to adiabatic cooling of the outflowing gas (see Rodgers et al., 2005, and references therein).
Interpretation of CH3OH rotational temperatures is non-trivial due to the low density of the coma, as demonstrated by Bockelée-Morvan et al. (1994). Radiative cooling combined with decreased collision rates as a function of radius results in departure from local thermodynamic equilibrium (LTE), such that with increasing , falls increasingly below the coma kinetic temperature . Detailed excitation modelling (including radiative pumping, cooling and collisions between CH3OH, H2O and electrons), shows that falls more rapidly as a function of than , due to the larger radiative relaxation rates of the levels. On both dates, however, non-LTE effects alone are insufficient to explain the observed temperature drops with increasing , so these are attributed to adiabatic cooling of the coma. The increasing temperature with distance between 1500-2500 km on June 29th is difficult to explain, but a possible source of heating may be through the sublimation of icy grains in the coma, heated by Solar radiation (see Fougere et al., 2012).
As a caveat to our analysis, the ALMA observations are not sensitive to large-scale flux from the outer coma (on angular scales or km), which could bias our derived curves. The magnitude of this effect will be quantified through detailed simulations in a future article, but the optimal method to deal with this problem will be through direct (line by line) modelling of the interferometric visibilities.
Our ALMA observations of CH3OH emission at millimeter and submillimeter wavelengths have permitted the first ‘instantaneous’, spatially-resolved 2-D measurements of rotational temperatures in the inner few thousand kilometers (sky-projected distance) of a cometary coma. Large variations in the CH3OH rotational temperature in C/2012 K1 (Panstarrs) over distances km are likely due to variations in the coma kinetic temperature, the cause of which will be investigated in more detail in a future article. This study demonstrates that spatial temperature variations may need to be considered when deriving coma molecular abundances from spectral line data. Further high resolution observations and modelling are required in order to better understand the coma thermal physics and molecular excitation, and to assist in the determination of more accurate cometary compositions.
This paper makes use of the following ALMA data: ADS/JAO.ALMA#2013.1.01061.S. ALMA is a partnership of ESO (representing its member states), NSF (USA) and NINS (Japan), together with NRC (Canada), NSC and ASIAA (Taiwan), and KASI (Republic of Korea), in cooperation with the Republic of Chile. The Joint ALMA Observatory is operated by ESO, AUI/NRAO and NAOJ.
References
- Bockelée-Morvan et al. (1994) Bockelée-Morvan, D., Crovisier, J., Colom, P., Despois, D. 1994, A&A, 287, 647
- Bonev et al. (2013) Bonev, B. P., Villanueva, G. L., Paganini, L. et al. 2013, Icarus, 222, 740
- Cordiner et al. (2014) Cordiner, M. A., Remijan, A. J., Boissier, J. et al. 2014, ApJ, 792, L2
- Cummins et al. (1986) Cummins, S. E., Linke, R. A., Thaddeus, P. 1986, ApJS, 60, 819
- Disanti et al. (2006) DiSanti, M. A., Bonev, B. P., Magee-Sauer, K. et al. 2006, ApJ, 650, 470
- Rodgers et al. (2005) Rodgers, S. D., Charnley, S. B., Huebner, W. F., Boice, D. C. 2005, Comets II, eds. M. C. Festou, H. U. Keller & W. A. Weaver, Univ. Arizona, Tucson, p505
- Fougere et al. (2012) Fougere, N., Combi, M. R., Tenishev, V. 2012, Icarus, 221, 174