Daily variability of Ceres’ Albedo detected by means of radial velocities changes of the reflected sunlight
Abstract
Bright features have been recently discovered by Dawn on Ceres, which extend previous photometric and Space Telescope observations. These features should produce distortions of the line profiles of the reflected solar spectrum and therefore an apparent radial velocity variation modulated by the rotation of the dwarf planet. Here we report on two sequences of observations of Ceres performed in the nights of 31 July, 26-27 August 2015 by means of the high-precision HARPS spectrograph at the 3.6-m La Silla ESO telescope. The observations revealed a quite complex behaviour which likely combines a radial velocity modulation due to the rotation with an amplitude of m s-1 and an unexpected diurnal effect. The latter changes imply changes in the albedo of Occator’s bright features due to the blaze produced by the exposure to solar radiation. The short-term variability of Ceres’ albedo is on timescales ranging from hours to months and can both be confirmed and followed by means of dedicated radial velocity observations.
keywords:
Planets and satellites: general - – Stars: planetary systems –1 Introduction
Ceres’ diameter of 950 km makes it the largest body in the asteroid belt as well as the smallest dwarf planet in the Solar System. At least one-quarter of its mass is composed of water, a proportion greater than in other asteroids and even on Earth.
Chamberlain, Sykes & Esquerdo (2007) obtained Ceres’ light curves from 1958 to 2004 and found an optical flux modulation of mag which provided a very precise rotational period of 9.074170 0.000002 h. In 2003 the Hubble Space Telescope captured a spot moving with Ceres’ rotation. Hubble images acquired by the Advanced Camera for Surveys at a resolution of 30 km in three wide band filters (535, 335 and 223 nm) allowed the identification of eleven surface albedo features ranging in scale from 40 to 350 km but with no details revealing their origin (Li et al., 2006). Water vapour plumes erupting off the surface of Ceres have been observed with Herschel by Küppers et al. (2014) who suggested that they may be produced by volcano-like ice geysers. NASA’s Dawn Spacecraft reached its final destination to Ceres in 2015 and the first images of the asteroid revealed the unexpected presence of a prominent spot in its northern hemisphere in coincidence with feature N.5 of Li et al. (2006), which was mainly seen in the UV bands and barely in the optical. In the images taken in February by Dawn at a distance of 46000 km one of Ceres’ bright spots located in the Occator crater revealed a companion of lower brightness, but apparently in the same basin. Images taken in June showed that the bright spot consists of a large bright area at its center and several smaller spots nearby. The presence of several bright spots in the same basin may be pointing to a volcano-like origin of the spots. However, it is not clear how an isolated dwarf planet could be thermodynamically active enough to generate either of them.
It has been suggested that the bright spots may be located in a relatively fresh giant impact crater revealing bright water ice under a thin crust. It has also been speculated that they could be evidence of cryo-volcanism or even icy geysers (Witze, 2015; Küppers et al., 2014). Images by Dawn reveal the spots even when they are near the limb of Ceres, when the sides of the impact crater would normally block the view of anything placed at the bottom. This suggests that the main feature rises relatively high above the surface of the crater. Dawn scientists have not yet established whether the bright spots are made of ice, of evaporated salts, or something else. Thus up to this day the nature of these spots remains a mystery.
Small rocky bodies are reflecting almost unaltered sunlight as point-like sources, besides being also good radial velocity standards (Molaro & Monai, 2012). However, the presence of an albedo inhomogeneity implying either an enhanced or reduced reflectivity in a small area of the rotating body should produce a distortion in the reflected solar line profiles modulated by the asteroid rotation (Lanza & Molaro, 2015). Therefore, Ceres photometric variability should be associated with a modulation of the radial velocity of the reflected solar spectrum with the rotational period at the level of few m s-1. This phenomenon is similar but opposite to the Rossiter Mc-Laughlin effect occurring from the transit of a planet in front of the host star (Queloz et al., 2000; Molaro et al., 2013).
2 Observations and kinematics
We observed Ceres on 30 July 2015 taking a sequence of 40 HARPS exposures of 780 sec each. The observations started on 30 July at 23:33 UT and ended on 31 Jul at 09:14 UT (MJD= 2457233.994 to 2457234.381) in an unbroken sequence lasting for 9.45 hours which is slightly longer than Ceres rotational period of 9.074 hours. On the 26th of August we took a second sequence of 29 exposures of 900 sec each. The observations started on 26 August at 23:36 UT at the beginning of the night and ended at the set of Ceres on 27 Aug at 06:49 UT (MJD 2457260.9878- 2457261.2840) in an uninterrupted sequence lasting 7.25 hours, i.e. a bit shorter than a complete rotation. Five exposures were also taken at the end of the night on 27th August when we could shortly open the dome during a pause of bad weather. The journal of the observations together with the relevant quantities are given in Tab 2.
Ceres had an APmag of 7.5 mag, an angular dimension of 0.69 arcsec and was observable during most of the night. The observations were performed at phase angles of 4.4 and 12.3 degrees in July and August, respectively. At opposition Ceres becomes slightly brighter due to the Opposition Surge effect, but no radial velocity variations are expected within a single rotational period (Molaro et al., 2015). Inspection of the solar activity through the Solar Dynamic Observatory revealed no significant change in the solar activity to induce an important radial velocity change. The solar activity measured from the total sunspot area changed slightly from 500 to 1250 millionths of solar hemisphere between 31 July and 27 August. However, note that these will introduce a radial velocity offset between the two nights but not a change within one epoch.
We used HARPS pipeline to obtain the radial velocities from sunlight spectra which are reported in the third column of Tab 2. In the HARPS spectrograph a second fiber supplies simultaneous ThAr spectra that are used to correct for instrumental radial velocity drifts occurring over the night due to residual temperature, pressure or mechanical changes. The radial velocity differences with respect to the previous calibration provide the instrumental drifts of the spectrograph. We are considering the values RVc corrected for instrumental drift and reported in the column 4 of online Tab 2 but note that corrections are always below 0.5 m s-1 and do not affect the results. Single observations have S/N 100 and the error in the radial velocity measurement is lower than 1 m s-1. The pipeline radial velocity RVc is relative to the solar system barycenter, but it is not appropriate for reflecting bodies. Thus, we remove the pipeline barycentric radial velocity correction, the BERV, and the proper radial velocity becomes:
|
|
(1) |
where the radial velocity of the observer relative to Ceres is and is that of Ceres relative to the Sun. The latter needs to be also considered because the sunlight reflected by Ceres is shifted by its radial velocity with respect to the Sun at the time the photons leave Ceres (Molaro & Centurión, 2011; Lanza & Molaro, 2015). The quantities and are computed by using the JPL horizon ephemerides 111Solar System Dynamics Group, Horizons Web Ephemerides Systems, JPL, Pasadena, CA 91109 USA http://ssd.jpl.nasa.gov. The relativistic components are of 0.766 m s-1 in July and of 0.957 m s-1 in August with a change between the two epochs of 0.2 m s-1 which can be neglected. The error in these estimations depends on the precision of the ephemerides but should be of few cm s-1. The average rate in the radial velocity change due to kinematical motions alone is 0.65 -0.67 m s-1 per minute. During the exposure of 15 minutes this velocity change produces a small but finite spectral smearing. However, the spectral smearing is symmetrical to a good approximation and it does not result into a net shift in the radial velocities estimated for flux weighted mid-exposure values.
The HARPS pipeline cross–correlates the reflected solar spectrum with the Fourier Transform Spectrometer (FTS) solar spectrum obtained by Kurucz at the McMath-Pierce Solar Telescope at Kitt Peak National Observatory (Kurucz et al., 1984). The FTS solar spectrum is anchored in wavelength onto few telluric emission lines and has an uncertainty associated in the zero point of the order of 100 m s-1 (Kurucz et al., 1984; Molaro & Monai, 2012). This offset was measured in coincidence of the Venus transit of 6 June 2012 and was found to be of 102.5 m s-1 (Molaro et al., 2013) with an uncertainty of the order of few m s-1. Note that this value also incorporates the solar activity on that day. However, in June 2015 a new set of octagonal fibers have replaced the original circular ones as part of the HARPS upgrade. This led to a change in the Instrumental Profile of the spectrograph and a shift in the RV-offset. Measurements of a set of RV standards before and after the upgrade show that the shift depends on the line shape and on the stellar spectral type. For two G2V solar twins the shift has been found increased by +16.1 and 14.1 m s-1 if compared to previous values obtained with the circular fiber, i.e. about 118 m s-1 in total (Lo Curto et al., 2015).
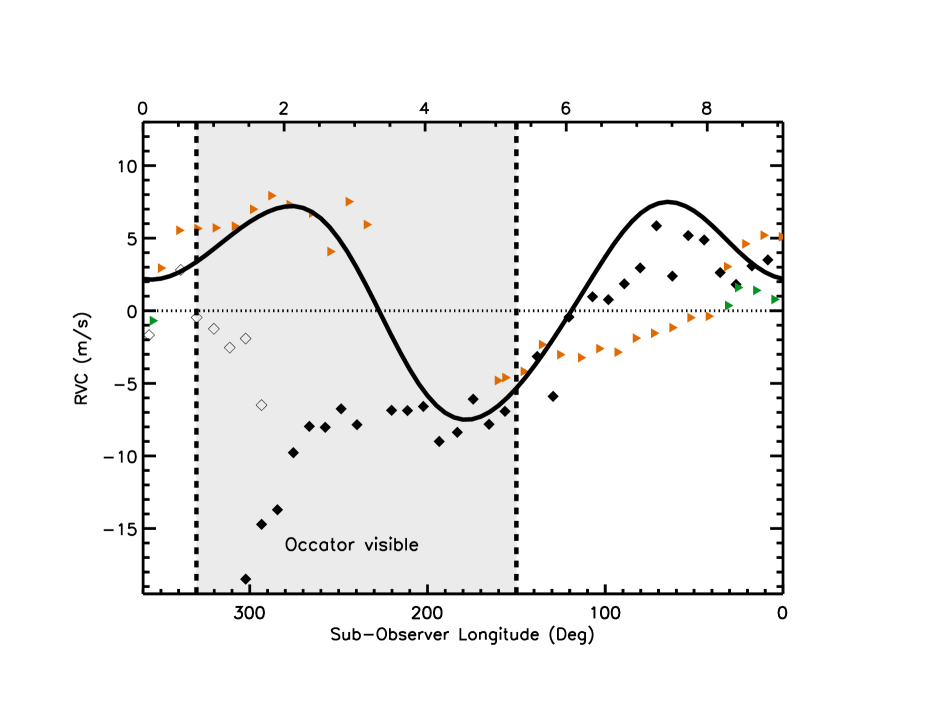
The results are shown in Fig. 1, where the radial velocity is plotted vs. the sub-observer longitude in the reference frame adopted by Chamberlain, Sykes & Esquerdo (2007). The longitude increases in the direction of the dwarf planet rotation, so that the longitude of the sub-observer point decreases vs. time. The diamonds refer to the measurements taken in July while the orange and green triangles are the August observations. Note that the July sequence starts at longitude 300∘. The higher values at the same phase are at the end of that night and are shown with empty diamonds. The peak-to-peak variability in the radial velocities is of about 15 m s-1 while the photon radial velocity error is of 1 m s-1 and no evidence for larger systematic errors, which, however, could always plague in. To be noted that Lanza et al. (2015) traced the radial velocities of Ceres and other bodies in the solar system since 2006 and observed an excess in the scatter in the radial velocities of Ceres with respect to the other bodies. In 12 years of temporal span the standard deviation around the mean is of 6.6 m s-1 , consistent with the dispersion observed here, while for the others bodies studied is in the range of 2 to 4 m s-1 revealing a peculiar behaviour of Ceres’s radial velocities.
The data points are folded with the rotational phase and is possible to see that the observations do not overlap between two successive rotational periods and also between the measurements taken about one month apart. The observed radial velocity pattern which does not reproduce over two close rotational periods necessarily implies a certain degree of variability of the main albedo features responsible for the radial velocity variations on a very short temporal scale.
| Date | MJD | RV | RVc | BERV | Exp | T’ | JDMIDEXP | ||
|---|---|---|---|---|---|---|---|---|---|
| m s-1 | m s-1 | m s-1 | s | m s-1 | m s-1 | m s-1 | |||
| 2015-07-30 23:33:06 | 2457233.98138201 | 914.885 | 914.578 | -3203.246 | 179.9 | 0.50 | 2457234.48131 | 671.421 | 3357.268 |
| 2015-07-30 23:51:29 | 2457233.99414785 | 917.027 | 916.741 | -3224.302 | 779.9 | 0.54 | 2457234.49408 | 671.371 | 3371.657 |
| 2015-07-31 00:11:23 | 2457234.00353524 | 926.589 | 926.437 | -3236.302 | 779.9 | 0.49 | 2457234.50790 | 671.317 | 3389.635 |
| 2015-07-31 00:25:32 | 2457234.01292216 | 927.485 | 927.276 | -3250.686 | 779.9 | 0.54 | 2457234.51773 | 671.279 | 3403.891 |
| 2015-07-31 00:38:32 | 2457234.02230851 | 931.640 | 931.080 | -3264.919 | 779.9 | 0.50 | 2457234.52675 | 671.244 | 3418.031 |
3 A model
The light curves of most asteroids are related to their irregular shapes. However, Ceres’ smooth oblate spheroidal shape suggests that the light curve variations observed by Chamberlain, Sykes & Esquerdo (2007) come from albedo features. These light curves show variations in the V band of 0.04-0.06 mag, i.e. about 3.6-5.4 percent, depending on the phase angle. There are two photometric maxima at phases of about and . The one at phase is the largest with a flux variation of approximately 3.1 percent compared with 2 percent of the secondary one. Moreover, there are also two photometric minima at phases of about and .
We used this template to model the RV modulation induced by the inhomogeneities of the albedo. We assume that Ceres has a spherical shape and subdivide its surface into elements of size . The colatitude of the -th element measured from the North pole and its longitude are indicated as . The albedo of the surface elements is assumed to be uniform, except for those falling within a belt of across the equator that is varied to reproduce the observed template light curve. Specifically, we computed the relative flux variation observed at sub-Earth longitude , where is the reference flux that corresponds to , i.e. the mean value of :
| (2) |
We assume that the flux variation comes from an albedo feature at longitude : , where is the mean albedo and a factor that is adjusted to reproduce the amplitude of the template light curve because we have no information on their latitudinal extension. To compute the radial velocity at each rotation phase we compute the cosine of the angles and between the normal to the -th surface element and the Sun-asteroid or the asteroid-observer directions, respectively (Lanza & Molaro, 2015):
| (3) | |||||
| (4) | |||||
where and are the inclination angles of the Sun-Ceres or the Earth-Ceres lines to the spin axis of the asteroid, respectively, its angular velocity of rotation with the rotation period hours, the time, the initial time, and the phase angle. The spin axis of Ceres is almost perpendicular to the plane of the ecliptic, therefore we assume and consider a mean value for the phase angle of for our time period. The radial velocity of the -th surface element towards the Sun or the observer produced by Ceres’ rotation at the time is given by, respectively:
| (5) | |||||
| (6) |
where m s-1 is the equatorial rotation speed of Ceres. The solar spectrum reflected by the -th surface element and observed on the Earth is shifted by a total radial velocity .
To compute the RV variations, we consider a mean local spectral line with a Gaussian profile of central depth of 0.45 and full width at half maximum of 7035 m s-1 that provide a good approximation to the cross-correlation function of the true solar spectrum as given by HARPS pipeline. The local line profile is Doppler shifted by the radial velocity and the intensity of the local continuum is assumed to be:
| (7) |
where is a constant giving the intensity in the case of normal illumination and reflection, the albedo of the surface element, its area, and a function that is equal to 1 when its argument is positive and is zero otherwise, so that the local continuum is zero when the given surface element is not visible or is not illuminated by the Sun. Eq. (7) assumes that the solar intensity reflected towards the observer is proportional to according to Lambert’s law, but it does not include any opposition surge effect. To compute the mean line profile integrated over the illuminated portion of Ceres’ disc, we sum up all the local line profiles by weighting them proportionally to the intensity of their local continuum. Then the RV is obtained by fitting a Gaussian to the mean integrated line profile.
The synthetic RV values must be scaled to reproduce the amplitude of the observed RV modulation because of the assumptions of our model. The resulting model is overplotted to the radial velocity measurements once corrected by the offset of 115.4 m s-1 in Fig 1. As discussed previously, this is the expected offset and our model provides a fair reproduction of the data points once the amplitude of the synthetic radial velocity variations are properly scaled. Note that a spot produces no change in radial velocity at the phase when the sub-observer longitude is equal to its longitude because this is when it passes exactly through the central meridian of Ceres’ disc and in fact in correspondence of the Chamberlain et al’ s maxima there are no shifts in radial velocities. We found also that minima in the photometric curve do not produce significant features in radial velocities.
4 Discussion
Although a model based on the average albedo variations as derived by Chamberlain et al. can provide a general description of the RV modulation, in particular matching the radial velocities at certain longitudes, an intrinsic variability is required to explain the difference between the radial velocities measured in the two epochs, specifically to account for the non reproducibility of the radial velocities with phase. One possibility is an intrinsic change of albedo of the bright features corresponding to Occator in July and to the photometric maximum at phase in August. The variability occurs when they are seen in the approaching hemisphere. For instance, on its rise on the night of July 31, Occator was in the approaching hemisphere and when it reached a distance of from the central meridian the most negative radial velocity was observed, in line with the predicted RV minimum produced by a bright spot there (cf. Eqs. 5 and 6). Note that a similar negative radial velocity was observed when Ceres completed an entire rotation and Occator became visible again. After the passage across the central meridian the RV curve became close to the synthetic one computed with the average albedo distribution, which implies no contribution to the radial velocity curve by this feature. Thus, a strong reflectance of the bright spot in Occator when it rose on the visible hemisphere and its subsequent fast decrease could mimic the observed radial velocity variation in July. Nevertheless, Occator did not play any major role during the August observations implying a significant reduction in the albedo of this spot at that time. To explain the variability in August a change of the stronger maximum of Chamberlain et al.’s light curve around longitude when seen in the approaching hemisphere is needed. This produces slightly more negative velocities at phases to .
Perna et al. (2015) found variations in the slope of visible spectra at the level of 2-3 percent over 1000 Angstrom with a variation in the relative reflectivity of about 10 percent in the region between 500 and 800 nm. Herschel detected water vapor plumes erupting off the surface of Ceres, which may come from volcano-like ice geysers (Küppers et al., 2014). The recent Dawn observations suggest that the bright spots could provide some atmosphere in this particular region of Ceres confirming Herschel’s water vapor detection (Witze, 2015). It has been noted that the spots appear bright at dawn on Ceres while they seem to fade by dusk. That could mean that sunlight plays an important role, for instance by heating up ice just beneath the surface and causing it to blast off some kind of plume or other feature.
It is possible to speculate that a volatile substance could evaporate from the inside and freezes when it reaches the surface in shade. When it arrives on the illuminated hemisphere, the patches may change quickly under the action of the solar radiation loosing most of its reflectivity power when it is in the receding hemisphere. This could explain why we do not see an increase in positive radial velocities, but all the changes in the radial velocity curves are characterized by negative values. After being melted by the solar heat, the patches can form again during the four-hours-and-a-half duration of the night, but not exactly in the previous fashion, thus the RV curve varies from one rotation to the other. It is possible that the cycle of evaporation and freezing could last more than one rotational period and so the changes in the albedo which are responsible of the variations in the radial velocity. The photometry variability induced by these patches could have been below the detectability threshold of Chamberlain et al. of mag but should be noted by Dawn. Dawn is able to resolve the disk of Ceres and should be able to see the patches of ice as changes in the localized reflectivity. Indeed, after submission of this paper Nathues et al. (2015) reported the presence of localized bright areas which are consistent with hydrate magnesium sulfates. They found a bright pit on the floor of crater Occator that shows probable sublimation of water ice, producing haze clouds inside which appear and disappear with a diurnal rhythm. In particular, their figure 4 shows a diffuse haze that fills the floor of Occator and that disappears almost completely at dusk, and this we believe could be a physical framework for the daily variability we have detected in radial velocities. If a closer connection can be established between the two effects it will be an opportunity to monitor the daily activity in Ceres that can continue also beyond the space mission.
In conclusion, the observed RV pattern is likely associated with a change in the albedo of the material producing the photometric light curve variations but with some additional contributions of more contrasted features such as the spots in Occator. With the observations at our disposal we suggest the presence of short-term variability of Ceres’ albedo on timescale of days or months. However, this has testable predictions and can be confirmed and further refined by means of dedicated radial velocity observations and a detailed analysis of Dawn’s images.
References
- Chamberlain, Sykes & Esquerdo (2007) Chamberlain M. A., Sykes M. V., Esquerdo G. A., 2007, Icarus, 188, 451
- Küppers et al. (2014) Küppers M. et al., 2014, Nature, 505, 525
- Kurucz et al. (1984) Kurucz R. L., Furenlid I., Brault J., Testerman L., 1984, Solar flux atlas from 296 to 1300 nm
- Lanza et al. (2015) Lanza A., Molaro P., Monaco L., Haywood R., 2015, A&A
- Lanza & Molaro (2015) Lanza A. F., Molaro P., 2015, Experimental Astronomy, 39, 461
- Li et al. (2006) Li J.-Y., McFadden L. A., Parker J. W., Young E. F., Stern S. A., Thomas P. C., Russell C. T., Sykes M. V., 2006, Icarus, 182, 143
- Lo Curto et al. (2015) Lo Curto G. et al., 2015, The Messenger, in press
- Molaro et al. (2015) Molaro P., Barbieri M., Monaco L., Zaggia S., Lovis C., 2015, MNRAS, 453, 1684
- Molaro & Centurión (2011) Molaro P., Centurión M., 2011, A&A, 525, A74
- Molaro et al. (2013) Molaro P., Monaco L., Barbieri M., Zaggia S., 2013, MNRAS, 429, L79
- Molaro & Monai (2012) Molaro P., Monai S., 2012, A&A, 544, A125
- Nathues et al. (2015) Nathues A. et al., 2015, Nature, 528, 237
- Perna et al. (2015) Perna D., Kaňuchová Z., Ieva S., Fornasier S., Barucci M. A., Lantz C., Dotto E., Strazzulla G., 2015, A&A, 575, L1
- Queloz et al. (2000) Queloz D., Eggenberger A., Mayor M., Perrier C., Beuzit J. L., Naef D., Sivan J. P., Udry S., 2000, A&A, 359, L13
- Witze (2015) Witze A., 2015, Nature, 519, 401
Acknowledgments
This program used Director Discretionary Time at ESO and we warmly acknowledge ESO director for this opportunity together with the La Silla staff for the collaboration and competence during the execution of the observations. Discussions with Ivo Saviane and Francesco Pepe at different stages of this work are also acknowledged.
| Date | MJD | RV | RVc | BERV | Exp | T’ | JDMIDEXP | ||
|---|---|---|---|---|---|---|---|---|---|
| m s-1 | m s-1 | m s-1 | s | m s-1 | m s-1 | m s-1 | |||
| 2015-07-30 23:33:06 | 2457233.98138201 | 914.885 | 914.578 | -3203.246 | 179.9 | 0.50 | 2457234.48131 | 671.421 | 3357.268 |
| 2015-07-30 23:51:29 | 2457233.99414785 | 917.027 | 916.741 | -3224.302 | 779.9 | 0.54 | 2457234.49408 | 671.371 | 3371.657 |
| 2015-07-31 00:11:23 | 2457234.00353524 | 926.589 | 926.437 | -3236.302 | 779.9 | 0.49 | 2457234.50790 | 671.317 | 3389.635 |
| 2015-07-31 00:25:32 | 2457234.01292216 | 927.485 | 927.276 | -3250.686 | 779.9 | 0.54 | 2457234.51773 | 671.279 | 3403.891 |
| 2015-07-31 00:38:32 | 2457234.02230851 | 931.640 | 931.080 | -3264.919 | 779.9 | 0.50 | 2457234.52675 | 671.244 | 3418.031 |
| 2015-07-31 00:52:08 | 2457234.03175053 | 932.855 | 932.761 | -3280.839 | 779.9 | 0.50 | 2457234.53620 | 671.207 | 3433.858 |
| 2015-07-31 01:05:47 | 2457234.04113954 | 932.896 | 932.570 | -3297.837 | 779.9 | 0.51 | 2457234.54568 | 671.170 | 3450.765 |
| 2015-07-31 01:19:18 | 2457234.05052624 | 934.205 | 933.700 | -3315.651 | 779.9 | 0.51 | 2457234.55506 | 671.134 | 3468.473 |
| 2015-07-31 01:32:50 | 2457234.05991305 | 932.692 | 932.504 | -3334.361 | 779.9 | 0.51 | 2457234.56446 | 671.097 | 3487.118 |
| 2015-07-31 02:02:21 | 2457234.08032856 | 924.051 | 923.737 | -3387.639 | 779.9 | 0.52 | 2457234.58496 | 671.018 | 3530.718 |
| 2015-07-31 02:15:37 | 2457234.08971583 | 923.760 | 923.602 | -3408.513 | 779.9 | 0.50 | 2457234.59417 | 670.982 | 3551.508 |
| 2015-07-31 02:27:26 | 2457234.09910253 | 921.673 | 921.613 | -3429.829 | 779.9 | 0.47 | 2457234.60238 | 670.950 | 3570.585 |
| 2015-07-31 02:42:39 | 2457234.10848969 | 921.452 | 921.234 | -3453.032 | 779.9 | 0.50 | 2457234.61295 | 670.909 | 3595.859 |
| 2015-07-31 02:57:52 | 2457234.11915158 | 922.022 | 921.713 | -3479.130 | 779.9 | 0.49 | 2457234.62351 | 670.868 | 3621.848 |
| 2015-07-31 03:11:23 | 2457234.12853526 | 923.979 | 923.878 | -3502.820 | 779.9 | 0.49 | 2457234.63290 | 670.831 | 3645.457 |
| 2015-07-31 03:24:45 | 2457234.13792207 | 922.025 | 922.003 | -3526.693 | 779.9 | 0.48 | 2457234.64218 | 670.795 | 3669.219 |
| 2015-07-31 03:39:11 | 2457234.14730844 | 922.650 | 922.747 | -3552.847 | 779.9 | 0.55 | 2457234.65221 | 670.756 | 3695.265 |
| 2015-07-31 04:05:28 | 2457234.16636159 | 926.459 | 926.326 | -3601.166 | 779.9 | 0.46 | 2457234.67046 | 670.685 | 3743.455 |
| 2015-07-31 04:19:22 | 2457234.17574598 | 923.333 | 923.457 | -3626.983 | 779.9 | 0.49 | 2457234.68011 | 670.648 | 3769.190 |
| 2015-07-31 04:33:08 | 2457234.18512527 | 928.590 | 928.800 | -3652.623 | 779.9 | 0.51 | 2457234.68967 | 670.611 | 3794.748 |
| 2015-07-31 04:52:32 | 2457234.19904883 | 916.802 | 916.704 | -3702.054 | 779.9 | 0.46 | 2457234.70314 | 670.558 | 3830.735 |
| 2015-07-31 05:07:29 | 2457234.20843368 | 916.405 | 916.379 | -3729.726 | 779.9 | 0.57 | 2457234.71353 | 670.518 | 3858.322 |
| 2015-07-31 05:19:34 | 2457234.21781795 | 917.362 | 917.358 | -3751.936 | 779.9 | 0.46 | 2457234.72192 | 670.485 | 3880.455 |
| 2015-07-31 05:33:36 | 2457234.22720429 | 918.551 | 918.331 | -3777.466 | 779.9 | 0.50 | 2457234.73166 | 670.448 | 3905.901 |
| 2015-07-31 05:47:48 | 2457234.23680814 | 921.090 | 921.056 | -3802.994 | 779.9 | 0.53 | 2457234.74152 | 670.409 | 3931.290 |
| 2015-07-31 06:00:49 | 2457234.24620873 | 917.738 | 917.472 | -3825.965 | 779.9 | 0.49 | 2457234.75056 | 670.374 | 3954.179 |
| 2015-07-31 06:14:37 | 2457234.25559787 | 920.371 | 920.174 | -3849.816 | 779.9 | 0.51 | 2457234.76015 | 670.337 | 3977.972 |
| 2015-07-31 06:27:51 | 2457234.26498376 | 919.552 | 919.722 | -3872.227 | 779.9 | 0.49 | 2457234.76934 | 670.301 | 4000.268 |
| 2015-07-31 06:41:38 | 2457234.27445472 | 917.456 | 917.350 | -3894.926 | 779.9 | 0.50 | 2457234.77891 | 670.264 | 4022.884 |
| 2015-07-31 06:55:41 | 2457234.28384802 | 916.585 | 916.404 | -3917.367 | 779.9 | 0.54 | 2457234.78866 | 670.226 | 4045.232 |
| 2015-07-31 07:08:49 | 2457234.29323588 | 917.716 | 917.553 | -3937.646 | 779.9 | 0.51 | 2457234.79778 | 670.190 | 4065.418 |
| 2015-07-31 07:21:48 | 2457234.30262281 | 918.190 | 917.813 | -3956.999 | 779.9 | 0.47 | 2457234.80680 | 670.155 | 4084.654 |
| 2015-07-31 07:40:31 | 2457234.31507058 | 899.861 | 899.612 | -3996.341 | 779.9 | 0.53 | 2457234.81980 | 670.105 | 4111.025 |
| 2015-07-31 07:54:10 | 2457234.32446365 | 902.315 | 902.130 | -4014.586 | 779.9 | 0.54 | 2457234.82928 | 670.068 | 4129.177 |
| 2015-07-31 08:06:54 | 2457234.33384849 | 904.157 | 903.830 | -4030.755 | 779.9 | 0.48 | 2457234.83812 | 670.034 | 4145.240 |
| 2015-07-31 08:20:32 | 2457234.34323427 | 900.641 | 900.403 | -4047.094 | 779.9 | 0.49 | 2457234.84759 | 669.997 | 4161.463 |
| 2015-07-31 08:35:06 | 2457234.35335007 | 899.825 | 899.475 | -4063.372 | 779.9 | 0.49 | 2457234.85770 | 669.958 | 4177.637 |
| 2015-07-31 08:48:30 | 2457234.36273677 | 898.333 | 898.064 | -4077.237 | 779.9 | 0.48 | 2457234.86701 | 669.921 | 4191.418 |
| 2015-07-31 09:02:00 | 2457234.37212336 | 898.801 | 898.521 | -4090.155 | 779.9 | 0.48 | 2457234.87638 | 669.885 | 4204.205 |
| 2015-07-31 09:14:37 | 2457234.38150995 | 894.008 | 893.800 | -4101.183 | 779.9 | 0.41 | 2457234.88515 | 669.851 | 4215.134 |
| Date | MJD | RV | RVc | BERV | Exp | T’ | JDMIDEXP | ||
|---|---|---|---|---|---|---|---|---|---|
| m s-1 | m s-1 | m s-1 | s | m s-1 | m s-1 | m s-1 | |||
| 2015-08-26 23:36:05 | 2457260.98339249 | -2056.98 | -2057.768 | -17583.323 | 179.99 | 0.50 | 2457261.48440 | 564.365 | 14849.496 |
| 2015-08-26 23:42:28 | 2457260.98783118 | -2058.01 | -2058.517 | -17602.255 | 899.99 | 0.54 | 2457261.49340 | 564.329 | 14867.509 |
| 2015-08-26 23:57:59 | 2457260.99860058 | -2058.04 | -2058.533 | -17624.754 | 899.99 | 0.52 | 2457261.50400 | 564.286 | 14889.613 |
| 2015-08-27 00:13:30 | 2457261.00938260 | -2056.57 | -2057.134 | -17648.810 | 899.99 | 0.53 | 2457261.51490 | 564.242 | 14913.262 |
| 2015-08-27 00:29:01 | 2457261.02015688 | -2057.93 | -2058.440 | -17672.274 | 899.99 | 0.48 | 2457261.52510 | 564.201 | 14936.154 |
| 2015-08-27 00:46:51 | 2457261.03254109 | -2058.62 | -2059.234 | -17702.217 | 899.99 | 0.51 | 2457261.53780 | 564.150 | 14965.563 |
| 2015-08-27 01:02:22 | 2457261.04331652 | -2058.69 | -2059.002 | -17727.530 | 899.99 | 0.48 | 2457261.54830 | 564.107 | 14990.529 |
| 2015-08-27 01:17:53 | 2457261.05409346 | -2059.29 | -2059.711 | -17754.388 | 899.99 | 0.49 | 2457261.55920 | 564.063 | 15016.965 |
| 2015-08-27 01:33:24 | 2457261.06486773 | -2059.02 | -2059.422 | -17781.380 | 899.99 | 0.49 | 2457261.56990 | 564.020 | 15043.326 |
| 2015-08-27 01:49:00 | 2457261.07569454 | -2059.07 | -2059.489 | -17809.909 | 899.99 | 0.53 | 2457261.58120 | 563.974 | 15071.493 |
| 2015-08-27 02:04:30 | 2457261.08646442 | -2059.27 | -2059.706 | -17836.587 | 899.99 | 0.50 | 2457261.59160 | 563.932 | 15097.609 |
| 2015-08-27 02:20:01 | 2457261.09723998 | -2059.28 | -2059.470 | -17864.206 | 899.99 | 0.50 | 2457261.60240 | 563.889 | 15124.820 |
| 2015-08-27 02:35:32 | 2457261.10801539 | -2059.29 | -2059.802 | -17891.783 | 899.99 | 0.50 | 2457261.61320 | 563.845 | 15152.014 |
| 2015-08-27 02:51:07 | 2457261.11884118 | -2056.63 | -2056.970 | -17919.642 | 899.99 | 0.51 | 2457261.62410 | 563.801 | 15179.332 |
| 2015-08-27 03:06:38 | 2457261.12961279 | -2055.70 | -2055.898 | -17947.668 | 899.99 | 0.54 | 2457261.63520 | 563.756 | 15206.906 |
| 2015-08-27 03:22:09 | 2457261.14038834 | -2055.70 | -2055.861 | -17972.477 | 899.99 | 0.46 | 2457261.64510 | 563.716 | 15231.195 |
| 2015-08-27 03:37:40 | 2457261.15116389 | -2056.25 | -2056.495 | -18000.224 | 899.99 | 0.51 | 2457261.65640 | 563.671 | 15258.461 |
| 2015-08-27 03:53:50 | 2457261.16238518 | -2058.62 | -2059.007 | -18027.431 | 899.99 | 0.52 | 2457261.66780 | 563.625 | 15285.359 |
| 2015-08-27 04:09:20 | 2457261.17315436 | -2056.75 | -2057.070 | -18052.635 | 899.99 | 0.52 | 2457261.67850 | 563.581 | 15309.942 |
| 2015-08-27 04:24:51 | 2457261.18393002 | -2056.86 | -2057.360 | -18076.632 | 899.99 | 0.50 | 2457261.68910 | 563.538 | 15333.567 |
| 2015-08-27 04:40:22 | 2457261.19470522 | -2057.71 | -2057.788 | -18100.291 | 899.99 | 0.50 | 2457261.69990 | 563.495 | 15356.801 |
| 2015-08-27 04:56:42 | 2457261.20604863 | -2057.93 | -2058.313 | -18124.398 | 899.99 | 0.51 | 2457261.71130 | 563.449 | 15380.308 |
| 2015-08-27 05:12:13 | 2457261.21682348 | -2057.41 | -2057.577 | -18145.619 | 899.99 | 0.49 | 2457261.72190 | 563.406 | 15401.141 |
| 2015-08-27 05:27:44 | 2457261.22759891 | -2056.97 | -2057.160 | -18166.765 | 899.99 | 0.52 | 2457261.73300 | 563.361 | 15421.814 |
| 2015-08-27 05:43:16 | 2457261.23838592 | -2058.20 | -2058.406 | -18185.583 | 899.99 | 0.49 | 2457261.74340 | 563.319 | 15440.050 |
| 2015-08-27 06:02:28 | 2457261.25171811 | -2059.08 | -2059.487 | -18207.505 | 899.99 | 0.47 | 2457261.75660 | 563.266 | 15461.516 |
| 2015-08-27 06:17:59 | 2457261.26249690 | -2062.50 | -2062.708 | -18224.963 | 899.99 | 0.53 | 2457261.76800 | 563.220 | 15478.459 |
| 2015-08-27 06:33:30 | 2457261.27327013 | -2059.84 | -2059.847 | -18239.478 | 899.99 | 0.49 | 2457261.77830 | 563.178 | 15492.437 |
| 2015-08-27 06:49:01 | 2457261.28404742 | -2061.54 | -2061.933 | -18253.307 | 899.99 | 0.50 | 2457261.78920 | 563.134 | 15505.802 |
| 2015-08-28 06:05:08 | 2457262.25357302 | -2164.08 | -2164.023 | -18648.104 | 179.99 | 0.51 | 2457262.75860 | 559.216 | 15808.005 |
| 2015-08-28 06:13:37 | 2457262.25946192 | -2169.41 | -2169.494 | -18663.502 | 899.99 | 0.50 | 2457262.76460 | 559.192 | 15816.716 |
| 2015-08-28 06:29:08 | 2457262.27023769 | -2170.04 | -2170.191 | -18678.809 | 899.99 | 0.52 | 2457262.77560 | 559.147 | 15831.567 |
| 2015-08-28 06:44:39 | 2457262.28101416 | -2171.18 | -2171.264 | -18691.769 | 899.99 | 0.47 | 2457262.78590 | 559.105 | 15844.119 |
| 2015-08-28 07:00:10 | 2457262.29179040 | -2173.17 | -2173.340 | -18704.048 | 899.99 | 0.48 | 2457262.79670 | 559.062 | 15855.832 |